Introduction
Multiple sclerosis (MS) is a disorder characterized by demyelination, inflammation, and degeneration of the central nervous system (CNS) (Compston & Coles, Reference Compston and Coles2008), resulting in long-term physical and cognitive impairments. Cognitive deficits affect between 43% and 70% of individuals with MS. Deficits in processing speed (PS), defined as “the amount of time it takes to process a set of information, or the amount of information that can be processed in a certain unit of time” (Chiaravalloti, Stojanovic-Radic, & DeLuca, Reference Chiaravalloti, Stojanovic-Radic and DeLuca2013), are prevalent in individuals with MS and have been shown to negatively affect employment (Strober et al., Reference Strober, Christodoulou, Benedict, Westervelt, Melville, Scherl and Krupp2012), daily functioning and quality of life (Barker-Collo, Reference Barker-Collo2006). Previous studies demonstrated that PS deficits can affect other cognitive domains such as working memory (Genova et al., 2012), learning and memory (Chiaravalloti et al., Reference Chiaravalloti, Stojanovic-Radic and DeLuca2013), and executive functions (Denney & Lynch, Reference Denney and Lynch2009).
Despite the recognized prevalence and negative impact of PS impairment on daily functioning in MS, the neural mechanisms of PS are poorly understood. Most of our knowledge on PS impairments in MS has been garnered from neuropsychology, which has used tests such as the Symbol Digit Modalities Test (SDMT). The SDMT requires participants to pair symbols with corresponding numbers based on a coding key as fast as possible and has been shown to be the most accurate predictor of PS impairment in MS (Van Schependom et al., Reference Van Schependom, D’hooghe, Cleynhens, D’hooge, Haelewyck, De Keyser and Nagels2015). To date, there are few studies that used the SDMT modified for functional magnetic resonance imaging (fMRI) to examine neural correlates of PS (Forn et al., Reference Forn, Belloch, Bustamante, Garbin, Parcet-Ibars, Sanjuan and Avila2009; Genova, Hillary, Wylie, Rypma, & Deluca, Reference Genova, Hillary, Wylie, Rypma and Deluca2009; Leavitt, Wylie, Genova, Chiaravalloti, & DeLuca, Reference Leavitt, Wylie, Genova, Chiaravalloti and DeLuca2012). For example, Genova et al. modified the SDMT for use in the MRI scanner so that on each trial subjects are presented with a single number-symbol panel and have to match a probe to a panel of numbers and symbols, allowing researchers to examine neural processes that rely on processing speed on each individual trial.
There are two versions of SDMT adapted for the use in fMRI studies. While the adapted versions of the SDMT are different (event-related vs. blocked fMRI design in Genova et al. (Reference Genova, Hillary, Wylie, Rypma and Deluca2009) and Forn et al. (Reference Forn, Belloch, Bustamante, Garbin, Parcet-Ibars, Sanjuan and Avila2009), respectively), both papers present similar results. The modified SDMT (mSDMT) activates occipital regions, inferior parietal lobule (IPL; BA 40), fusiform gyrus (BA 37), medial temporal gyrus (BA 39), supplementary motor area (SMA; BA 6), and attentional control areas of the prefrontal cortex (PFC; BA 9, BA 24). Genova et al. (Reference Genova, Hillary, Wylie, Rypma and Deluca2009) also report greater activation of the fronto-parietal network in healthy controls (HCs) compared to MS participants, suggesting that MS participants use neural mechanisms differently from HCs during mSDMT performance. Because MS affects the CNS diffusely, it is important to examine how the regions within the network interact instead of focusing on individual areas.
Examination of region interaction can be done using functional connectivity and effective connectivity methods. Functional connectivity analysis provides correlational information about the blood oxygen level dependent (BOLD) signal from several regions. Effective connectivity offers the advantage of examining how one region influences or causes activity in another region during a specific neural process (Friston, Reference Friston1994). Therefore, effective connectivity analysis provides a means to investigate the dynamic interactions between brain regions while subjects are engaged in specific cognitive processes. Previous work examining effective connectivity during mSDMT (Leavitt et al., Reference Leavitt, Wylie, Genova, Chiaravalloti and DeLuca2012) used a priori regions of interest that are related to working memory processes rather than PS per se and used Granger causality analysis, the assumptions of which might not be appropriate for fMRI data analysis under certain conditions (Deshpande & Hu, Reference Deshpande and Hu2012; Poldrack, Mumford, & Nichols, Reference Poldrack, Mumford and Nichols2011; Smith et al., Reference Smith, Miller, Salimi-Khorshidi, Webster, Beckmann, Nichols and Woolrich2011, Reference Smith, Bandettini, Miller, Behrens, Friston, David and Nichols2012).
Therefore, to better understand the neural mechanisms involved in PS and to gain better understanding of PS deficits in MS, we examined causal relationships between the brain regions associated with the mSDMT performance in three groups: HCs, MS individuals who have PS impairment (PSimp), and MS individuals who do not have PS impairment (PSintact). MS patients were subdivided on the PSimp and PSintact groups to differentiate between network activity associated with MS generally and with PS deficits specifically. Thus, in the current study we: (1) determined brain regions associated with PS in HC to establish regions involved in mSDMT performance in the healthy brain and then (2) examined differences in the causal relationship between regions involved in PS in the three groups of subjects. More importantly, instead of using a hypothesis-driven approach with a priori regions of interest (ROIs) we used a Bayesian-based data-driven effective connectivity method and functionally determined ROIs. This approach has been shown to result in more accurate estimation of connections between the brain regions (Smith et al., Reference Smith, Miller, Salimi-Khorshidi, Webster, Beckmann, Nichols and Woolrich2011).
Methods
Participants
The study included 18 HCs and 21 individuals with MS. In the MS group, 16 participants were diagnosed with relapsing-remitting, three with secondary-progressive and one with primary-progressive MS (McDonald et al., Reference McDonald, Compston, Edan, Goodkin, Hartung, Lublin and Wolinsky2001). MS participants were categorized as having PS impairment (PSimp; n=8) if performance on the oral version of the SDMT (Smith, 1982) was 1.5 SDs or more below the mean based on published normative data (Parmenter, Testa, Schretlen, Weinstock-Guttman, & Benedict, Reference Parmenter, Testa, Schretlen, Weinstock-Guttman and Benedict2010); MS participants performing within 1.5 SD were included in the PS intact group (PSintact; n=13).
There were no differences in education level, pre-morbid intelligence, months since diagnoses or ambulation index (Table 1), indicating that PSimp and PSintact groups did not differ on disease characteristics. The three groups differed in age and gender (Table 1). Therefore, these variables were included as covariates for the analysis of behavioral data on mSDMT and effective connectivity analysis. Age and gender corrected Z scores were used for neuropsychological task performance, and thus, analysis of variance (ANOVA) was used to examine differences on these variables.
Participant demographics

AI=ambulation index; SD=standard deviation; M=male; F=female.
Participants were excluded if they reported any significant history of medical or psychiatric disorders, drug abuse, or learning disability. Participants were excluded if they reported abnormal color vision, visual acuity worse then 20/70 in both eyes based on the Snell Charts Test. Participants with MS were at least 4 weeks past most recent exacerbation and use of steroids, benzodiazepines, or neuroleptics. All participants signed an informed consent form approved by the Institutional Review Boards of Kessler Foundation and Rutgers New Jersey Medical School.
Procedure
Scan session
fMRI data was acquired with a 3T Siemens Allegra scanner. The 32 contiguous slices of functional images were acquired using T2-weighted pulse sequence for each run of the task. There were 240 acquisitions per run [echo time (TE)=30 ms; repetition time (TR)=2000 ms; field of view=22 cm; flip angle=80°; slice thickness=4 mm, matrix=64×64, in-plane resolution=3.438 mm2]. High-resolution MPRAGE images were also acquired and used to normalize the functional data into standard space (TE=4.38 ms; TR=2000 ms, field of view=220 mm; flip angle=8°; slice thickness=1 mm, number of excitations=1, matrix=256×256, in-plane resolution=0.859×0.859 mm).
Behavioral paradigm
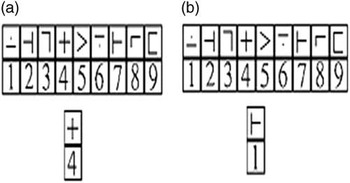
During scanning, subjects were presented with the mSDMT, a task previously validated in MS and HC (Genova et al., Reference Genova, Hillary, Wylie, Rypma and Deluca2009) (Figure 1). The paradigm was presented in the scanner in an event-related design using E-Prime software. On each trial, subjects were presented with a panel containing 9 number-symbol combinations. A number-symbol probe was presented below the panel and subjects had to indicate whether the probe matched a number-symbol pair in the panel. Subjects were asked to respond as quickly as possible when they saw a match. Each trial lasted 3.5 s. During this time participants had to respond whether the trial is a match. The interstimuls interval was jittered; that is, the trials were separated with a fixation point that varied in duration (it was 0, 4, 8, or 12 s). There were 4 task blocks, each lasting 7 min and each composed of 55 trials.
On each trial, subjects were presented with a panel containing 9 number-symbol combinations. A number-symbol probe was presented below the panel and subjects had to indicate wither the probe matched a number-symbol pair in the panel. Subjects were asked to respond as quickly as possible when they saw a match. They were given 3.5 seconds to respond, which was also the duration of each trial. Reprinted with permission from Genova, H. M., Hillary, F. G., Wylie, G., Rypma, B., & Deluca, J. Examination of processing speed deficits in multiple sclerosis using functional magnetic resonance imaging. Journal of the International Neuropsychological Society, 15(3), 383–393.

Neuropsychological evaluation
Cognitive function was assessed with: California Verbal Learning Test II Brief Visual Memory Test, Symbol Digit Modalities Test, and Paced Auditory Serial Addition Test. For all neuropsychological tests, Z scores were calculated based on published normative data that controlled for age, gender, and education (Parmenter et al., Reference Parmenter, Testa, Schretlen, Weinstock-Guttman and Benedict2010).
Data Analysis
fMRI data
All images were preprocessed using AFNI (Cox, Reference Cox1996). The first 5 images of each run were discarded to ensure steady state magnetization. Preprocessing included slice-time correction, three-dimensional motion correction using six parameters, despiking and spatial smoothing (using an 8 mm Gaussian smoothing kernel). The high-resolution MPRAGE (0.859×0.859×1 mm voxels) was co-registered with the functional data and normalized to Talairach stereotaxic space. The following AFNI routines were used: 3dTshift for slice time correction, 3dDespike to remove spikes in the data that might be due to motion or changes in mean intensity, 3dvolreg for motion correction/registration (all images were registered to the 1st slice), 3dBlurToFWHM for data smoothing, 3dcalc for scaling the data to the mean intensity across time. These data were used to compute the percent signal change in the BOLD signal in the HC group.
To determine individual activation maps for the HC group, brain activity corresponding to trial duration was convolved with a canonical hemodynamic response function and included in a general linear model (GLM) analysis. Because we wanted brain activity associated with mSDMT to reflect activation related specifically to processing speed, RT for each correct trial was entered in the model as a parametric modulator. Motion parameters were included as regressors of no interest. An ROI analysis was performed based on the group activation map of the HC group. That is, ROIs were functionally defined (Poldrack, Reference Poldrack2007) based on the activation from the HC group.
Effective connectivity analysis: IMaGES and LOFS
Effective connectivity analysis was performed on a set of slice-time corrected, smoothed and spatially normalized time series. Time series identified by the ROI analysis were analyzed with IMaGES and LOFS algorithms using Tetrad software (version 5.3) (http://www.phil.cmu.edu/projects/tetrad/) (Ramsey et al., Reference Ramsey, Hanson, Hanson, Halchenko, Poldrack and Glymour2010; Ramsey, Hanson, & Glymour, Reference Ramsey, Hanson and Glymour2011).
The IMaGES algorithm establishes connections based on a search over the possible connectivity graphs. The IMaGES search examines several possible connectivity graphs for each subject, where each connection is evaluated, one by one with a goal of finding the most optimal Bayesian Information Criterion (BIC) score. That is, connections are being added to the connectivity graph incrementally, until the optimal BIC score is determined. BIC score indicates the maximum likelihood estimation of the model fit given its complexity. When the BIC score stops improving, the algorithm performs a similar operation in the backward manner, that is, removing connections one by one until the optimal BIC score is determined. The connections for the group connectivity graph are determined based on the aggregate BIC score calculated from each subject’s data and the model with the smallest BIC is chosen. The final connectivity graph has both directed and undirected connections and is fed into the LOFs algorithm. The LOFs algorithm then evaluates the degree of non-Gaussianity in the model and directs the connections such that the model with most non-Gaussian residuals gets selected (Mumford & Ramsey, Reference Mumford and Ramsey2014; Ramsey et al., Reference Ramsey, Hanson, Hanson, Halchenko, Poldrack and Glymour2010; Ramsey et al., Reference Ramsey, Hanson and Glymour2011; Ramsey, Sanchez-romero, & Glymour, Reference Ramsey, Sanchez-romero and Glymour2014).
Behavioral data
Neuropsychological data from three HCs were not available. BVMT-R data was not available for one PSintact participant, and PASAT data were not available for one PSimp participant. ANOVA was performed to assess differences between groups on neuropsychological tests. An analysis of covariance (ANCOVA) with age and gender as covariates was performed to assess differences between groups on mSDMT accuracy and RT.
Results
Behavioral Results
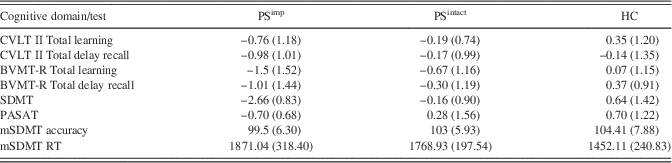
Neuropsychological data for the three groups are presented in Table 2. Significant differences were found between groups for visual learning and visual delay recall [BVMT-R learning (F(2,32)=4.26; p=.02; ƞ=0.21); BVMT-R delay recall (F(2,32)=3.92; p=.03; ƞ=0.2), and visual processing speed [SDMT (F(2,33)=22,37; p<.001; ƞ=0.58]. Post hoc analyses revealed that the PSimp group performed significantly worse on both visual learning and visual delay recall compared to the HC group (BVMT-R learning (t(21)=−2.79; p=.01; d=1.1); and BVMT-R delay recall, (t(21)=−2.83; p=.01; d=0.5), but not in comparison with the PSintact group. As expected, PSimp group performed significantly worse on the SDMT in contrast to both HC (t(21)=6.02; p<.0001; d=1.76) and PSintact (t(19)=6.34; p<.0001; d=2.89) groups. No significant differences were found between groups for verbal learning and memory [CVLT learning (F(2,33)=3; p=.06; ƞ=0.15); or CVLT long delay (F(2,35)=1.1; p=0.35; ƞ=0.07), and working memory [PASAT F(2,32)=2.81; p=.07; ƞ=0.15].
Neuropsychological evaluation

Note. Z-score means and standard deviations are presented for CVLT II, BVMTR, SDMT, and PASAT. mSDMT data represents total correct responses and total RT for each group.
SDMT=Symbol Digit Modality Test; PASAT=Paced Auditory Serial Addition Test; CVLT II=California Learning Verbal Test=II; BVMT-R=Brief Visual Memory Test=Revised.
mSDMT Results
No significant between-group differences were observed in accuracy on mSDMT (F(2,35)=1.19; p=.29; ƞ=0.03). Significant differences were found in RT (F(2,35)=5.75; p<0.05; ƞ=0.3). Average RT of the HC group was significantly shorter than the RT of the PSimp (t(22)=3.05; p<.01; d=1.27) and PSintact (t(27)=3.07; p<.01; d=1.16) groups (Table 2). No differences were found between the two MS groups (p=.37; d=0.39).
GLM Results
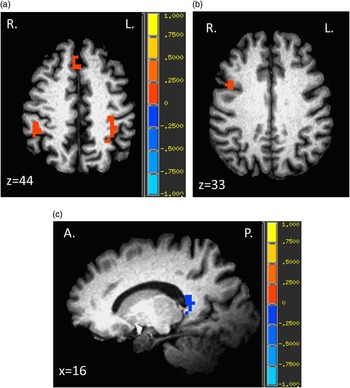
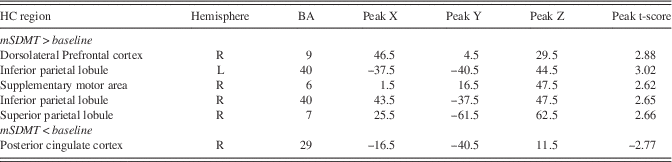
To identify the PS network, brain activity associated with mSDMT performance in the HC group was compared to baseline activity, revealing areas of the fronto-parietal attention network (p<.05; corrected for multiple comparisons). Regions engaged in the mSDMT in the HC group are presented in Table 3 (Figure 2).
a: HC activation map showing mSDMT>baseline activation in the right and left IPL and in the SMA. b: HC activation map showing mSDMT>baseline activation in the right DLFPC. c: HC activation map showing mSDMT<baseline activation in the PCC.

Brain regions showing increased BOLD activity compared to baseline during mSDMT (p<.05, corrected for multiple comparisons) in a sample of healthy participants (HC)

Effective Connectivity Results
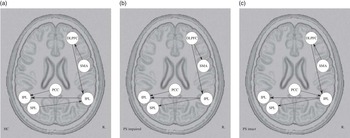
Effective connectivity analysis was performed on time series from ROIs activated in the HC group during mSDMT performance. Five directed connections between the regions of the fronto-parietal network were observed in the HC group (Figure 3a). The information in the right-lateralized attention network was transferred from the SMA (BA 6), influencing activity in the right IPL thorough the DLPFC. Effective connectivity analysis for the PSimp group revealed several differences in the directionality of connections compared to the HC group (Figure 3b). There were two reversed connections in the PSimp compared to the HC group: (1) the DLPFC influenced activity in the SMA and (2) the right IPL influenced activity in the left superior parietal lobule (SPL).
a: Effective connectivity graph representing information flow during the mSDMT for HC group. b: Effective connectivity graph representing information flow during the mSDMT for PSimp group. c: Effective connectivity graph representing information flow during the mSDMT for PSintact group.

The PSintact group shared some connections with the HC group and also with the PSimp group (Figure 3c). In the PSintact group the right IPL influenced activation of the left SPL. Directionality of this connection was reversed in the HC group but stayed the same in the PSimp group. Additionally, the PCC →left IPL connection is missing in the PSintact group. The PCC is influencing activity in the right IPL.
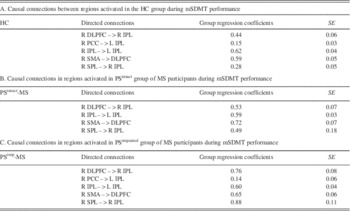
There were four common connections between the three groups: (1) DLPFC →right IL; (2) right IPL→ left IPL; (3) SMA→DLPFC; (4) SPL→right IPL. The ANCOVA revealed a group by connection strength interaction (F(6, 36)=2.85; p<.01; ƞ=0.14). PSimp group had stronger connections between the left SPL and right IPL (t(24)=6.06; p<.0001; d=2.41) and between the DLPFC and the right IPL (t(24)=3.16; p<.005; d=0.36) compared to the HC. Similarly, the DLPFC →right IPL connection was stronger in the PSimp group compared to the PSintact group (t(19)=2.08; p=.05; d=0.49). No significant differences between connection strengths were found between the HC and PSintact groups. See Table 4 for the list of connections.
List of causal connections

Discussion
The focus of the current study was to investigate how information is processed in individuals with MS who have PS deficits and those who do not. While it has been previously shown that cognitive deficits might be due to structural impairment (Bester et al., Reference Bester, Lazar, Petracca, Babb, Herbert, Grossman and Inglese2013; Genova, DeLuca, Chiaravalloti, & Wylie, Reference Genova, DeLuca, Chiaravalloti and Wylie2013; Papadopoulou et al., Reference Papadopoulou, Müller-Lenke, Naegelin, Kalt, Bendfeldt, Kuster and Penner2013), in the current study we specifically focused on examining network dynamics between MS individuals with PS deficit and those without PS deficit. Unlike previous studies, the current study is the first to separate the MS participants based on PS impairment and to use data-driven effective connectivity analysis to assess differences in causal relationships within the neural network associated with PS performance. After determining the neurotypical network of regions involved in PS during performance of the mSDMT, we applied effective connectivity analysis to examine causal relationships between the regions involved during mSDMT performance in HCs and MS participants with and without PS impairment. Results revealed that individuals with MS with PSimp have a connectivity pattern that differs from PSintact and HC groups and have a different strength of reliance on specific network connections. This might explain why some individuals with MS have PS deficits while others do not.
PS Network
To determine the network involved in mSDMT performance, we performed the GLM analysis that revealed activation in the fronto-parietal network, previously implicated in several cognitive processes, such as working memory, episodic memory and mental imagery (Luckmann, Jacobs, Sack, & Lu, Reference Luckmann, Jacobs, Sack and Lu2014). The overarching mechanism engaged during these processes appears to be of attention allocation or top-down attentional control (Bledowski, Kaiser, & Rahm, Reference Bledowski, Kaiser and Rahm2010; Larocque, Lewis-peacock, & Postle, Reference Larocque, Lewis-peacock and Postle2014; Luckmann et al., Reference Luckmann, Jacobs, Sack and Lu2014). Top-down attentional control is also likely to play a major role during PS task performance (Lee, Li, Liu, & Hsieh, Reference Lee, Li, Liu and Hsieh2011; Sheridan et al., Reference Sheridan, Fitzgerald, Adams, Nigg, Martel, Puttler and Zucker2006), explaining the engagement of the fronto-parietal network in the current task.
Effective Connectivity Differences
The effective connectivity analysis further revealed how regions of the fronto-parietal network interact during mSDMT performance. Specifically, the processing of information during task performance in PSimp group appears to be qualitatively different from HCs and the PSintact group and thus might be maladaptive. While in the HC group the right SMA influenced activation of the right DLPFC, this relationship was reversed in the PSimp group. These areas of the front-parietal network have been shown to be involved in information selection and manipulation and in directing the focus of attention during visuo-spatial tasks (Bledowski et al., Reference Bledowski, Kaiser and Rahm2010). The relationship between the left SPL that influenced activation of the right IPL in the HC group, is reversed in the PSimp group. These areas are also typically involved in voluntary orienting of attention (Shomstein, Reference Shomstein2012) and in interpretation of spatial information (Kravits, Saleem, Baker, & Mishkin, Reference Kravits, Saleem, Baker and Mishkin2012). Specifically, the SPL and IPL have been shown to be engaged in top-down orienting of attention and are a part of the dorsal attention stream that receives information from occipital regions (Kravits et al., Reference Kravits, Saleem, Baker and Mishkin2012). This reversed information flow (right DLPFC → right SMA, right IPL → left SPL) in the PSimp group suggests a disruption of top-down attentional control that might lead to poor performance on PS tasks.
The PSintact group shared connections with both the HC and the PSimp group. Specifically, while the DLPFC → SMA connection is the same in the PSintact group as in HC group, the direction of the connection between SPL and IPL is reversed in both the PSintact group and the PSimp group. In addition, the PCC, instead of influencing activation of the left IPL, is exerting influence on the right IPL. This effective connectivity pattern suggests that information processing in individuals with MS without PS deficits is similar to HC but might subsequently resemble the network dynamics of the PSimp group.
Connection Strengths
The effective connectivity analysis, in addition to providing qualitative information about the directionality of connections between the regions of the network, also provides regression coefficients that reflect the strength of individual connections. We did not observe significant differences in connection strengths between the HC and PSintact groups. However, the PSimp group had stronger connectivity coefficients compared to the HC group between the right DLPFC and right IPL and between the left SPL and right IPL. The directionality of the connection between the right DLPFC and right IPL is consistent across groups, while the left SPL → right IPL connection is reversed in the PSimp compared to the HC group. We speculate that the PSimp group, in addition to exhibiting a disruption of top-down attentional control, relies more on these connections compared to the other two groups. Over-reliance on these connections might contribute to a dysfunction of attentional control mechanisms.
Limitations
Although groups differed on the SDMT outside the scanner, there were no differences in RT in the mSDMT between MS groups (although both MS groups were significantly slower than HCs). This is likely due to the fact that the task was modified for scanner usage, making it easier to perform, thereby removing the differences between MS groups. In the future, it is important to develop a PS task in which there will be pronounced differences between groups, allowing us to further study this deficit.
One other limitation of the current study was that our groups were not adequately matched for age and gender. Although these variables were entered as covariates in analyses where significant correlations or differences between age or gender and a dependent variable were noted, this approach is not optimal (Miller & Chapman, Reference Miller and Chapman2001) and limits our ability to compare the differences across groups. Future studies on this topic with matched groups are clearly warranted.
Another potential limitation is that the cognitive deficit observed in the PSimp group might represent a global cognitive impairment rather than a focal PS deficit, driving the observed differences. This is evidenced by the fact that the PSimp group was impaired on the BVMT, a test that assess visual learning and memory, in addition to the SDMT. Examining the neural correlates of PS with a larger sample will help us disentangle PS deficits from other types of cognitive deficits.
The small sample size of the PSimp group compared to the other two groups is a potential limitation. However, in a previous investigation where effective connectivity was assessed, such subject size has been shown to be sufficient (Ramsey et al., Reference Ramsey, Hanson and Glymour2011). Furthermore, the effective connectivity method used here has been shown to produce stable results in small samples, achieving 95% accuracy in directing connections between the regions with just 1 subject (Smith et al., Reference Smith, Miller, Salimi-Khorshidi, Webster, Beckmann, Nichols and Woolrich2011).
Conclusion
Effective connectivity analysis was applied to advance understanding of neural processes associated with PS and its deficits. The present study represents an initial attempt at describing and explaining neural correlates associated with PS deficits in MS. Our findings suggest that there are differences in neural dynamics associated specifically with PS deficits. Future studies should further explore neural correlates associated with PS and potential causes of differences in connectivity patterns.
Acknowledgments
This work was partially supported by NMSS RG4232A1/1 to H.G. and 10-3216-BIR-E to G.W. The authors thank Angela Spirou for helpful comments on the manuscript and Olga Boukrina for help with conceptualization of the connectivity method. The authors declare no conflict of interest.