

Introduction
Immigrants and asylum seekers have become political focal points in numerous countries during the last decade. National debates about who and how many should be allowed to settle in various countries have revealed ideological disagreements among political elites. Usually, right-wing politicians oppose lenient immigration policies, whereas their left-wing opponents support them (Cole, Reference Cole2005; Sniderman and Hagendoorn, Reference Sniderman and Hagendoorn2007; Brader et al., Reference Brader, Nicholas and Suhay2008; Green-Pedersen and Krogstrup, Reference Green-Pedersen and Krogstrup2008).
However, it remains unsettled whether these issues have strengthened ideological divisions over immigration policy preferences among ordinary citizens. Indeed, in an extensive review of 100 immigration-related studies covering more than two dozen countries, Hainmueller and Hopkins (Reference Hainmueller and Daniel2014) concluded that the scholarly community has treated mass-level political ideology as a disposition of secondary interest. Despite its peripheral status, some studies do consistently report that rightists tend to be more opposed to immigration than leftists (e.g. Chandler and Tsai, Reference Chandler and Tsai2001; Scheepers et al., Reference Scheepers, Gijsberts and Coenders2002; McLaren, Reference McLaren2003; Semyonov et al., Reference Semyonov, Raijman and Gorodzeisky2006; Sides and Citrin, Reference Sides and Citrin2007; Wilkes et al., Reference Wilkes, Guppy and Farris2008; Rustenbach, Reference Rustenbach2010; Gorodzeisky, Reference Gorodzeisky2011; Davidov and Meuleman, Reference Davidov and Meuleman2012; Heizmann, Reference Heizmann2016). Yet most surprisingly for our purposes, no one has examined the extent to which – and in what way – mass-level ideological divisions over immigration policy preferences have strengthened over time. After all, greater strife and stronger ideological divisions in an important policy area are non-trivial issues.
Understandably, Hainmueller and Hopkins (2014) concluded that the impact of ideology on immigration policy preferences should be a central issue moving forward. Consistent with this appeal, we introduce a dynamic perspective in order to understand ideologically motivated mass-level reactions to immigration policies over time. Applying theories of motivated reasoning (e.g. Kunda, Reference Kunda1990), we claim that leftists and rightists are not challenged by greater ethnic diversity to the same extent. Rather, immigration and influxes of asylum seekers challenge rightists because they value conformity, tradition, and stability more than leftists. From this reasoning, we hypothesize that opposition to immigration will tend to increase among rightists over time, whereas leftists will show no such reaction.
Accordingly, we contribute to the understanding of public opinion formation in the immigration arena by showing that ideological divergence is increasingly associated with immigration policy preferences at the mass level. Unlike social psychologists’ strong focus on prejudice among the citizenry, we emphasize that reactions toward immigration and immigrants are not reducible to apolitical resentment. Rather, immigration also stimulates ideological dispositions including basic disagreements about the worth of social developments. More specifically, we advance knowledge on reactions toward immigration by examining our ideologically motivated reasoning hypothesis in a repeated cross-sectional (fixed effects regression) analysis of individual-level data from 18 countries. The individual-level data on political ideology and opposition to immigration is from the European Social Survey data sets fielded in 2002 and 2014. Thus, we exploit the fact that ethnic diversity and its politico-ideological correlates have become even more visible in daily life and public discourse during the period 2002–2014 (see also Bale et al., Reference Bale, Green-Pedersen, Krouwel, Luhter and Sitter2010; Helbling et al., Reference Helbling, Stolle and Reeskens2015).
Ideology as individual motivation and bias
Converse (Reference Converse1964) concluded that ordinary citizens are ideologically innocent, but decades of research has not confirmed this. Admittedly, no one would suggest that most citizens are sophisticated ideologues, but indicators of mass-level ideology certainly exist. First, most ordinary citizens are capable of reporting their ideological position when asked to do so in opinion surveys (Knutsen, Reference Knutsen1995, Reference Knutsen1998; Jost, Reference Jost2006). Second, previous research has shown that ideological self-placement relates to issue polarization and is by no means reducible to partisanship (Huber, Reference Huber1989). Along these lines, ideology appears to be a distinct political disposition with important consequences.
What is (personal) political ideology? According to traditional accounts, political ideology connotes beliefs and values that are acquired early in life because they are both genetically transmitted and formed through primary socialization (Alford et al., Reference Alford, Funk and Hibbing2005; Rico and Jennings, Reference Rico and Jennings2016). Beliefs are perceptions of the social world including assumptions about human nature, whereas values define what the world should look like (Jost et al., Reference Jost, Federico and Napier2009; Federico, Reference Federico2012). Both components suggest that ideology has an evaluative function, as social phenomena are considered good or bad according to pre-existing beliefs and values. More specifically, it is common to distinguish between left-wing and right-wing values, referring to opposed ideological positions (Hague et al., Reference Hague, Harrop and McCormick2013). A leftist values diversity, change, and social equality, whereas a rightist values conformity (or cultural unity) and stability and accepts inequalities (Jost et al., Reference Jost, Glaser, Kruglansk and Sulloway2003; Thorisdottir et al., Reference Thorisdottir, John, Liviatan and Shrout2007). In a study of closely related moral values, Haidt et al. (Reference Haidt, Graham and Joseph2009) found that self-reported right-wing orientation correlated negatively with care and fairness, and positively with obedience and loyalty to one’s group. In contrast, left-wing orientation correlates positively with empathy, openness, and fairness.
Our aim is not to identify the specific values and beliefs of political ideology. Based on previous research, we take for granted that a person who considers herself a leftist has greater acceptance of policies that are consistent with left-wing rather than right-wing values. Rather, our interest concerns the ability of political ideology to provoke distinctly different responses to social developments, because politically opinionated persons are highly motivated to form opinions (Federico, Reference Federico2012). Specifically, a leftist may see specific social changes (e.g. greater ethnic diversity) as valuable progress, whereas a rightist may consider them to be an indicator of cultural disintegration (see also Hibbing et al., Reference Hibbing, Smith and Alford2014). According to this perspective, ideology also has a cognitive function as it provides a heuristic with which social changes can be interpreted in terms of their causes and consequences (Jost et al., Reference Jost, Glaser, Kruglansk and Sulloway2003).
The distinction between the evaluative and cognitive features of ideology is analytical, because in real life they operate in tandem. This means that political reasoning is usually governed by ‘directional motives’. Kunda (Reference Kunda1990: 495) concludes that ‘people are more likely to arrive at those conclusions that they want to arrive at’ – and they rarely ask themselves whether their preferred conclusion is true (see also Jost et al., Reference Jost, Glaser, Kruglansk and Sulloway2003; Taber and Lodge, Reference Taber and Lodge2006; Leeper and Slothuus, Reference Leeper and Slothuus2014). Because accuracy motives are often less important, many are prepared to defend their beliefs and values, which in turn makes persuasion difficult and perceptions of information highly selective (Taber and Lodge, Reference Taber and Lodge2006; Iyengar and Barisione, Reference Iyengar and Barisione2015). To specify, a rightist who believes immigration is harmful will welcome empirical evidence that supports this conclusion and discount evidence to the contrary (Taber et al., Reference Taber, Lodge and Glathar2001). Similarly, a leftist who considers immigration harmless will tend to reject negative information about this phenomenon. In essence, because of instinctive defense mechanisms, ideology serves as a fixed predisposition that governs perceptions of reality (Jost et al., Reference Jost, Glaser, Kruglansk and Sulloway2003).
Deriving an hypothesis
However, Kunda (Reference Kunda1990) rightfully argues that the average citizen draws the desired conclusion only if she/he can provide sufficient evidence to support it. Such evidence may not be very difficult to provide in the immigration area. Enlargement of ethnic minority groups does inevitably bring about visible social and cultural changes. In democratic societies, immigration fosters more pluralism and less conformity as well as political debate about the need for greater acceptance of subcultures within the nation. Some may base their ideological reasoning on first-hand experiences (i.e. superficial contact in local communities), while others may rely on information about immigrants provided by the media or leading politicians. Together, this means that the evidence needed to support anti-immigration conclusions is readily available to the average citizen. However, rightists are likely to be more concerned about this type of information as they have much stronger preferences for stability, conformity and tradition (Jost et al., Reference Jost, Nosek and Gosling2008). In effect, because of their values, rightists are biased against out-group members, whereas leftists tend to be biased in favor of out-group members. Consistent with this line of reasoning, one would expect greater ethnic diversity and debates about multiculturalism to provoke stronger opposition to lenient immigration policies among rightists than among leftists. Leftists have fewer (if any) reasons for being fundamentally concerned or aroused because of immigration. Building on this rationale, we examine the following dynamic hypothesis:
The ideological divergence hypothesis: Opposition to immigration will tend to increase among rightists from 2002–2014, whereas leftists will show no such reaction.
Data, measures, and method
To examine the influence of political ideology on opposition to immigration, we have chosen two European Social Survey data sets from 2002 and 2014 that offer the key dependent and independent variables (including various controls) we need.Footnote 1 Applying repeated cross-sectional analysis makes it possible to compare the impact of political ideology on opposition to immigration at two different points in time across an evolving social and political context. Obviously, the European Social Survey provides a much stronger test of our hypothesis than a data set from a single country because of greater diversity in numerous respects. Our analysis includes more than 50,000 individuals from different cultures and institutional contexts; and these features unavoidably stack the odds against confirming our hypothesis.
This ESS data source is commonly regarded to be of high quality because of strict standards guiding the survey design and data collection process. The respondents were sampled from the residing population (aged 15 and older) in each country, with an average response rate of about 61% in 2002 and 53% in 2014. Further details concerning the sampling procedure and fieldwork can be found in ESS (2011, 2014). As our theory is confined to natives’ reactions toward immigrants, all self-reported non-native residents were excluded from the analysis.
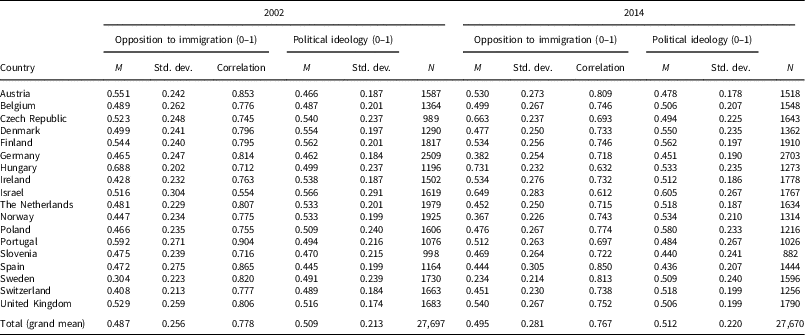
Inspired by previous research (Semyonov et al., Reference Semyonov, Raijman and Gorodzeisky2006; Sønderskov and Thomsen, Reference Sønderskov and Thomsen2015), we chose two items to measure the dependent variable (opposition to immigration). They address in-group members’ negative/positive reactions to receiving: (1) people of a different race or ethnic group from most of [country’s] people, and (2) people from the poorer countries outside Europe. Both items have four response categories ranging from ‘allow many’ to ‘allow none’. Responses to the two items were turned into an index by summating responses, and do not know responses were excluded. The index was acceptable as indicated by the (Pearson) correlation coefficient, ranging from 0.554–0.904 (in 2002) and 0.612–0.850 (in 2014) across countries; and equaling 0.778 for the pooled sample in 2002 and = 0.767 in 2014 (see Table 1). The index was subsequently rescaled to vary from 0 to 1, with higher values indicating greater opposition to immigration, as shown in Table 1. Table 1 also indicates how opposition to immigration varies considerably across the sampled countries. In 2002, opposition to immigration was lowest in Sweden, Switzerland, and Ireland, while it was highest in Hungary, Portugal, and Austria. In 2014, opposition to immigration was lowest in Sweden, Norway, and Germany, while it was highest in Hungary, Czech Republic, and Israel. It is also notable that while overall opposition to immigration increased lightly from 2002 to 2014, the increase is associated with just a few countries. The general picture is attitudinal stability across the entire 12-year period.
Descriptives of opposition to immigration, and political ideology, by country

Source: 2002 and 2014-European Social Survey (Rounds 1 and 7).
Note: M = mean; Std.Dev = standard deviation.
To measure our independent variable – political ideology – we used left-right self-placement with the following wording: ‘In politics people sometimes talk of “left” and “right”. Where would you place yourself?’ The raw measure varies from 0–10 (= right) but was subsequently rescaled to vary between 0 and 1, with higher values indicating a right-wing position (‘don’t know’ responses were excluded). Left–right self-placement is a composite and rough measure, but it has been utilized in public opinion research since the early 1960s (e.g. Federico, Reference Federico2012). Although ‘left’ and ‘right’ are highly symbolic labels, previous research has found a clear relationship between self-reported ideology and policy preferences: self-identified ‘rightists’ or ‘leftists’ hold policy preferences consistent with their ideological labels (Treier and Hillygus, Reference Treier and Hillygus2009). Most important for our purposes, numerous studies have found that self-reported rightists also tend to have more negative attitudes toward immigration and asylum seekers (Knutsen, Reference Knutsen1998; Scheepers et al., Reference Scheepers, Gijsberts and Coenders2002; Sides and Citrin, Reference Sides and Citrin2007; Wilkes et al., Reference Wilkes, Guppy and Farris2008). Furthermore, Table 1 indicates that the mass-level average of ideology falls rather close to the midpoint of the scale in all 18 samples. This suggests that the very meaning of the labels ‘left’ or ‘right’ changes little from one country to the next. Relatedly, the next column shows that the standard deviations around the means of ideology are not very far apart. In other words, the analyses do not include countries with extreme left-wing or right-wing political cultures. Finally, it is noteworthy that the grand means of political ideology are almost identical in 2002 and 2014, indicating that no general right-wing swing has occurred in the period under investigation.
As the objective is to examine variation over time, we created a time variable that serves as the key potential moderator of the association between political ideology and opposition to immigration. The time variable has two values – 2002 (which serves as the reference category) and 2014. Naturally, the time variable covers numerous changes, although most of them will be irrelevant for the relationship between political ideology and opposition to immigration. However, three are worth emphasizing. First, the number of immigrants and asylum seekers who settled in the included countries increased during the period 2002–2014 (United Nations, 2013). Second, many of these ‘foreigners’ are Muslims, who are regularly accused of not accepting the norms of liberal (secular) democracy (Citrin and Sides, Reference Citrin and Sides2008). Third, national debates about immigration, asylum seekers and multiculturalism have intensified because of greater party political involvement (Alonso and da Fonseca, Reference Alonso and da Fonseca2011; Akkerman, Reference Akkerman2015). We are unable to separate the social and party political aspects of the gradual transition to multiethnic and multicultural societies. Indeed, most frequently ‘objective’ realities about immigration and political rhetoric are inextricably linked together (see Bale et al., Reference Bale, Green-Pedersen, Krouwel, Luhter and Sitter2010). It is to a large extent political parties that inform the average citizen of the type of social issues about which they should be concerned (Hillygus and Shields, Reference Hillygus and Shields2008). In that manner, there is no simple one-to-one correspondence between the number of ‘foreigners’ in a country and mass-level reactions to immigration. Rather, the continual flow of information about immigration and asylum seekers presents symbols, which stimulate predispositional responses from the average citizen (see Sears et al, Reference Sears, Carl and Leslie1979).
Most importantly, we assume that these interrelated social and political aspects stimulate differential reactions across the ideological divide – they provoke stronger reactions among rightists. Finally, some may argue that the Financial Crisis (which peaked in 2007–2008) had a significant influence on the relationship between political ideology and opposition to immigration. Yet the politics as well as the economic consequences of the Financial Crisis had very little to do with immigrants and refugees. Rather, bankers and financial institutions were the central objects of public attention. In sum, greater ethnic diversity and its political correlates are most likely to explain why ideological divergence may have increased from 2002 to 2014.
At the individual level, we included standard controls that might relate to both political ideology and opposition to immigration: (1) gender, (2) age (in years), (3) education (in years), (4) economic satisfaction, (5) labor market status,Footnote 2 (6) social trust,Footnote 3 (7) residential area, and (8) intergroup contact.Footnote 4 Note that many of these individual-level controls ensure that ideological responses are unlikely to be driven by differences in personal economic vulnerability. Moreover, intergroup contact as a control appears particularly relevant in view of the most recent research on the relationship between intergroup contact and political ideology. Homola and Tavits (Reference Homola and Tavits2017) as well as Thomsen and Rafiqi (Reference Thomsen and Rafiqi2018) showed that the impact of intergroup contact is much weaker among rightists than leftists. Intergroup contact seems to relate to both political ideology and reactions toward immigrants.
The empirical analyses include no controls at the national level as we apply a fixed-effects regression analysis specification. This choice of statistical modeling reflects the fact that the specified hypothesis relates exclusively to individual-level dispositions, which makes it all the more urgent to ensure that macro-level variables have no influence on the estimated individual-level relationships. The fixed-effects regression specification explicitly deals with omitted variable bias (Hox, Reference Hox2010). In our case, this means that macro-level confounders are eliminated by controlling for country dummies, thus leaving controlled estimates at the individual level. In other words, the country dummies explain all of the country-level variation, implying that there is no variation left to be explained by additional country-level variables (Allison, Reference Allison2009). Finally, the statistical models include the time variable in order to control for between-time-point effects (i.e. changes over time among nations).Footnote 5
Results
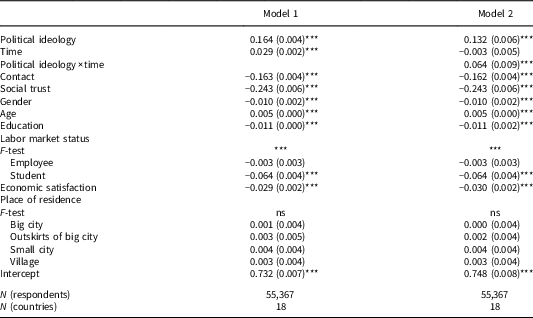
Table 2 tests the hypothesis by showing two models: Model 1 assumes that the impact of political ideology on opposition to immigration is additive, whereas Model 2 is a linear-interactive model. Model 1 shows that the impact of political ideology on opposition to immigration is statistically significant and non-trivial in substantive terms. When shifting from extreme left to extreme right, opposition to immigration increases by about 16 percentage points. Model 1 also shows that opposition to immigration increases over time, by about three percentage points from 2002 to 2014. More importantly, in Model 2 political ideology has been specified mathematically as a function of the time variable in order to establish a linear-interactive model (Kam and Franzese, Reference Kam and Franzese2007). Put in more substantive terms, Model 2 shows that political ideology is clearly conditioned by the time variable as the interactive coefficient is statistically distinguishable from zero. The effect of political ideology is 0.132 in 2002 (i.e. when the time variable is zero). Yet the effect of political ideology is enhanced when the time variable shifts from 2002 to 2014, as the interaction coefficient is positive in sign. More specifically, the marginal effect of political ideology increases from 0.132 in 2004 to (0.132 + 0.064) 0.196 in 2014. That is, the effect of political ideology increases by about six percentage points when the interactive variable increases by one unit (i.e. from 2002 to 2014). Certainly, the impact of political ideology on opposition to immigration is non-uniform across the period 2002–2014.
The impact of political ideology on opposition to immigration across time

Note: Cell entries show unstandardized coefficients with standard errors in parentheses (fixed-effects model).
Reference categories: time = 2002; gender = male; labor market status = temporarily or permanently outside the labor market; economic satisfaction = not satisfied; place of residence = countryside.
The F-test is based on the overall statistical significance of the specific variable.
*** P <0.001; **P <0.01; *P <0.05 (two-tailed t-test).
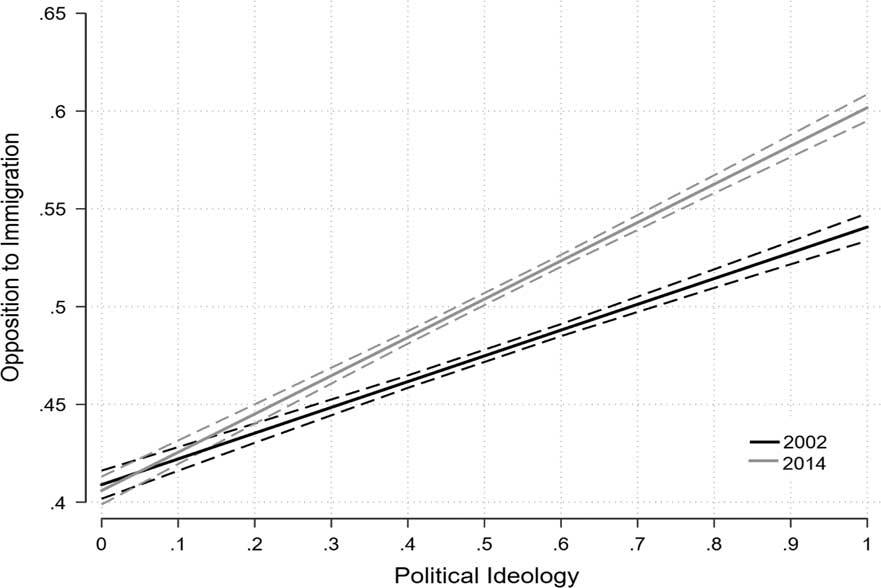
Model 2 cannot establish whether the ideological enhancement effect is a case of ideological polarization or divergence. Is it leftists or rightists (or both) that drive the interactive effect? To answer this critical question, Figure 1 shows the predicted relationship between political ideology and opposition to immigration for each of the two observation points. More specifically, Figure 1 shows how the level of opposition to immigration changes (i.e. ŷ for the dependent variable) as political ideology changes, at both levels of the time variable. Thus, we can directly observe the predicted opposition to immigration across the range of values of political ideology. Note that 0 on the x-axis corresponds to extreme left, whereas 1 corresponds to extreme right. More substantially, in both 2002 and 2014 rightists were considerably more opposed to immigration than leftists, as both the solid black line and the solid grey line have positive slopes. Put differently, opposition to immigration is clearly associated with ideological divisions and principled disagreements at both ends of the lengthy period of time. From the estimates of Table 2, Model 2, we also know that the slopes of both straight lines are statistically distinguishable from zero. Still, it is equally clear that leftists seem to hold similar positions in both 2002 and 2014, as the 95% confidence intervals are overlapping at the lower end of the x-axis indicating the values of political ideology.Footnote 6 In contrast, rightists generally became more opposed to immigration from 2002 to 2014. Thus, Figure 1 shows that over time, rightists increasingly diverged from leftists as regards opposition to immigration.
The predicted relationship between political ideology and opposition to immigration in 2002 and 2014.
Note: This figure shows the effect of a shift in political ideology from its minimum to its maximum on opposition to immigration, conditional on two time points (2002 and 2014). This figure is based on the estimates presented in Table 2, Model 2. Controls were kept at their observed values. The dotted lines indicate 95% confidence intervals.
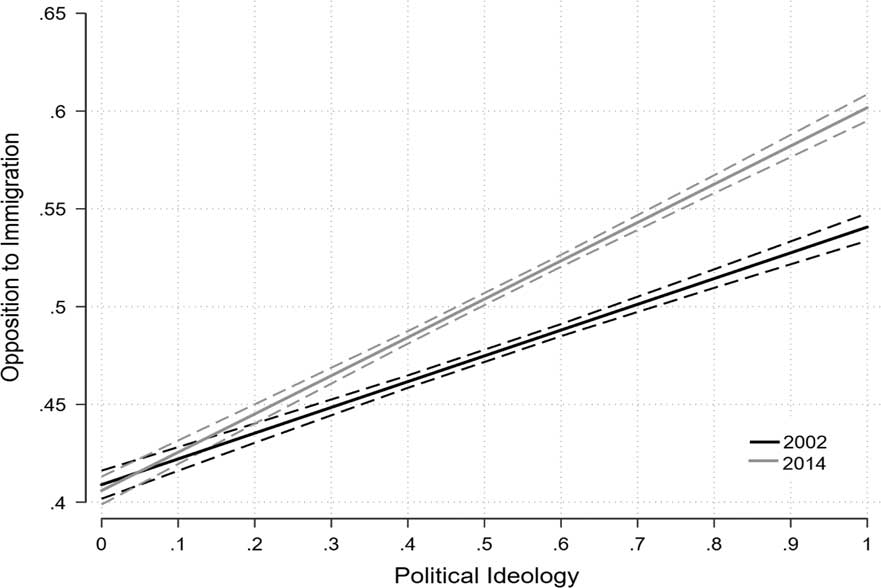
Some may argue that the linear prediction shown in Figure 1 is disproportionately sensitive to extreme observations at the higher end of the political ideology measure. Is the moderation effect in Figure 1 driven by extreme observations? To examine this question, we recoded the political ideology measure into four categories according to the (25th, 50th, 75th, and 100th) percentiles and reran the analysis shown in Figure 1. This analysis confirmed that leftists did not change their immigration policy position from 2002 to 2014, and it also confirmed that the greatest change in terms of opposition to immigration occurred among rightists. Yet the percentile-based analysis also indicated – as in Figure 1 – that opposition to immigration increased slightly among the more ‘neutral’ ideological category (i.e. the 25th and 50th percentiles). Apparently, skepticism toward immigration has a broader appeal than one would expect from traditional theories of political ideology. We are unable to fully account for this broader appeal effect, but a possible answer might relate to the mix of ideological values and beliefs among the so-called ‘neutral’ category. In fact, the ‘neutral’ label may be somewhat misleading. Respondents who scatter around the midpoint of the political ideology measure most probably accept some left-wing and some right-wing values and beliefs. The average ideologically ‘mixed’ person most likely values stability, tradition and conformity to some extent, especially during periods where debates about the number of immigrants and asylum seekers intensify considerably. In sum, Figure 1 and additional analysis clearly support the ideological divergence hypothesis.
Subsequently, we performed some important robustness checks. First, we reran the analysis by excluding one country at a time in order to identify important country-outliers. The interaction term varied between 0.051 (P <0.001) when excluding Israel and 0.074 (P <0.001) when excluding the Czech Republic. Second, as emphasized by Citrin and Sides (Reference Citrin and Sides2008), left-right self-identification may not have the same meaning and policy implications among the four former communist countries (Czech Republic, Hungary, Poland, and Slovenia). Accordingly, we reran the analysis only among these four countries, obtaining an interaction coefficient = 0.063 (P <0.001).Footnote 7 In combination, these additional robustness checks certainly indicate that the main conclusion is most likely not influenced by particular country-outliers.
As a final robustness check, we included prejudice as an additional control in order to establish an extremely conservative test of the relationship between political ideology and opposition to immigration. Were the impact of political ideology on opposition to immigration entirely reducible to prejudice, this would not support our motivated reasoning hypothesis. The data sets from 2002 and 2014 offer two identical items that tap social distance, which is commonly regarded as an acceptable proxy for ethnic prejudice. The first item concerns acceptance of an ethnic out-group member as one’s boss. The second item concerns acceptance of an ethnic out-group member marrying a close relative. Both items were summated into a single scale ranging from 0 to 1, with higher values indicating greater prejudice toward ethnic out-group members. We reran Model 2 with this additional control. The effect of ideology = 0.079 (P <0.001) and the interactive relationship (political ideology × time) = 0.067 (P <0.001). Thus, the interaction coefficients are almost identical (0.064 compared to 0.067), whereas the effect of ideology is slightly reduced in 2002. In other words, prejudice only offers a partial explanation of why rightists are more opposed to immigration than leftists (thus assuming that prejudice operates as a mediator). Most importantly, prejudice does not explain why the impact of ideology is larger in 2014 than in 2002. In sum, the impact of political ideology remains irreducible to prejudice.
Conclusion and discussion
In a comprehensive analysis of 18 nations and 55,367 individuals, the present investigation showed that political ideology influences reactions to immigration. Generally, rightists tend to oppose immigration, whereas leftists tend to be less opposed. Even more, over time only rightists have become more opposed to immigration. In terms of important contributions to an understanding of the challenges of contemporary politics, this finding suggests that immigration and flows of refugees tend to bring more conflict over specific policy issues into liberal democracies. This in turn may also to some extent account for why radical right parties and right-wing populist projects have gained electoral strength during the last couple of decades – most recently symbolized by the Trump phenomenon in the United States (also Zhirkov, Reference Zhirkov2014). Immigration and its political (symbolic) correlates are most likely the real drivers behind the observed ideological divergence effect.
The main finding also has significant theoretical implications for related, existing research. For too long, scholars have ignored the role of ideologically motivated influences in the immigration area. Hainmueller and Hopkins (2014) rightly emphasized that this neglect of political and ideological features tends to overstate the distinctiveness of mass-level reactions to immigration and its consequences. Ultimately, immigration attitudes may appear to be almost entirely apolitical responses shaped by socio-economic status indicators. However, our results suggest that reactions to (non-Western) immigration and asylum seekers cannot be reduced to prejudice, racism or tragic misunderstandings of cultural differences. Although our study does not offer this specific information, other studies suggest that mass-level reactions to immigration tend to relate to bigger issues such as national cohesion, national boundaries, cultural legacies, social justice, or preferential treatment initiatives (see McLaren and Johnson, Reference McLaren and Johnson2007; Sniderman and Hagendoorn, Reference Sniderman and Hagendoorn2007). These bigger issues are likely to provoke principled and ideological disagreements among the mass citizenry. Moreover, consistent with our call for a more politics-centered approach to the immigration area, recent studies have revealed that even processes of intergroup contact between majority and ethnic minority members cannot be treated as apolitical. Homola and Tavits (Reference Homola and Tavits2017) showed that intergroup contact does not have positive outcomes among right-wing supporters, and Thomsen and Rafiqi (Reference Thomsen and Rafiqi2018) concluded that political ideology has a similar constraining effect. Both studies also demonstrate the relevance of the motivated reasoning paradigm in the immigration area. Although our analyses were performed on 18 different countries, a key issue might still concern the extent to which the results generalize to an even broader category of countries. Although similar studies are very rare, some do relate to our results. For example, in an American experiment Lahav and Courtemanche (Reference Lahav and Courtemanche2012) found that self-identified liberals (‘leftists’) generally supported lenient immigration policies when immigration was framed as a threat to cultural identity. In contrast, conservatives supported more restrictive policies regardless of the nature of the threat. This result is consistent with ours and it suggests that ideological reactions involve psychological mechanisms of a more universal nature.
All studies have limitations, including ours. The claim that the enhanced impact of political ideology on opposition to immigration from 2002 to 2014 relates to greater ethnic diversity and its political, symbolic dynamics remains a suggestion. Additional countries, variables and data points are needed to draw conclusions that are more precise. Clearly, political parties are important informants about the actual and potential consequences of immigration, and so are the media (also Gianfreda, Reference Gianfreda2017; Urso, Reference Urso2018). In this manner, these key actors make immigration issues salient at the mass level. Nonetheless, the most recent research suggests that the influence of political parties on mass-level immigration attitudes should not be exaggerated. For example, Bohman and Hjerm (Reference Bohman and Hjerm2016) found that radical right parties had no direct influence on immigration attitudes. If political parties primarily stimulate issue salience and the policy implications of prior mass-level dispositions, this may imply that our analysis underestimates the impact of political ideology on opposition to immigration in some countries and overestimates it in others. To support this suggestion, Jensen and Thomsen (Reference Jensen and Thomsen2011) examined the impact of political ideology on opposition to immigration in Denmark and Sweden. In Denmark, the immigration issue has been high on the party political agenda for many years, whereas in Sweden it was almost ignored until recently (also Dahlstrøm and Esaiasson, Reference Dahlstrøm and Esaiasson2011). Most notably, the impact of mass-level political ideology on opposition to immigration was much stronger in Denmark; however, and equally important, political ideology also had a non-trivial and statistically significant impact in the Swedish case. This finding supports the conception of political parties as catalysts for issue salience among the public.
Our results have broader implications for research on ideology in the immigration arena. At the general level, the results support the theory of motivated reasoning, according to which politically opinionated persons react according to their prior beliefs and values. Indeed, strong universal claims about the ‘end of ideology’ or mass-level ideological innocence found no support in our analyses. Obviously, the results also warn against strong claims about evolutionarily induced negativity bias. People worry most about negative information, but these concerns do not necessarily provoke similar reactions toward a given ‘object’. Related to our results, it is a distinct possibility that leftists defend immigrants and asylum seekers despite their awareness of the costs involved – as a principle, they refuse to see ‘foreigners’ as a burden. Alternatively, leftists may simply disagree with rightists about the ‘real’ costs of immigration, or they might see some immediate costs as long-term benefits. More research along experimental lines is needed in order to detect the precise motives and differential types of reasoning among leftists and rightists. Until then, it seems that immigration and the political dynamics related to it have intensified ideological conflict among majority populations.
Acknowledgement
We thank the reviewers for useful comments.
Financial support
This research received no grants from public, commercial, or non-profit funding agencies.
Data
The replication data set is available at http:/thedata.harvard.edu/dvn/dv/ipsr-risp