


Introduction
Tribolium castaneum (Herbst) (Coleoptera: Tenebrionidae) is a cosmopolitan stored product pest causing serious infestations in raw stored grain, cereal processing facilities, warehouses, retail stores and home pantries. This species can breed at temperatures between 22 and 40°C and can complete a generation in as little as 20 days (Rees, Reference Rees2004). Tribolium castaneum may attack materials of animal and plant origin, including seed born fungi (Sinha, Reference Sinha1966), and is the major pest in wheat processing mills. Adults are highly mobile and can complete development in small food patches (Campbell & Hagstrum, Reference Campbell and Hagstrum2002; Campbell & Runnion, Reference Campbell and Runnion2003). The species is economically important because infested products may contain insect fragments, benzoquinones and cast skins, in addition to individuals of each life stage (Baur, Reference Baur and Baur1984).
Application of a residual insecticide, compounds that leave a persistent residue that is toxic to insects upon contact, is part of an integrated pest management strategy for T. castaneum in food processing facilities. A typical labeled application method would be to spray surfaces, spots or cracks and crevices to the point of runoff with a pyrethroid insecticide. For example, excellent mortality to T. castaneum as a result of cyfluthrin exposure on steel, concrete and painted surfaces has been thoroughly documented under laboratory conditions (Arthur, Reference Arthur1994a,Reference Arthurb, Reference Arthur1998, Reference Arthur1999a,Reference Arthurb, Reference Arthur2000). Previous studies have attributed population suppression in grain processing and retail establishments to cyfluthrin use (Roesli et al., Reference Roesli, Subramanyam, Campbell, Kemp, Credland, Armitage, Bell, Cogan and Highley2003a; Toews et al., Reference Toews, Campbell and Arthur2006a). Barrier treatments, consisting of a narrow band of cyfluthrin around a protected area, have been previously used to suppress trap captures of structure-infesting ants such as Iridomyrmex humilis (Mayr) (Hymenoptera: Formicidae) (Rust et al., Reference Rust, Haagsma and Reierson1996; Scharf et al., Reference Scharf, Ratliff and Bennett2004). Barrier treatments to protect stored foodstuffs or commodities from stored product insects have not been previously tested.
Trapping with pheromone-baited traps is the preferred method for T. castaneum detection in food and feed processing facilities. Direct product sampling in these facilities would be exceedingly difficult because value-added products like pasta, cereal, wheat flour, wheat gluten and pet foods are too valuable to discard damaged packages after sampling and large quantities of product are being rapidly moved through these facilities. In addition, a large proportion of the population may occur within the structure of the building where they are not accessible. As a result, the sources of insect infestation in a facility are generally not fully known. Trap capture data are commonly used to document species composition, spatial distributions, temporal population dynamics, emigration and immigration, and pesticide efficacy (Arbogast et al., Reference Arbogast, Kendra, Mankin and McGovern2000, Reference Arbogast, Kendra, Mankin and McDonald2002; Campbell et al., Reference Campbell, Mullen and Dowdy2002; Roesli et al., Reference Roesli, Subramanyam, Campbell and Kemp2003b; Campbell & Arbogast, Reference Campbell and Arbogast2004; Toews et al., Reference Toews, Campbell and Arthur2006a; Trematerra et al., Reference Trematerra, Gentile, Brunetti, Collins and Chambers2007). Larger datasets have been used to develop and validate sampling plans for use in grain storages, retail stores and factories (Subramanyam & Harein, Reference Subramanyam and Harein1990; Subramanyam et al., Reference Subramanyam, Hagstrum, Meagher, Burkness, Hutchinson and Naranjo1997; Athanassiou & Buchelos, Reference Athanassiou and Buchelos2001; Toews et al., Reference Toews, Subramanyam, Roesli, Credland, Armitage, Bell, Cogan and Highley2002; Carvalho et al., Reference Carvalho, Passos de Carvalho, Torres and Mexia2006).
This project was conducted as part of a comprehensive study of pest management and monitoring in grain processing and warehousing environments. The authors are proponents of trap-based monitoring approaches in commercial facilities but are aware that interpretation of these data can be difficult. Studies here were conducted in sealed pilot-scale warehouses, which allowed full access to the food patches and control of environmental conditions and initial population density. In a similar pilot-scale study on insecticide application methods, the authors presented data showing that insect captures in traps did not follow the same trends as direct samples in warehouses treated with cyfluthrin (Toews et al., Reference Toews, Campbell, Arthur and West2005b). However, that was a short term (six-week) study with limited food resources, and it was unclear if those findings could be extrapolated when multiple insect generations could develop. The objectives of this 15-week study were: (i) to evaluate the impact of the cyfluthrin treatment on T. castaneum populations; (ii) to compare relationships among trends suggested by insect captures in pheromone-baited traps, direct estimates from food patches and dead insects collected from the floor; and (iii) to determine if uninfested food patches could be protected from T. castaneum by surrounding the food with a residual cyfluthrin application.
Materials and methods
Insect cultures
A four-year-old laboratory culture of T. castaneum was used to establish infestations in each warehouse. The original colony was established from ~100 immatures collected in an operating flour mill. The culture was maintained in the laboratory at 27.0±0.5°C and 65±5% RH in 0.94-liter glass jars filled with 300 g of wheat flour fortified with 5% (by weight) brewer's yeast (ICN Biomedicals, Aurora, OH, USA). Rearing density was ~100 adults per 300 g of flour.
Pilot-scale warehouses
The study was conducted in five climate-controlled pilot-scale warehouses described by Toews et al. (Reference Toews, Arthur and Campbell2005a). Briefly, tightly sealed and insulated warehouses were framed with wood, interior surfaces were lined with plywood, exterior surfaces were sided and roofs were covered with asphalt shingles. Three warehouses measured 2.8 m wide by 5.9 m long by 2 m tall, while the two remaining warehouses measured 2.8 m wide by 5.9 m long by 2.4 m tall. Each was prepared following methods described in Toews et al. (Reference Toews, Campbell, Arthur and West2005b). In brief, a contiguous piece of 0.15-mm-thick polyethylene sheeting covered the entire floor and four walls to a height of 1.5 m from the ground. Sheeting was anchored in place with 9.5 mm long staples, and then the edges were sealed to the warehouse walls with grey duct tape to prevent insect immigration between the sheeting and the permanent warehouse walls. The floor surface was then completely covered with 1.3-cm-thick gypsum panels (USG SHEETROCK brand, USG Interiors, Inc., Chicago, IL, USA). Joints between panels were covered with joint tape and three successive layers of joint compound. To prevent insect dispersal under the gypsum panels, a linear bead of acrylic latex caulk was applied between the inside walls of the warehouse and the periphery of the gypsum panels. After lightly sanding the joint compound, the new floor surface was painted with PVA drywall primer (part no. 73, Behr Process Corp., Santa Ana, CA, USA) and finished with acrylic concrete floor sealer (part no. 900, Behr Process Corp) to simulate a finished concrete floor. These procedures assured that future research could be conducted without being contaminated from the present use of residual insecticides; insects would not be able to leave the visible study area, and the working surface was relevant to that found in a commercial mill or warehouse.
Temperature was controlled using a wall-mounted heating/cooling unit to reflect conditions found in operating warehouses. Mean weekly temperatures, measured at floor level with miniature data loggers (Onset Computers, Pocasset, MA, USA), were maintained between 25 and 27°C (n=40) to allow several generations to develop while being cool enough to reduce flight during the studies. Humidity was not controlled, but mean weekly values ranged from 45 to 55% RH (n=40). Two ceiling-mounted 100-watt incandescent light bulbs illuminated each warehouse throughout the study because most commercial warehouses operate continuously. These bulbs provided 42.0±2.6 lux (n=20) at ground level.
Pilot-scale shelves
Each warehouse was provisioned with three custom-made shelving units to provide insect refugia (Toews et al., Reference Toews, Arthur and Campbell2005a). Shelving units, measuring 53 cm wide by 119 cm long by 12 cm tall, were designed to simulate wooden pallets and provide shelter to conceal food patches. Each shelf was constructed with a closed steel frame that supported a sheet metal shelf. Shelves were designed to be easily lifted to permit access to the sheltered food patches during sampling. Immediately after acquiring flour samples, the shelves were returned to their original horizontal position covering the food patches.
Experimental protocol
Pilot-scale warehouses were prepared by applying insecticide, infesting and installing pheromone-baited traps. Pilot-scale shelving units were positioned in each warehouse (fig. 1), and a permanent marker was used to outline the position of each shelf on the floor. A 46-cm sanitation buffer, a common practice in food storage warehouses, permitted movement between the shelves and the inside walls of each warehouse. A sanitation buffer is simply an open space between pallets or packages and the outside wall. Two warehouses were randomly assigned control (water treated) status while the remaining three warehouses were designated to receive the residual insecticide application. Technicians wore disposable polyethylene overboots that were replaced between warehouses, to prevent residue movement between the control and insecticide-treated warehouses. After removing the shelves to avoid contamination, β-cyfluthrin (Tempo® Ultra WP, Bayer Corp., Kansas City, MO, USA) was applied in a 25-cm band around the outline of each shelf in the treatment-designated pilot-scale warehouses while distilled water was similarly applied in the control-designated warehouses. Separate hand-held sprayers, fitted with hollow cone nozzles, were used to deliver the insecticide or distilled water at a pressure of 137.9 kPa. Sprayers were weighed before and after applications in each warehouse to determine the amount of material applied. Cyfluthrin was mixed with distilled water immediately before use at the highest labeled rate (0.05%) and applied at a dose of ~3.79-l finished solution per 92.9 m2. In the three cyfluthrin replications, 188.1±8.2 ml of finished solution per warehouse was applied. In the two control replications, 187.1±8.2 ml of distilled water per warehouse was applied.
Arrangement of shelves, traps and food patches in pilot-scale warehouses. The arrow indicates the position of exterior door, gray rectangles indicate shelves, black circles indicate pitfall traps, and white circles indicate foot patches (situated under shelves). Drawing is not to scale.
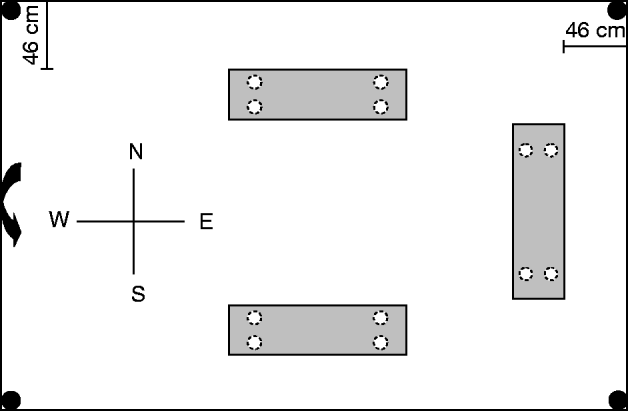
Twenty-four hours after insecticide application, warehouses were provisioned with clean food patches comprising of flour and infested with T. castaneum. Shelving units were returned into warehouses and four food patches (50 g each), previously frozen to eliminate any potential initial infestation, were situated on 125 mm filter papers under each shelf. Under the north shelf only, 42 unsexed individuals at each of the following life stages: eggs, two-week-old larvae, three-week-old larvae, pupae and two-week-old adults were released on top of each of the four food patches for a total of 210 individuals by life stage per warehouse. No insects were released under the south and east shelves to test the hypotheses that the residual cyfluthrin bands would protect those uninfested food patches. Insects were allowed to disperse for 24 h before a pitfall trap (Dome trap, Trécé Inc., Adair, OK, USA), baited with T. castaneum pheromone (CFB/RFB pheromone attractant, Trécé Inc.) and food oil, was positioned in each corner of each warehouse (fig. 1). Oil was added to each trap until the bottom of the trap was covered (~15 drops). Pheromone lures and food oil were replaced every six weeks during the study.
A comprehensive monitoring program was initiated seven days after trap placement and continued weekly for 15 weeks (June–October, 2005). First, all dead adults were removed by sweeping the dead insects from the light grey colored floor onto a piece of white paper using a 5-cm-wide paint brush; collected individuals were counted and then discarded. Second, larvae and adults captured in the pitfall traps during that interval were enumerated and removed. Finally, direct samples from each flour patch were obtained by collecting 2.5(±0.2) g samples of flour from each food patch with a metal laboratory spatula. Separate paint brushes and spatulas were used inside control and cyfluthrin-treated warehouses to avoid cross contamination. Food patch samples were pooled by shelf and stored in plastic vials. Each food patch was replenished with 2.5 g of new flour immediately after sampling to prevent limiting food resources. Newly acquired samples were immediately weighed and sieved on a #60 U.S. standard testing sieve to determine the number of larvae, pupae and adults in each sample.
Experimental design and analyses
Experimental treatments were designed as a completely randomized design with repeated measures. Response variables, including the number of dead adults per warehouse, mean larvae and adults captured in pitfall traps, and mean larvae, pupae and adults recovered in flour samples, were analyzed for insecticide treatment and sampling date effects using PROC MIXED (SAS Institute, 2003). The first-order autoregressive covariance structure was selected to model the intra-sample correlation (Littell et al., Reference Littell, Stroup and Freund2002). The repeated measures subject was specified as warehouse within treatment, and treatment was specified as a repeated measures group effect. To normalize variances, a log transformation X'=log10 (X+1) was performed on counts of dead adults, and counts of larvae and adults captured in pitfall traps (Zar, Reference Zar1984). However, actual means and standard error were presented in all figures. All response variables were presented in the figures by interaction because one of the objectives was to compare trends suggested by traps with counts from food patches. If the interaction test was not significant (α=0.1 for interactions), independent tests and means separation (LSMEANS) were conducted for differences between insecticide treatments and among treatment dates (α=0.05). The slice option of the LSMEANS statement was used to investigate differences between insecticide treatments while controlling the effect of date when there was evidence of interactions.
Several correlation parameters were also examined to better understand relationships among variables by sampling week and insecticide treatment. Separate correlation coefficients were calculated between mean adults captured in traps and mean adults recovered in food patches under all shelves, and between mean adults recovered under all shelves and mean number of dead adults per pilot-scale warehouse. Additionally, the potential correlation between mean adult captures in pheromone traps in the untreated replications and mean number of dead adults recovered on the floor of the cyfluthrin-treated warehouses was examined to determine how these statistics may be related. Correlation coefficients (r) were calculated using PROC CORR (SAS Institute, 2003) while the correlation coefficient standard errors (s r) were calculated using the procedures described by Zar (Reference Zar1984).
Results
There were obvious treatment differences observed for dead adults and insects captured in the pitfall traps. A significant insecticide treatment by sampling date interaction (F14, 42=2.19, P=0.03) was detected in the analyses of dead adults recovered on the pilot-scale warehouse floors (fig. 2). The static plot of dead insects in the control treatment contrasted with the fluctuating number of dead insects in the cyfluthrin-treated warehouses. These differences peaked on 25 August, when there were >fivefold more dead insects in the cyfluthrin-treated warehouses than the control replications. Dead insects were observed throughout the pilot-scale warehouses, but the majority was distributed within one meter of the insecticide bands. Many more adults than larvae were captured in the pitfall traps. With regard to larvae in traps, the insecticide treatment by sampling date interaction was not significant (F14, 42=1.6, P=0.11), but the tests for differences between insecticide treatments (F1, 3=2.4, P=0.04) and among sampling dates (F14, 42=3.7, P<0.01) were significant (fig. 3a–b). A significant insecticide treatment by sampling date interaction was detected for analyses of adults captured in pitfall traps (F14, 42=3.0, P<0.01). On 25 August, there were >18-fold more adults captured in pitfall traps in the control treatments than the cyfluthrin-treated warehouses.
Mean±SEM dead adults recovered weekly on the floor inside pilot-scale warehouses. Asterisks (*) indicate significant differences between the control and cyfluthrin treatments by date (protected lsmeans test, P<0.05) (–•–, control; –○–, cyfluthrin).

Mean±SEM of (a) larvae and (b) adults captured weekly in pitfall traps. Asterisks (*) indicate significant differences between the control and cyfluthrin treatments by date (protected lsmeans test, P<0.05) (–•–, control; –○–, cyfluthrin).

Analyses of mean larvae, pupae and adults obtained by directly sampling all food patches (includes both initially infested and initially uninfested patches) show that there were no insecticide treatment by sampling date interactions for larvae (F14, 42=1.1, P=0.41), pupae (F14, 42=0.7, P=0.76) or adults (F14, 42=0.7, P=0.75). While the tests for differences among treatments were not significant for larvae (F1, 3=1.4, P=0.32) and pupae (F1, 3=2.2, P=0.23), a significant difference was detected in the case of adults (F1, 3=20.3, P=0.02). There were differences among sampling dates for all three life stages including larvae (F14, 42=5.0, P<0.01), pupae (F14, 42=3.3, P<0.01) and adults (F14, 42=6.8, P<0.01). Plots of larvae and pupae demonstrated cyclical growth curves, but adults showed steady increases after an initial five-week period of little change (fig. 4a–c). Incremental increases in pupae generally lagged behind increases in larvae by one to two weeks.
Mean±SEM of (a) larvae, (b) pupae and (c) adults, per gram flour recovered in food patches per pilot-scale warehouse (includes north, south and east shelves) (–•–, control; –○–, cyfluthrin).

Data show that no differences between treatments occurred in the number of individuals recovered via direct sampling of the north shelves only (initially infested) (fig. 5a–c). There were no two-way interactions for larvae (F14, 42=0.5, P=0.95), pupae (F14, 42=1.6, P=0.12) or adults (F14, 42=1.3, P=0.23). Similarly, there were no differences between the insecticide treatments for larvae (F1, 3=0.1, P=0.84), pupae (F1, 3=0.1, P=0.81) or adults (F1, 3=1.0, P=0.38). However, there were differences among sampling dates for each of the three response variables, including larvae (F14, 42=6.4, P<0.01), pupae (F14, 42=5.5, P<0.01) and adults (F14, 42=4.5, P<0.01). An initial peak in larvae occurred five weeks into the study, which was followed by a similar peak in pupae two weeks later. The adult population did not peak for three weeks after the peak in pupae. Maximum observed larval density was approximately 6–7 larvae per gram of flour while adults never exceeded 1.5 adults per gram of flour.
Mean±SEM of (a) larvae, (b) pupae and (c) adults, per gram flour recovered in food patches under the north shelves only (initially infested) (–•–, control; –○–, cyfluthrin).

Analyses of individuals recovered via direct sampling of the south and east shelves only (initially uninfested) show that cyfluthrin treatments suppressed insect infestation by larvae for six weeks. After this time period, the population of larvae was not different regardless of treatment (fig. 6a–c). Although there was a significant interaction between insecticide treatment and sampling date for larvae (F14, 42=1.7, P=0.09), this statistic was not significant for pupae (F14, 42=1.6, P=0.12) or adults (F14, 42=1.0, P=0.46). Overall tests for differences between the control and cyfluthrin treatment were non significant for pupae (F1, 3=4.78, P=0.11) but were significant for adults (F1, 3=35.5, P<0.01). Obvious differences among sampling dates were detected for pupae (F14, 42=3.6, P<0.01) and adults (F14, 42=8.8, P<0.01). The overall trend for larvae in untreated replications mirrored that of the initially infested food patches. A density of slightly more than five larvae and 1.5 adults per gram of flour was the maximum observed insect density during the study. Given the level of infestation in these initially uninfested food patches, it is obvious that emigration from the initially infested patches was occurring.
Mean±SEM of (a) larvae, (b) pupae and (c) adults, per gram flour recovered in food patches under the south and east shelves only (initially uninfested). Asterisks (*) indicate significant differences between the control and cyfluthrin treatments by date (protected lsmeans test, P<0.05) (–•–, control; –○–, cyfluthrin).

A significant correlation was observed between adults captured in traps and adults recovered in food patches under all shelves for the control treatment (r=0.70±0.20, P<0.01; n=15), but this relationship did not correlate in the cyfluthrin-treated replications (r=0.46±0.25, P=0.09; n=15) (fig. 7a). In the control treatment, there was no correlation between adults recovered in food patches under all shelves and dead adults found on the floor (r=0.37±0.26, P=0.18; n=15), but this correlation was significant in the cyfluthrin-treated warehouses (r=0.64±0.21, P=0.01; n=15) (fig. 7b). Finally, there was a strong correlation (r=0.73±0.19, P<0.01; n=15) between mean adults captured in traps in the untreated replications and mean dead individuals recovered on the floor in the cyfluthrin-treated replications.
Line and scatter plots of (a) mean adult captures in traps vs. mean adults per gram flour recovered in food patches and (b) mean dead adults recovered on floors vs. mean adults per gram flour recovered in food patches in the control and cyfluthrin-treated warehouses. Lines were fitted for significant correlations only (•, control; ○, cyfluthrin).

Discussion
One of the objectives was to compare T. castaneum population trends suggested by insect captures with direct estimates in untreated and cyfluthrin-treated pilot-scale warehouses in a long term study. The plot of adult captures in pitfall traps (fig. 3b) strongly suggested that the population was increasing through the end of August in the control replications, but there was no indication of population increase in the cyfluthrin-treated replications. However, the plot of adults recovered in the direct samples (fig. 4c) showed that both populations, starting five weeks after the study commenced, were increasing at similar rates regardless of insecticide treatment. This scenario led to the correlation between the number of adults captured in the traps and adults recovered in the food patches being significant for the control treatment only. Managers relying on trap captures in the cyfluthrin-treated structure could easily be deceived into believing that a residual insecticide application was suppressing population growth when, in fact, the insect population in the treated environments was increasing at the same rate as those in the untreated environments.
Pheromone trap capture data in individual traps can be variable for many reasons beyond differences in temperature and insect population density. Warehouses and food processing plants are often temporally and spatially fragmented landscapes; therefore, some traps could be positioned closer to food and refugia than others. Campbell & Hagstrum (Reference Campbell and Hagstrum2002) studied T. castaneum adult movement in small arenas and showed that individuals outside of flour patches were much more likely to be observed near the edges of the area than out in the open. Many studies have shown that insect captures will be greater under refugia, in corners, along walls and near food sources (Arbogast et al., Reference Arbogast, Kendra, Mankin and McDonald2002; Campbell et al., Reference Campbell, Mullen and Dowdy2002; Campbell & Hagstrum, Reference Campbell and Hagstrum2002; Toews et al., Reference Toews, Arthur and Campbell2005a). In the absence of contact pesticide usage, good sanitation in the warehouse or retail environment increases the number of insects captured in traps (Roesli et al., Reference Roesli, Subramanyam, Campbell, Kemp, Credland, Armitage, Bell, Cogan and Highley2003a; Toews et al., Reference Toews, Arthur and Campbell2005a). These data show that pesticide usage is another factor that must be considered when evaluating population indices based on pheromone trapping captures. Managers must give at least some consideration to each of these factors when evaluating short term population trends.
Pest management professionals are mindful of new decision support tools and pest control methods. Here, the number of dead insects removed from each warehouse on a weekly basis (fig. 2) confirmed that the overall insect population in the cyfluthrin-treated warehouses was indeed increasing, as shown by direct sampling in the food patches (fig. 4c). Interestingly, the plots of adults captured in traps in the control replications (fig. 3b) and dead insects recovered in the cyfluthrin-treated warehouses (fig. 2) are virtually mirror images of each other; these two population parameters were in fact tightly correlated. Therefore, the authors propose that dead individuals be considered as an indicator of a continuing infestation, rather than proof that their residual insecticide program is working.
Adult mortality before capture in the traps is the obvious explanation for the discrepancy between adults captured in traps between the cyfluthrin-treated and control pilot-scale warehouses. Previous studies with cyfluthrin treatment utilize continuous or fixed exposure periods (Arthur, Reference Arthur1994a, Reference Arthur1999a,Reference Arthurb) in contrast to the unknown exposure duration here. Relatively short (2 h) confinement on partially-treated concrete in the laboratory left a majority of individuals mobile (Arthur, Reference Arthur1998, Reference Arthur1999a), which obviously occurred here because dead insects were observed throughout the warehouses. In the laboratory, >10% of T. castaneum adults survived for seven days after a 1-h exposure to cyfluthrin-treated concrete (Arthur, Reference Arthur1994a). A delayed toxic effect has been described (Arthur, Reference Arthur1999a), and this temporal sublethal exposure likely stressed the individuals to the point where poisoning affected biological function beyond simple locomotion. Laboratory studies clearly show that food availability following cyfluthrin exposure will significantly improve recovery (Arthur, Reference Arthur2000). Although dead insects were typically recovered in close proximity to the insecticide bands, the concurrent presence of refugia, darkness and food patches also likely helped retain insects in this general area and reduced dispersal to traps. Because it is likely that beetles would be able to survive to reach pheromone traps, the authors hypothesize that insecticide exposed individuals may be less attracted to the pheromone-baited traps, perhaps more concerned with finding refugia.
The third objective of this experiment was to test the hypothesis that a band of cyfluthrin around an uninfested commodity (clean food patch) would prevent or reduce future insect infestation. There are two direct pieces of evidence to refute this hypothesis. First, adults were captured in pitfall traps during every sampling interval of the experiment. The only way for insects to crawl into the traps (other than flight) would be to crawl over the band of insecticide encircling the north shelves where the insects were initially released. Cox et al. (Reference Cox, Wakefield and Jacob2007) studied T. castaneum flight initiation and showed that the absolute minimum threshold was 25.0°C, but flight activity generally occurred above 27.5°C. Thus, flight activity in the warehouses was most likely minimal. Second, the uninfested food patches (located under the south and east shelves) contained small numbers of larvae starting at the second week of the study. Flour was frozen before the study so these eggs resulted from females exploiting the resource patches. The authors hypothesize that some mobile females were able to oviposit in the food patches before they died from exposure to the cyfluthrin residues. Interestingly, the initially uninfested food patches stayed low for about six weeks, which is the time required for one life cycle at these temperatures. Within one generation, immigrating populations were able to colonize clean food patches (those under the south and east shelves) to the same density as the initially infested food patches (north shelf).
Cyfluthrin applications, in this experiment, were carefully targeted around the food patches but not directly on them. This would be similar to typical warehouse scenarios where a pest management professional is unable to pinpoint infestation source because the food and refugia are located behind a hollow wall, or inside a crack, crevice or other inaccessible location (Pinniger, Reference Pinniger1974; Barson, Reference Barson1991). The experimental methods precluded insecticide exposure avoidance in space because the cyfluthrin bands completely encircled the clean food patches. Insect repellence to cyfluthrin is not described in the literature, and these data suggest little if any occurred. Despite the fact the highest labeled cyfluthrin rate was utilized and the experimental protocol assured that individuals would have to be exposed at least twice, the insect populations between infested and initially uninfested were identical after only six weeks. These findings may be disconcerting to pest management professionals because cyfluthrin is widely used and recommended. Previous research (i.e. Arthur, Reference Arthur1994a, Reference Arthur1998), including this study, shows that this compound generally provides excellent mortality to T. castaneum. Although the total amount of active ingredient applied in each warehouse was fairly small, it would likely be comparable to the total amount of material applied relative to the total area of a commercial warehouse. Findings here illustrate the serious degree that untreated refugia decrease the overall efficacy of these applications.
A likely criticism of this work is that the experimental protocol utilized only one application of cyfluthrin as opposed to more frequent (i.e. monthly) applications. Insecticide breakdown is governed by chemistry, surface, time and environmental factors. Previous research (Williams et al., Reference Williams, Semple and Amos1983) has shown that pyrethroid residues were much more persistent (24 weeks) than an organophosphate (1 week) when bioassayed using Rhyzopertha dominica F. (Coleoptera: Bostrichidae). In addition, residual activity is generally better on non-porous surfaces than porous surfaces, like concrete or wood (Watters, Reference Watters1970, Reference Watters1976; Williams et al., Reference Williams, Semple and Amos1982, Reference Williams, Semple and Amos1983; Yadav & Jha, Reference Yadav and Jha1983). Arthur (Reference Arthur1994a,Reference Arthurb) showed, specifically, that cyfluthrin efficacy against T. castaneum was much greater on sealed surfaces, such as those used here, than on untreated concrete. In contrast to organophosphate insecticides, pyrethroids are generally negatively correlated with temperature, and this is also true of cyfluthrin (Hinks, Reference Hinks1985; Johnson, Reference Johnson1990; Braness et al., Reference Braness, Coster and Bennett1991; Wadleigh et al., Reference Wadleigh, Koehler, Priesler, Patterson and Robertson1991). Arthur (Reference Arthur1999b) examined the effect of temperature on the residual toxicity of cyfluthrin to T. castaneum at temperatures ranging from 20 to 35°C and concluded that frequent applications were only warranted when the temperatures exceeded 25°C. Ultra-violet radiation was also minimal since the experiment was conducted indoors under incandescent light. Here, more dead adults were recovered in the cyfluthrin-treated warehouses than in the controls (fig. 3b). In fact, mortality in the cyfluthrin-treated warehouses was actually increasing through the last four weeks of the study. In light of these facts, these data clearly do not support the hypothesis that cyfluthrin residues were no longer effective and that more frequent cyfluthrin applications were necessary.
In summary, populations of T. castaneum that inhabit structures have the ability to escape insecticide exposure in time and space. These data and that of the aforementioned studies show that T. castaneum captures in pheromone-baited trapping programs are accurate monitoring tools for detecting population changes in untreated structures. Traps are particularly useful for precision targeting where infestations originate (Brenner et al., Reference Brenner, Focks, Arbogast, Weaver and Shuman1998; Arbogast et al., Reference Arbogast, Kendra, Mankin and McGovern2000, Reference Arbogast, Kendra and Chini2003, Reference Arbogast, Chini and McGovern2005; Toews et al., Reference Toews, Campbell, Arthur and West2005b, Reference Toews, Campbell, Arthur and Ramaswamy2006b). However, the evidence from this tightly controlled study showed that traps were not effective at showing T. castaneum population trends when a residual application of cyfluthrin was concurrently used. Further evaluation is needed to determine how robust this finding may be relative to changes in the experimental conditions and insect species. For example, changes in the age structure of the population, proportion of treated area, distance between resource patches, pest density and resource patch size may also influence these relationships. Pest management professionals should embrace these findings and take all issues into account when evaluating pest populations. The use of complementary monitoring methods, such as enumeration of dead individuals on the floor or limited direct monitoring (product sifting), are valuable tools under this circumstance.
Acknowledgements
We thank Jackie Rowan, Brian Barnett, Rich Hammel, Matt Kennedy and Caleb Doll for excellent technical support. Xinzhi Ni and Robert McPherson reviewed an earlier draft and made many helpful suggestions to improve the manuscript. This work was funded with partial support from USDA/CSREES (RAMP) under Agreement No. 2005-51101-02358 and USDA/CSREES (PMAP) under Agreement No. 2005-34381-15952. Mention of trade names or commercial products in this publication is solely for the purpose of providing specific information and does not imply recommendation or endorsement by the US Department of Agriculture or the University of Georgia.



