I. INTRODUCTION
Tensile and compression tests have long been used to obtain material properties. However, there are limitations in terms of specimen preparation and equipment when it comes to the application to micro/nano materials. On the other hand, by indentation tests, unlike tensile or compression tests, we can predict and measure material properties from load–depth curves by applying micro/nano indentation to micro/nano materials or the part in use. For these reasons, there have been many studies on instrumented indentation tests. Reference Chen, Yan and Karlsson1–Reference Lee, Lim, Hyun and Lee3
The loading curves from self-similar indenters, e.g., conical and pyramidal indenters, generally follow Kick's law Reference Kick4 :
 $$P = C\mathop {{h_{\rm{t}}}}\nolimits^2 \quad {\rm{,}}$$
where P, h t, and C are indentation load, indentation depth, and Kick's law coefficient, respectively. To obtain material properties of a given material from an indentation test, there should be a one-to-one match between the load–depth curve obtained from an indentation test and its material properties. However, equal load–depth curves can be obtained for different materials due to the self-similarity of sharp indenters. Reference Chen, Ogasawara, Zhao and Chiba5,Reference Lee, Lee and Kim6 Previous studies Reference Dao, Chollacoop, Van Vliet, Venkatesh and Suresh7,Reference Chollacoop, Dao and Suresh8 tried to solve this problem by using the concept of representative strain εR, which changes with the half-included angle of the indenter. Most of the reverse analysis methods are based on the concept of εR introduced by Tabor. Reference Tabor9 With Eq. (2), Dao et al. Reference Dao, Chollacoop, Van Vliet, Venkatesh and Suresh7 found that stress–strain curves having the same C exhibit the same true stress at εR = 0.033 for sharp indentation.
 $${\sigma _{\rm{R}}} = {\sigma _0}{\left( {1 + {E \over {{\sigma _0}}}{\varepsilon _{\rm{R}}}} \right)^n}\quad {\rm{.}}$$
Here σR is the representative stress, σ0 is the yield strength, E is the Young's modulus, n is the strain hardening exponent. Based on Dao's Reference Dao, Chollacoop, Van Vliet, Venkatesh and Suresh7 study, Cao and Lu Reference Cao and Lu10 provided an analytical framework for extracting plastic properties of metals from the load–depth curve of spherical indentation. However, the definition of εR and values of εR themselves varied from study to study; It is hard to define the master σR and εR applicable to all kinds of materials. Lee et al. Reference Lee, Kim and Lee11 showed that definitions of σR and εR in the literature depend partly on material properties, not only indenter angle for sharp indenter and indentation depth for spherical indenter. They even questioned the representativeness of εR. This motivates us to find a method for material property evaluation without adopting the concept of εR.
Beghini et al. Reference Beghini, Bertini and Fontanari12 determined the parameters of stress–strain relation from the inverse FE model in spherical indentation. Bobzin et al. Reference Bobzin, Bagcivan, Theiß, Brugnara and Perne13 proposed a method to determine the plastic flow curve of thin coatings with spherical indenter. Using the method of Juliano, Reference Juliano, VanLandingham, Weerasooriya and Moy14 they determined the yield stress based on the load–depth curve from nanoindentation. In contrast to a spherical indenter, a single sharp indenter Reference Alkorta, Martinez-Esnaola and Gil Sevillano15,Reference Luo, Lin and Dean16 cannot provide mechanical properties. Lee et al., Reference Lee, Lee and Kim6 Cheng and Cheng, Reference Cheng and Cheng17 and Swaddiwudhipong et al. Reference Swaddiwudhipong, Tho, Liu and Zeng18 also showed that there are many materials with equal values of Kick's law coefficient C. To solve this ambiguity, methods of dual conical indentation were suggested by Chollacoop et al. Reference Chollacoop, Dao and Suresh8 and Bucaille et al. Reference Bucaille, Stauss, Felder and Michler19 Without using the definition of εR, Swaddiwudhipong et al. Reference Swaddiwudhipong, Tho, Liu and Zeng18 and Le Reference Le20 and Hyun et al. Reference Hyun, Kim, Lee and Lee21 found the relationship between the P–h t curves and the material properties with sharp indentation. They then built an algorithm of reverse analysis for dual conical indentations.
At the same indentation depth, there has been misconception that conical indenter (θ = 70.3°) and triangular pyramidal indenter (α = 65.3°; Berkovich) have the same load–depth curve and projected contact area. The geometry of conical indenter has the advantage of being analytically more tractable, as well as being easier to perform in FEA. However, a significant difference between the two indenters exists for the projected contact area and contact stiffness. Shim et al. Reference Shim, Oliver and Pharr22 showed that load–depth curves from two indenters are different due to their differences in projected contact area and contact stiffness. Similarly, Min et al. Reference Min, Chen, Liang and Wang23 have shown in FE simulations of indentation in copper that the P–h t curve for the Berkovich indenter is a little higher than that for the 70.3° conical indenter. Therefore, an independent investigation on triangular pyramidal indentation is essential in a practical point of view.
This study focuses on the dual indentation method for property evaluation with triangular pyramidal indenters based on the reverse analysis without using the concept of representative strain. First, we check the load–depth curves of conical and triangular pyramidal indenters at the same indentation depth. FE analysis 24 is used to explore the effect of the angle of triangular pyramidal indenter on the P–h t curve. We calculate the projected contact area, and use it for the modified equation of Young's modulus evaluation. Next, the correlation between load–depth curve and material properties is analyzed to develop an indentation property evaluation algorithm based on two triangular pyramidal indenters with different centerline-to-face angles, and to examine its validity and sensitivity.
II. COMPARISON OF PROJECTED CONTACT AREAS FOR CONICAL AND BERKOVICH INDENTATIONS
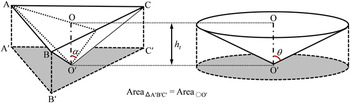
Figure 1 shows a triangular pyramidal indenter, and its equivalent axisymmetric conical indenter giving the same projected area at equal depth; Area of triangle A′B′C′ is equal to area of circle O′. The centerline-to-face angle of the triangular pyramidal indenter (α) and the corresponding half-included angle of the conical indenter (θ) are related to each other via
 $$\theta = {\tan ^{ - 1}}\left( {\sqrt {{{3\sqrt 3 } \over \pi }} \tan \alpha } \right)\quad {\rm{.}}$$
Schematic diagram of a triangular pyramidal indenter with the indenter angle α, and its equivalent axisymmetric conical indenter with the indenter angle θ giving the same projected area.

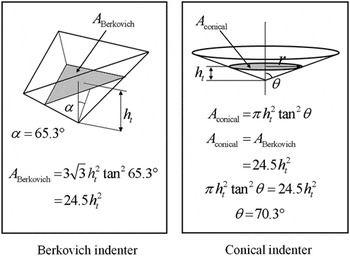
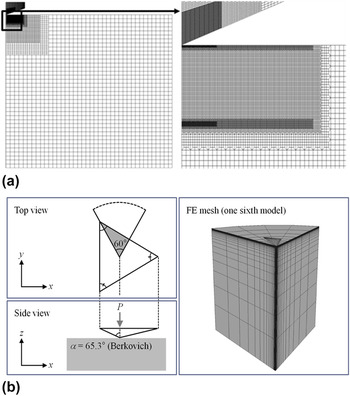
The equivalent cone angle of the Berkovich indenter (α = 65.3°) is θ = 70.3° (Fig. 2). For the same indentation depth, we compare projected contact areas for conical and Berkovich indentations to see whether the theoretical statement is in accordance with FE results. Details on acquiring the contact area will be provided later. Figure 3 shows the finite element model for both indenters. For the FE model for conical indentation, 4-node axisymmetric elements (CAX4, Abaqus 24 ) are used. Considering the symmetry of the triangular pyramidal indenter, only one sixth of indenter and specimen are modeled using three-dimensional 6-node (C3D6, Abaqus 24 ) and 8-node (C3D8, Abaqus 24 ) elements. The indenter is made of tungsten carbide (WC; E I = 537 GPa and νI = 0.24). We adopted the same minimum element size of FE model for conical and triangular pyramidal indentation. In simulations with WC indenters, we consider only elastic deformation of indenter. All simulations are performed to a maximum indentation depth of h max = 0.05 mm.
Schematic of two indenters with the same projected contact area.

Overall mesh design (a) using axisymmetric conical indenter and (b) 1/6 triangular pyramidal indenter (α = 65.3°; Berkovich).

The material is assumed to obey the following piecewise power law suggested by Rice and Rosengren Reference Rice and Rosengren25
 $${{\varepsilon _{\rm{t}} } \over {\varepsilon _0 }} = \left\{ {\matrix{\!\!\!\!\!\!\!\!\!\!\!\!\!\!\!\!\!\!\!\!\!\!\!\!\! {{\sigma \over {\sigma _0 }}\quad \;\;\,{\rm{for}}\;\sigma \;\le\; \sigma _0 } \cr {\left( {{\sigma \over {\sigma _0 }}} \right)^n \quad {\rm{for}}\;\sigma > \sigma _0 ;1 \;\lt \;n \;\le \;\infty } \cr } } \right.\quad {\rm{,}}$$
where ε0 (= σ0/E) is the yield strain, E is the Young's modulus, and σ0 is the yield strength. Total strain εt can be divided into elastic and plastic strain (εt = εe + εp). Hyun et al. Reference Hyun, Kim, Lee and Lee21 (sharp indentation) and Lee et al. Reference Lee, Lee and Pharr26 (spherical indentation) have shown that the influence of friction coefficient f on the load–depth curve is negligible for nonzero f. Qin et al. Reference Qin, Huang, Hwang, Song and Pharr27 further showed that for indenters with high indenter angles friction does not affect the load–depth curve. Since friction coefficient between metals is usually 0.1 ≤ f ≤ 0.4, we use f = 0.2 in this study.
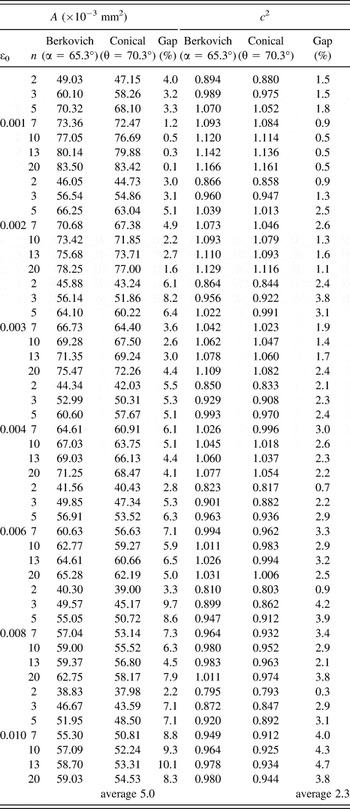
We checked the difference between projected contact areas A for 56 different materials (E = 200 GPa; ε0 = 0.001, 0.002, 0.003, 0.004, 0.006, 0.008, 0.010; n = 2, 3, 5, 7, 10, 13, 20). Table I shows that the values of A obtained by Berkovich indentation are larger than the values obtained by conical indentation for all the given materials. The average gap between A values increases with increasing ε0. Our results are consistent with the findings by Shim et al. Reference Shim, Oliver and Pharr22 who reported that conical and Berkovich indenters produce different projected contact areas at equal indentation depths.
Comparison of A and c 2 for two different indenters (E = 200 GPa, h max = 0.05 mm).

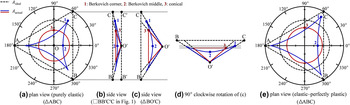
In a fashion equal to Shim et al., Reference Shim, Oliver and Pharr22 Figs. 4(a) and 4(e) provide the projected contact areas at h max = 0.1 mm for conical and Berkovich indentations of pure elastic and elastic-perfectly-plastic materials (E = 72 GPa, Poisson's ratio ν = 0.17; σ0 = 5.5 GPa). While for purely elastic indentation, the projected contact area for Berkovich indentation is smaller than that for conical indentation (0.094/0.099 mm2 = 94.9%), for elastic-perfectly-plastic indentation, it is larger (0.135/0.128 mm2 = 105.5%). Both indenters undergo sink-in for the two materials which are given. More notably, the contact line of Berkovich indenter is not in a plane differently from that of conical indenter. This is illustrated in Figs. 4(b)–4(d) which show the side views of the contact perimeters. Figure 4(b) is the contact lines projected on the rectangle BB′C′C plane of Fig. 1, and Fig. 4(c) is the contact lines for normal view to triangle BO′C of Fig. 1. In Berkovich indentation, the concave appearance of contact impression is caused by further sink-in at the middle of indenter faces than sink-in at edges. It can readily be understood with the 90° clockwise rotation of Fig. 4(c), which results in Fig. 4(d). Nonequal projected contact areas of two indenters and nonplanar contact line of Berkovich indenter are the main sources of different indentation characteristics of two indenters.
The plan view and side view of indentation contact geometries in pure elastic material and elastic-perfectly-plastic material.

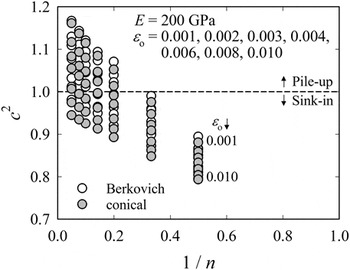
To consider the pile-up/sink-in behavior we introduce the dimensionless parameters c
2|conical ≡ (h + h
g)/(h
max + h
g),
 $c_{\left| {{\rm{triangular}}\;{\rm{pyramidal}}} \right.}^2 \equiv \sqrt {{A \mathord{\left/ {\vphantom {A {A_{\rm{t}} }}} \right. \kern-\nulldelimiterspace} {A_{\rm{t}} }}}$
. Here h is the actual indentation depth considering pile-up or sink-in, and h
g is the difference between the depths obtained using conical indenters with zero and finite tip-radius.
Reference Lee, Lee and Kim6,Reference Hyun, Kim, Lee and Lee21
A
t is the nominal (theoretical) projected contact area at h
max. In practice, it is very hard to get the projected contact area at maximum load P
max. The key parameter in this study is the actual projected contact area A. To evaluate the actual projected contact area A, we adopt the approach by Hay and Crawford
Reference Hay and Crawford28
and take the intersection of the line through the last two surface nodes in contact with the line through the first two nodes not in contact (zero contact pressure) at P
max. For both indenters, c
2 is plotted against 1/n in Fig. 5. c
2|triangular pyramidal is always larger than c
2|conical for all elastic–plastic materials (Table I). For the evaluation of properties by a dual indentation technique, it is therefore necessary to study the triangular pyramidal indenter case separately from the conical indenter case.
Comparison of c 2 values for two different indenters.

III. CALCULATION OF YOUNG’S MODULUS
From the indentation P–h t data, Young's modulus can be calculated by Reference Oliver and Pharr29
 $$S = \beta {2 \over {\sqrt \pi }}{E_{\rm{r}}}\sqrt A \quad {\rm{.}}$$
Here S is the contact stiffness; E r is the effective Young's modulus; and β is a correction factor that depends on the indenter geometry (βVickers = 1.012, βBerk = 1.034). Reference King30 The definition of E r is
 $${1 \over {{E_{\rm{r}}}}} \equiv {{\left( {1 - {\nu ^2}} \right)} \over E} + {{\left( {1 - \mathop {{\nu _{\rm{I}}}}\nolimits^2 } \right)} \over {{E_{\rm{I}}}}}\quad {\rm{.}}$$
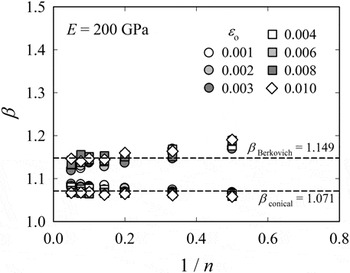
The section regressed to get the contact stiffness S is set to ΔP/P max = 20%, as in Hyun's study. Reference Hyun, Kim, Lee and Lee21 Hay et al. Reference Hay, Bolshakov and Pharr31 considered the elastic radial displacement and proposed that β is a function of the indenter's half-included angle and Poisson's ratio. Pharr Reference Pharr32 derived β by assuming that the Berkovich indenter can be adequately modeled by a 70.3° cone. Similar to c 2, we check β for Berkovich and conical indenters for the same material properties. Figure 6 provides β values obtained for the two indenters. Since the deviation of β from its average is <5%, irrespective of material properties, β can be regarded as a constant. The average β value for Berkovich indentation (βBerko = 1.149) is 6.8% higher than for conical indentation (βcone = 1.071). The result is in agreement with Shim et al. Reference Shim, Oliver and Pharr22 who found βBerko = 1.141–1.158 and βcone = 1.060–1.072. In this study, we take the average βBerko = 1.149.
β versus 1/n curves for various values of ε0 with two different indenters.

Young's modulus E can be derived by Reference Oliver and Pharr29
 $$E = {{\left( {1 - {\nu ^2}} \right)S\sqrt \pi {E_{\rm{I}}}} \over {2\beta \sqrt A {E_{\rm{I}}} - \left( {1 - \mathop {{\nu _{\rm{I}}}}\nolimits^2 } \right)S\sqrt \pi }}\quad {\rm{.}}$$
To obtain
 $\sqrt A$
as a function of ε0 and n we propose
 $$\eqalignb{ & {c^2} \equiv \sqrt {{A \mathord{\left/ {\vphantom {A {{A_{\rm{t}}}}}} \right. \kern-\nulldelimiterspace} {{A_{\rm{t}}}}}} = {f^{{\rm{TP}}}}\left( {{\varepsilon _0},n} \right) = f_{1i}^{{\rm{TP}}}\left( {{\varepsilon _0}} \right){n^{ - i}} = \left( {{\kappa _{1ij}}\mathop {{\varepsilon _0}}\nolimits^j } \right){n^{ - i}} \cr & \quad\quad\quad\quad\!\! i,j = 0,1,2,3\quad {\rm{.}} \cr}$$
Inserting Eq. (8) into (7) we can write
 $$E = {{\left( {1 - {\nu ^2}} \right)S\sqrt \pi {E_{\rm{I}}}} \over {2\beta {c^2}\sqrt {{A_{\rm{t}}}} {E_{\rm{I}}} - \left( {1 - \mathop {{\nu _{\rm{I}}}}\nolimits^2 } \right)S\sqrt \pi }} = {{\left( {1 - {\nu ^2}} \right)S\sqrt \pi {E_{\rm{I}}}} \over {2\beta {f^{{\rm{TP}}}}\left( {{\varepsilon _0},n} \right)\sqrt {{A_{\rm{t}}}} {E_{\rm{I}}} - \left( {1 - \mathop {{\nu _{\rm{I}}}}\nolimits^2 } \right)S\sqrt \pi }}\quad {\rm{.}}$$
IV. CHARACTERISTICS OF INDENTATION DEFORMATION
A. Characteristics of load–depth curves
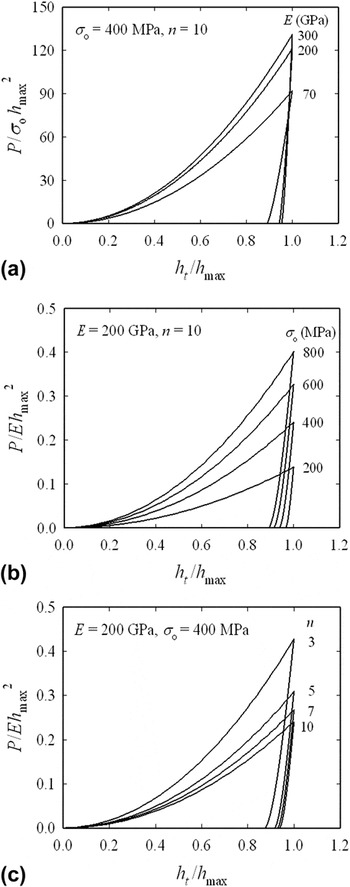
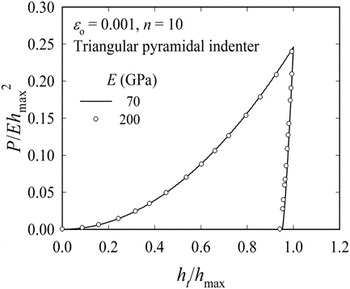
Figure 7 shows the effects of E, σ0, and n on the P–h t curves for Berkovich indentation. The load P increases with E and σ0, but decreases with n for equal h t. Note that unloading curves vary sensitively with E. While all the material properties affect the P–h t loading curve, the slope of unloading part is only sensitive to E. Figure 8 shows the P–h t curve for two different materials with equal ε0 and n. When horizontal and vertical axes are normalized by h max and (Eh max 2), respectively, the load–depth curves coincide, indicating the significance of ε0 rather than the absolute values of σ0 and E.
Loading curves for various values of (a) Young's modulus and (b) yield strength and (c) strain hardening exponent.

Identical load–depth curves for two dissimilar materials.

B. Characteristics of load–depth curves for different indenter angles
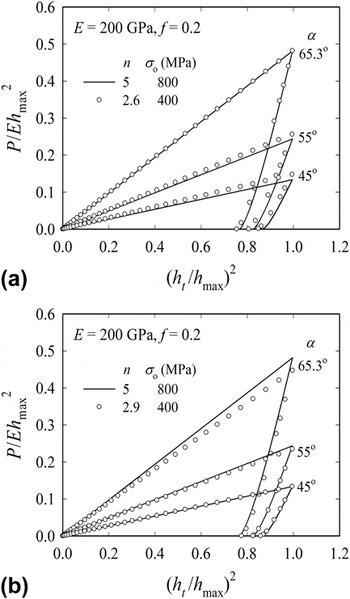
As stated above, Chen et al. Reference Chen, Ogasawara, Zhao and Chiba5 and Lee et al. Reference Lee, Lee and Kim6 demonstrated that different materials may have equal load–depth curves and thus equal Kick's law coefficients C. Therefore, a unique stress–strain curve cannot be obtained from a single P–h t curve. In this study, we calculate C values by regressing the data for (0.5–1) × h max as Lee et al. Reference Lee, Lee and Kim6 suggested. Figure 9 shows the load–depth curves of two different materials (case I: σ0 = 800 MPa, n = 5; σ0 = 400 MPa, n = 2.6; case II: σ0 = 800 MPa, n = 5; σ0 = 400 MPa, n = 2.9) with equal C and E for α = 65.3°, 55°, and 45°. While for some α, the load–depth curves coincide, they do not for other α (Fig. 9). Table II lists the gaps between C values of two materials for three α. For instance in case I, the difference between C values increases from 0 to 11% when α changes from 65.3° to 45°. This means, such two materials can be distinguished by using two self-similar indenters with different centerline-to-face angles.
Load versus depth curves for different material properties with the same C and E for (a) α = 65.3° and (b) α = 45°.

Comparison of C values with three centerline-to-face angles.

V. NUMERICAL APPROACH BASED ON FEA SOLUTION
A. Dual indentation method for triangular pyramidal indenter
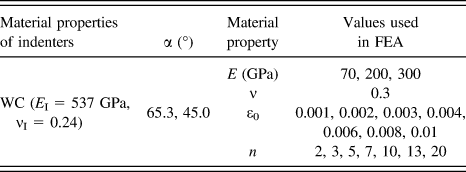
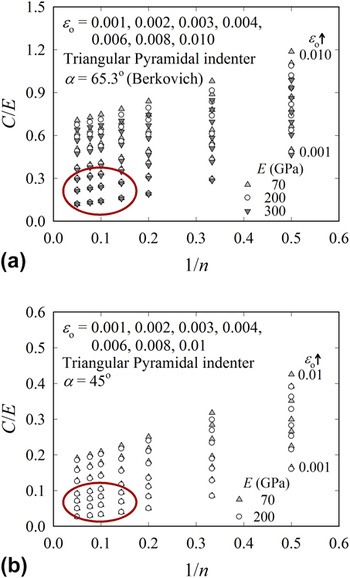
Based on the FE analysis results for a total of 294 cases (E: 3 × ε0: 7 × n: 7 × α: 2, Table III), we propose a method for determining material properties using two triangular pyramidal indenters. In Fig. 10, C/E versus 1/n curves are shown for various values of ε0 and α = 65.3° and 45°. The C values normalized by E are regressed to the following function
 $$\eqalign{ & {{{C_i}} \mathord{\left/ {\vphantom {{{C_i}} E}} \right. \kern-\nulldelimiterspace} E} = \mathop {{f_i}}\nolimits^{{\rm{TP}}} \left( {{\varepsilon _0},n} \right) = \mathop {{f_i}}\nolimits^{{\rm{TP}}} \left( {{\varepsilon _0}} \right){n^{ - j}} = \left( {{\psi _{ijk}}\mathop {{\varepsilon _0}}\nolimits^k } \right){n^{ - j}} \cr & \quad\!\quad i = 1,2{\rm{\ }};\quad j,k = 0,1,2,3\quad {\rm{.}} \cr}$$
Material properties for FE analyses.

C/E versus 1/n curves for various values of yield strain for (a) α = 65.3° and (b) α = 45°.

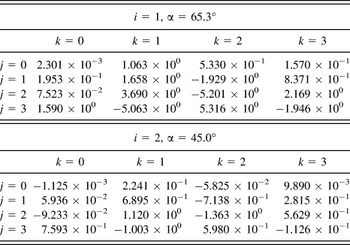
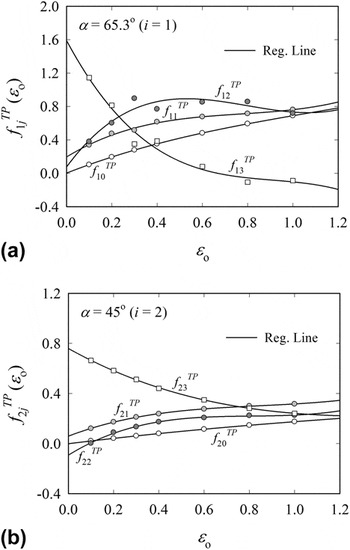
The indices i = 1 and 2 correspond to α = 65.3° and 45°, respectively. The fitting coefficients ψ ijk are given in Table IV. Regression curves are plotted in Fig. 11. Equation (10) is the regression equation for the material with E = 200 GPa.
Coefficients ψ ijk of Eq. (10).

Regression curves of f ij TP(ε0) in Eq. (9) versus ε0 (third regression) for (a) α = 65.3° and (b) α = 45°.

Based on additional analysis results for E = 70, 200, 300 GPa and inserting Eq. (9) into Eq. (10) we can write
 $$\!& {C_1} = E\mathop {{f_1}}\nolimits^{{\rm{TP}}} \left( {{\varepsilon _0},n} \right) = {{\mathop {{f_1}}\nolimits^{{\rm{TP}}} \left( {{\varepsilon _0},n} \right)} \over {M{f^{{\rm{TP}}}}\left( {{\varepsilon _0},n} \right) - N}} \leftrightarrow F\left( {{\varepsilon _0},n} \right) \quad\quad\quad\quad\quad\quad\quad\;\;\equiv {{\mathop {{f_1}}\nolimits^{{\rm{TP}}} \left( {{\varepsilon _0},n} \right)} \over {M{f^{{\rm{TP}}}}\left( {{\varepsilon _0},n} \right) - N}} - {C_1} = 0 \cr & {C_2} = E\mathop {{f_2}}\nolimits^{{\rm{TP}}} \left( {{\varepsilon _0},n} \right) = {{\mathop {{f_2}}\nolimits^{{\rm{TP}}} \left( {{\varepsilon _0},n} \right)} \over {M{f^{{\rm{TP}}}}\left( {{\varepsilon _0},n} \right) - N}} \leftrightarrow G\left( {{\varepsilon _0},n} \right) \quad\quad\quad\quad\quad\quad\quad\quad\!\!\!\equiv {{\mathop {{f_2}}\nolimits^{{\rm{TP}}} \left( {{\varepsilon _0},n} \right)} \over {M{f^{{\rm{TP}}}}\left( {{\varepsilon _0},n} \right) - N}} - {C_2} = 0 \cr & M = {{2\beta \sqrt {{A_{\rm{t}}}} } \over {S\left( {1 - {\nu ^2}} \right)\sqrt \pi }},\quad N = {{\left( {1 - \mathop {{\nu _{\rm{I}}}}\nolimits^2 } \right)} \over {E\left( {1 - {\nu ^2}} \right)}}\quad {\rm{.}} \cr}$$
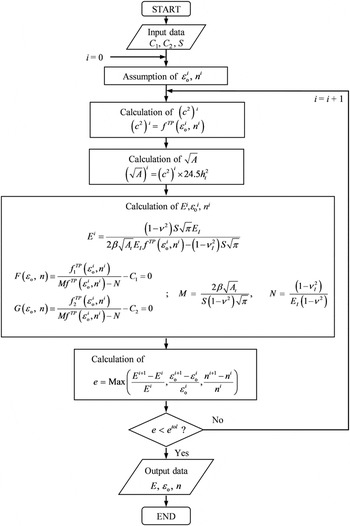
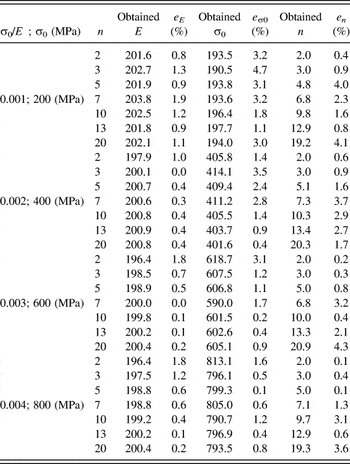
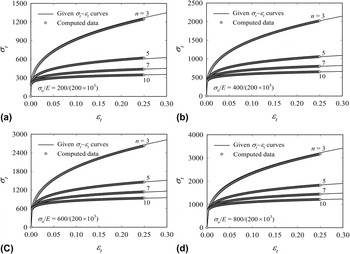
Values of ε0 and n are determined so that F = 0 and G = 0 are satisfied. Based on Eq. (11), a program is established that extracts material properties from load–depth input data from indentations using two triangular pyramidal indenters with different α values (Fig. 12). First, C 1, C 2, and S are obtained from the P–h t curves. Second, we assume initial values for ε0 and n. c 2 is then calculated from Eq. (8). E is computed from Eq. (9) based on c 2 and S. We then update ε0 and n until F = 0 and G = 0 in Eq. (11) are satisfied. E, ε0, and n values obtained with the program are provided in Table V; the corresponding stress–strain curves are shown in Fig. 13. The average error from FE input values is about 2% for the whole range of material properties.
Flow chart for determination of material properties.

Comparison of obtained material property values to those given for E = 200 GPa.

Comparison of computed stress–strain curves to those given for E = 200 GPa using WC indenter [ε0 = (a) 0.001, (b) 0.002, (c) 0.003, and (d) 0.004].

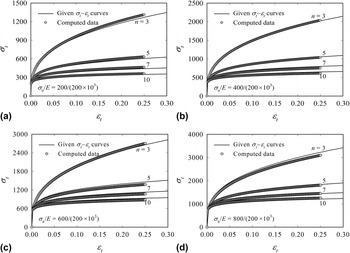
The program established with WC indenters (E I = 537 GPa, νI = 0.24) is also applicable for other elastic moduli, since the key variable is ε0 (and not E or σ0) as noted above. Inputting P–h t data obtained with a diamond indenter (E I = 1000 GPa, νI = 0.07) into the program, and replacing the properties of WC indenter with those of diamond indenter in Eqs. (9) and (11), we obtain material properties, which are very close to those from the WC indenter (Fig. 14). The studies of Lee et al. Reference Lee, Kim and Lee11,Reference Beghini, Bertini and Fontanari12 and Hyun et al. Reference Hyun, Kim, Lee and Lee21 provided a similar outcome.
Comparison of computed stress–strain curves to those given for E = 200 GPa using diamond indenter [ε0 = (a) 0.001, (b) 0.002, (c) 0.003, and (d) 0.004].

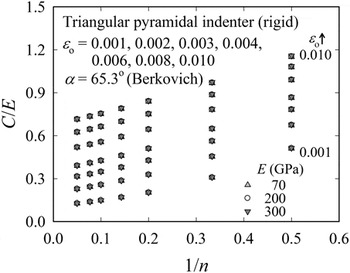
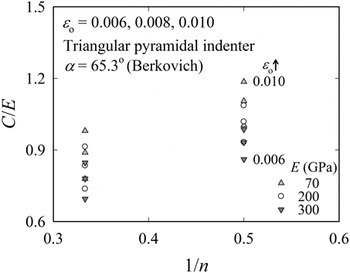
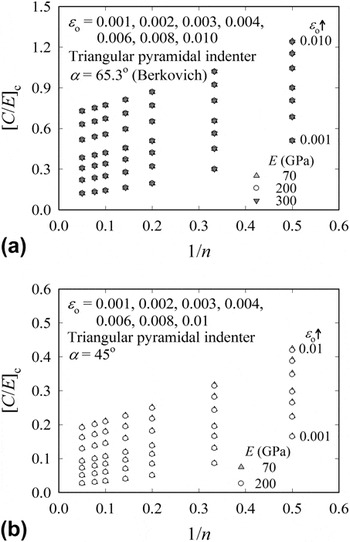
In contrast to rigid indenters (Fig. 15), C/E obtained with elastic indenters shows some sensitivity to E (Fig. 16). Owing to the indenter deformation, C/E values become sensitive to E for ε0 > 0.005 and n < 3. However, in engineering practice, ε0 and n are generally <0.005 and >3, respectively (circled region of Fig. 10), so that the program based on C/E can be regarded as valid for engineering purposes. Since the values of C/E are not equal for some material property combinations, we account for the indenter deformation by introducing a correction to make the approach independent of indenter deformation. C/E and P max for rigid indentation are higher than the corresponding values obtained with an elastic indenter. The approach is discussed in detail in a previous study of ours. Reference Kim, Bang, Rickhey and Lee33 Figure 17 demonstrates that the correction yields equal C/E values independent from E.
C/E versus 1/n curves from rigid indenter for various values of yield strain.

Enlargement of Fig. 10(a) for the region of ε0 > 0.005 and n < 3.

[C/E] c versus 1/n curves for various values of yield strain for (a) α = 65.3° and (b) α = 45°.

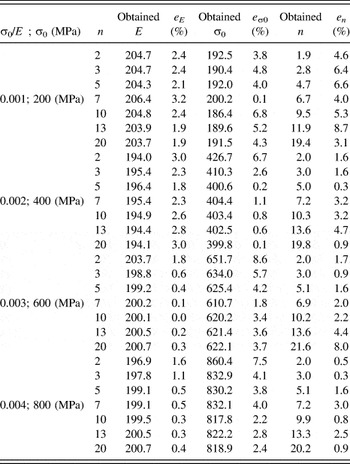
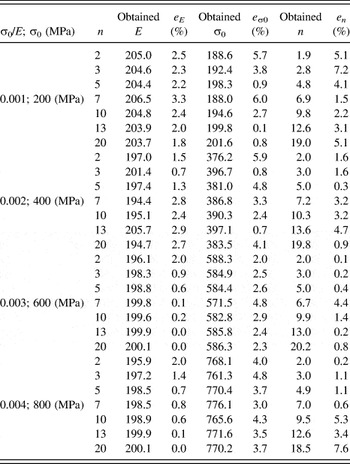
We check the sensitivity of our approach to a change in C. We assumed an error of 2%, which is equal to the error reported by Chollacoop et al. Reference Chollacoop, Dao and Suresh8 for real indentation experiments. C 1 and C 2 are simultaneously increased (or decreased) equally by 2%. The error in the estimated properties is about 3% on average (Tables VI and VII). We may therefore state that the proposed method has a rather weak sensitivity to an error in input parameters C 1 and C 2.
Comparison of obtained property values (E = 200 GPa, C 1: 2% ↑, C 2: 2% ↑).

Comparison of obtained property values (E = 200 GPa, C 1: 2% ↓, C 2: 2% ↓).

B. Evaluation of material properties from experimentally obtained stress–strain curves
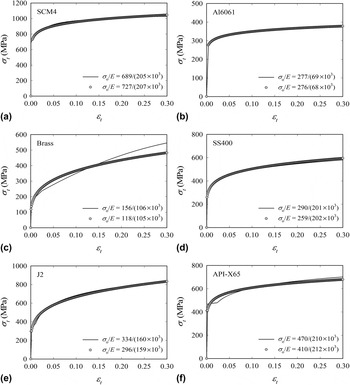
Indentation test simulation is conducted by using the tension/compression stress–strain curve data of six actual materials from the MTS hydraulic universal material tester. Figure 18 compares the stress–strain curve from the program with the actual values. The solid line refers to the tension/compression test and the gray line is the result from the program. The predicted stress–strain curves agree well with the given stress–strain curve except for brass. For brass, yield strength from the dual indentation method is 118 MPa, far from the actual yield strength (156 MPa). In the materials disobeying the power law, the difference between the actual and estimated σ0 is large. To estimate the properties for the materials like brass, regression functions with more variables should be used.
Comparison between stress–strain curves computed by two parameter regression of the total strain range and those measured by experiment for (a) SCM4, (b) Al6061, (c) Brass, (d) SS400, (e) J2, and (f) API-X65.

VI. SUMMARY
Triangular pyramidal indentation has different characteristics compared to conical indentation. It is noteworthy that nonequal projected contact areas of two indenters and nonplanar contact line of Berkovich indenter are the main sources of different indentation characteristics of two indenters. We observed that two materials having the same C for a given indentation angle can be distinguished by using indenters with different indenter angles. Based on dual triangular pyramidal indentations, mapping functions were established to convert indentation load–depth to E, ε0, and n. The proposed method holds for a wide range of material properties, with an average error <2%, and shows low sensitivity to errors in the input values of C 1 and C 2.
ACKNOWLEDGMENTS
This research was supported by Basic Science Research Program through the National Research Foundation of Korea (NRF) funded by the Ministry of Science, ICT and Future Planning (No. NRF-2012 R1A2A2A 01046480).