


INTRODUCTION
Among the principal processes that influence Antarctic ice-sheet stability are rifting and tabular iceberg calving along the seaward margins of the ice shelves. These processes determine the location of an ice shelf’s seaward terminus which, in turn, influences the extent of ocean/atmosphere heat exchange surrounding Antarctica, and the degree to which inland ice is buttressed by die ice shelf. A variety of theoretical treatments of tabular iceberg production have been proposed over the years (e.g. Reference SandersonSanderson, 1979). Little progress has been made, however, in the observational study of this subject since calving tends to be a rare, episodic event (Reference Jacobs, MacAyeal and ArdaiJacobs and others, 1986), and usually occurs from portions of an ice shell that are difficult to access by ground travel because of crevasse hazards.
Theoretical analysis suggests that flow and flexure occurring upstream of the calving terminus determines the location of the terminus, the frequency of calving and the size of icebergs calved. An illustration of this analysis was performed by Reference SandersonSanderson (1979) who considered an ideal ice shelf confined within a coastal channel with diverging sides. He proposed that the calving terminus would occur where the ice shelf separated from the walls of the coastal channel where the lateral, cross-channel strain rate in the ice shelf reached its upper bound (i.e. the spreading rate for an unconfined ice shelf first determined by Reference WeertmanWeertman (1957)).
Reference SandersonSanderson’s (1979) hypothesis is supported by the fact that the Filchner—Ronne, Ross and Amery ice shelves terminate where the coastline tends to diverge. It does not, however, address other factors that are necessary for iceberg calving, such as the formation of rifts along which tabular icebergs detach from the main ice shelf, tidal flexure, coastal roughness and strain heating.
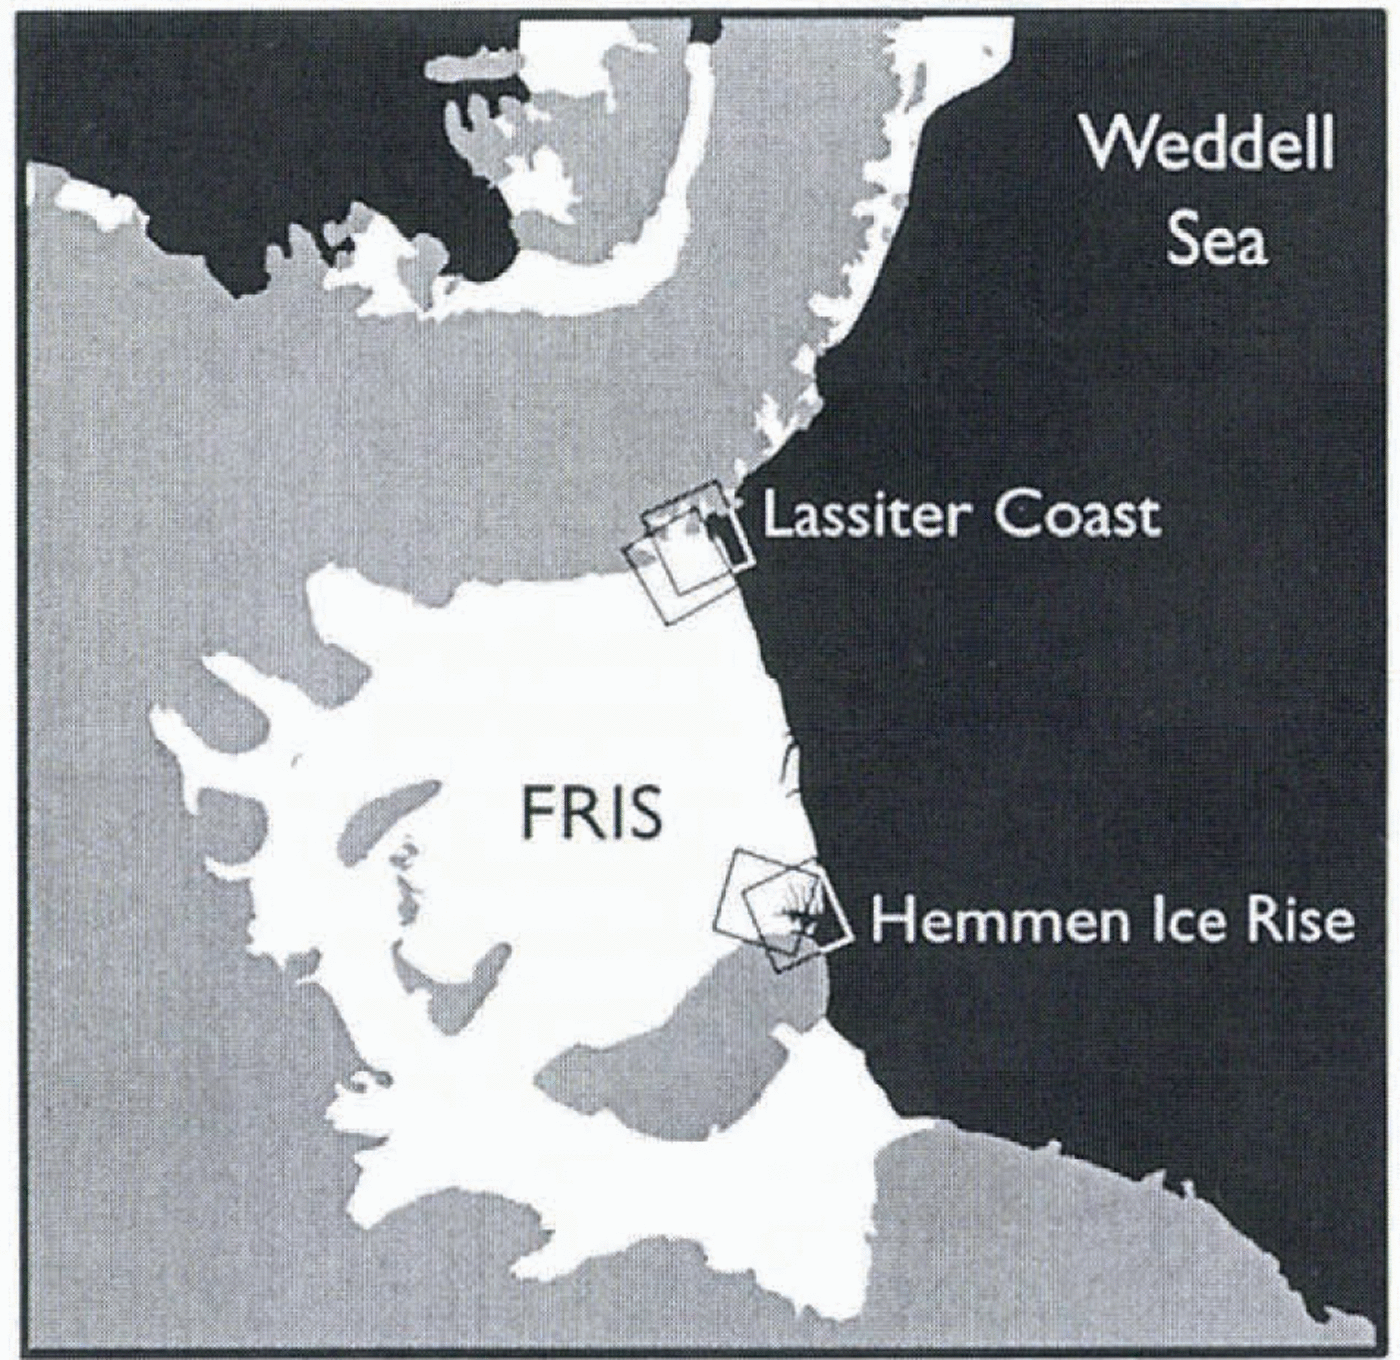
We have used synthetic aperture radar (SAR) interferometry to study the flow regime at two ends of the calving front of the Filchner-Ronne Ice Shelf (FRIS ; Fig. 1) to rectify the paucity of observations of iceberg caking and test the role and importance of the above-mentioned factors in iceberg calving. SAR interferometry is a method that measures ice-shelf surface displacements with a precision and spatial resolution far in excess of other, ground-based survey techniques (Reference Gabriel, Goldstein and ZebkerGabriel and others, 1989). We have applied this measurement technique to the caking-front end-points because SAR images of both sites (figs 2 and 3) reveal open water along the coasts, suggesting that the ice shelf is indeed separating from the coastal boundary. The flow regime in these regions deviates from the ideal geometry considered in Reference SandersonSanderson’s (1979) analysis since the eastern site is complicated by Hemmen lce Rise (HIR), and the western site along Lassiter Coast (LC) (and Orville Coast) is complicated by ice discharge from small inlets.
To construct our SAR interferograms, we used 15 passes of the European remote-sensing satellites ERS-1 and -2 over the study areas with varying orbital geometry, and with 1, 3, and 6 day repeat periods. Our selection was motivated by the pioneering work of by Reference Hartl, Thiel, Wu and DoakeHartl and others (1994) and K.-H. Thiel and others (unpublished information, 1996) who obtained and interpreted SAR interferograms of the study site near HIR, and demonstrated the applicability of SAR interferometry for the purpose we undertake here. Interferograms were acquired using SAR passes with both ascending- and descending-orbit viewing directions to construct vector displacements of the ice shelf (a single radar interferogram measures the ice-shelf displacement only in one direction), and to help locate the data thus obtained within a precise geographic reference frame. Furthermore, we compared multiple interferograms to distinguish the effects of tide and creep flow on the ice-shelf deformation regime.
The observations {SAR interferograms) presented here are the basis of companion papers (Hulbe and others, in press; Reference MacAyealMacAyeal and others, 1998) which apply finite-element modelling methods to investigate further the dynamics of ice shelves. In our presentation, we identify several features of ice-shelf flow that appear to play important roles in determining iceberg calving and separation of the ice shelf from its confining coast. These features include the influence of rifts, the apparent mechanical integrity of sea ice that fills rifts, the rigid-body rotation of ice-shelf fragments that appear to be stranded within this sea ice, strain heating within velocity shear layers along coastal boundaries, and the vibration modes of the ice shelf in response to tidal forcing.
Physical setting of study areas
Figure 1 shows the location and satellite-image geometry of two study areas on the eastern and western flanks of the calving front. The complexity of ice flow in these study areas is indicated by the degree of rifting visible in the annotated SAR images (amplitude images) shown in figures 2 and 3.
Hemmen Ice Rise
The study area on the eastern flank of the calving front (Fig. 2) contains HIR and part of Berkner Island (BI) which is the largest ice rise in Antarctica (Reference Swithinbank, Brunk and SieversSwithinbank and others, 1988). BI rests on a bed that is 200-300 m below sea level (Reference Hoppe and ThyssenHoppe and Thyssen, 1988), and reaches 700 m elevation along the eastern edge of the SAR scene. HIR is an oblong feature less than 100 km2 in size, consisting of stagnant, grounded and crevasse-free ice. The ice shelf surrounding HIR and BI has a thickness ranging from < 200 m at the ice front to about 400 m at the southern limit of the study area (see Reference VaughanVaughan and others, 1995, Fig. 3).
North of HIR, the FRIS is broken by large (up to 4 km wide) rifts presumably filled with a melange of sea ice, ice-shelf debris, wind-blown snow, and small tabular iceberg fragments (Reference Hartl, Thiel, Wu and DoakeHartl and others, 1994).These rifts seem to form the boundaries of large tabular ice-shelf fragments that are tens of km in horizontal span and appear to be precursors of tabular icebergs. The same features, including the melange and the tabular ice-shelf fragments, are visible in Landsat multispectral scanner (MSS) imagery (e.g. Reference SieversSievers and Bennat, 1989: Reference Hartl, Thiel, Wu and DoakeHartl and others, 1994).
The ERS SAR amplitude images of HIR (Fig. 2) reveal heavily crevassed areas, or radar-bright zones, that define a “boundary layer" surrounding HIR. The highly crevassed area extends several km upstream of HIR, and forms a 2 km wide band around HIR that can be traced several tens of km in the lee of the ice rise.
In contrast, the ice shelf along the coast of BI does not appear to be uniformly bright in the SAR amplitude images. The upstream section of ice shelf along BI (on the far left of the ERS scenes in Figure 2 and upstream of HIR) exhibits smooth modulations in radar brightness. These suggest the presence of ice rumples or pressure ridges. The downstream section of ice shelf along BI, however, is a radar-bright, chaotic ensemble of chasms and crevasses. The largest and presumably oldest chasms appear to be filled with sea ice, smaller ice-shelf fragments and wind-blown snow. These differences in radar brightness and crevassing suggest that the ice shelf is continuous with the grounded ice of BI upstream of HIR and separates from the grounded ice of BI at a point adjacent to the downstream end of HIR.
A 5 km wide strip of ice slightly darker than the ice shelf appears along the ice front in Figure 2. This is “fast ice”, an apron of sea ice that is rigidly fixed to the ice shelf. Outboard of the fast ice, the Weddell Sea appears in Figure 2 to be filled with large, packed sea-ice floes. The interferometric data obtained in that area suggest that the sea-ice cover was continuous at the time of observation, with no open leads (phase coherence and fringe visibility would be low if open water were present). These data also show that fast ice appears to be pushed ahead of the ice front at the same velocity as the ice shelf.

Lassiter Coast
Ice-shelf features along LC arc displayed in Figure 3, and are similar to those previously described along HIR and BI. The lack of an ice rise in the LC area is consistent with the greater water depths of the Weddell Sea in this area. Whereas ice influx across the boundary of BI is negligible, the ice shelf along LC is influenced by ice influx from three inlets: Hansen Inlet to the south, Gardner Inlet in the center and Nantucket Inlet to the north. The mountain ranges along the ice-shelf margin exceed 1000 m in elevation.
Pronounced radar-dark patches signifying large surface depressions or snow-covered chasms are seen at the junction between Hansen Inlet and the FRIS, directly in the wake of Dodson Peninsula (Fig. 3), These depressions or snow-covered chasms increase in size and width downstream from Dodson Peninsula, and develop into coastal rifts near where the ice shelf flows past Bowman Peninsula. These rifts initiate the rupturing and separation of the ice shelf from the grounded ice along the coast. The rifts visible in the SAR imagery are initially shorter than those along HIR, but exhibit a similar type of regularity. Tabular ice-shelf fragments of varying size up to 10 km in diameter are stranded within the rifts. As along HIR, the tabular ice-shelf fragments appear to be hound together by sea ice and wind-blown snow to form a melange that covers the sea surface within the rifts.
Tides vs ice-shelf creep
The southern reaches of the Weddell Sea display a mixed diurnal and semi-diurnal tide (Reference Smithson, Robinson and FlatherSmithson and others, 1996; Robertson and others, in press). Tidal amplitude is greatest along the coast of BI and the interior boundary of the FRIS and decays toward two amphidromic points located at approximately the midpoint of the ice front and farther north in the Weddell Sea, for the semi-diurnal and diurnal constituents, respectively. The phase of the semi-diurnal tide circulates clockwise around the amphidromic point near the ice front, and progresses from north to south in the study area along BI and HIR, and vice versa along LC. The phase of the diurnal tide progresses from cast to west and shows little variation within the study areas.
Tidal currents in the Weddell Sea are significantly influenced by the topographic modifications imposed by the FRIS. Strong tidal currents, up to 1ms−1, are expected along the ice-front area in association with the change in water-column thickness and the possible resonant excitation of topographic vorticity waves by the diurnal tide (Robertson and others, in press; see also Reference MacAyealMacAyeal, 1984, which discusses similar amplification of currents in the Ross Sea). These currents have a strong influence on the oceanic heat transfer across die ice front (by Reference ThyssenThyssen, 1988). They may additionally have a direct mechanical influence on the ice shelf through frictional drag which acts cyclically in the horizontal plane.

The velocity of the ice shelf in the western limit of the scene containing HIR (Fig. 2) is 1050 ± 20 m a −1, with an azimuth of 55° (Reference ThyssenThyssen, 1987) from north. The velocity vector is within 30-40° of the radar line of sight in both ascending and descending modes (see Table 1). Over the 3 day interval between SAR images used to construct the interferograms of the HIR area, the ice shelf moves by creep alone approximately 8.5 m at the extreme eastern limit of the images vs almost no motion on the grounded ice. This motion translates into a 3.3 m differential displacement between the ice-shelf center and the ice-shelf margin when projected in the radar line of sight. The tidal displacement over the same 3 day period is 1m or less in the vertical (see discussion below) and is less when resolved into the SAR line-of-sight direction which is 23° off the vertical. The interferograms of HIR are thus expected to be dominated by creep flow.
Ice velocity in the LC scene is about 920 ± 30 m a>-1, with an azimuth of 33° (Reference VaughanVaughan and others, 1995). Unlike circumstances for the HIR region, the time difference between SAR images used to construct interferograms of the LC region is only 1 day. Over this short time period the differential displacement between the margin and the ice-shelf center due to creep will be about 1 m along the radar line of sight, which is comparable to the amplitude of the tidal displacements. The interferograms of LC are thus expected to reveal an equal mixture of ice-shelf tidal motion and creep flow.
METHODS
Interferogram construction
Table 1 describes the frames, orbits and other relevant parameters of SAR images used to construct the interferograms of the study areas. Each SAR pass over HIR is separated by 3 days because the data were acquired during the 1992 3 day repeat-pass “ice phase” of ERS-1. Each ascending pass was acquired two orbits after the descending pass, which is 2 hours later. SAR images of LC were acquired during the 1995-96 ERS “tandem phase”, when ERS-2 followed ERS-1 along the same orbit 1 day later. Reference Hartl, Thiel, Wu and DoakeHartl and others (1994) and K.-H. Thiel and others (unpublished information, 1996) showed additional interferograms of the HIR study area.
The ERS SAR data were combined to produce radar interferograms at a sample spacing of 40 m x 40 m on the ground and covering an area 100 km x 100 km in size. Cyclic gray-scale patterns (i.e. fringes) in the interferograms of figures 4 and 5 represent phase difference between initial and final SAR images separated by a time interval (here 3 days) over which the reflecting surface of the ice shelf may move toward or away from the satellite’s vantage point. Each repetition of the gray-scale cycle is called a “ice phase” or a “fringe line”, and represents a change of 2 in the phase difference. The wavelength λ of the radar data is 56 mm. An ice-shelf surface displacement of λ/2 = 28mm along the radar range direction (look direction) during the time interval between the two SAR images induces a two-way change in the radar travel distance and a 2 phase differ

Interferometric baseline and differencing
The spatial baselines of the interferograms, i.e. the separation of the two positions of the satellite when the SAR images were acquired (Table l), were initially calculated using the precise-orbit information distributed by the European Space Agency (ESA) from the German Processing and Archiving Facility (DPAF) and subsequently refined using control points of known ice velocity (zero velocity on HIR) or elevation (prior digital elevation data on BI).The spatial baselines from the 1992 HIR data were typically short (≈10m), which means that the interferograms of HIR were weakly influenced by surface topography (the phase varied only by one-tenth of a fringe for a 100m variation in elevation). The baselines of the ERS tandem data acquired over LC were large (≈ 100-200m), but similar in magnitude and sign in the different interferograms, so that differential interferograms also had a difference baseline of only a few meters.

Phase unwrapping (“unwrapping"denotes the process of identifying the absolute phase of each fringe line through counting fringe lines along paths that lead away from locations of known velocity, such as the zero-velocity regions of HIR and BI) was performed using Reference Goldstein, Zebker and WernerGoldstein and others’ (1988) algorithm in which unwanted areas (e.g. sea-ice floes) and areas too difficult to unwrap (e.g. severely crevassed regions with sharp discontinuities in phase) were masked out. The phase values were absolutely referenced using control points on ice rises or rock outcrops where the surface velocity is near zero.

Cartographic projection
The ERS radar data were projected into a cartographie reference system, here a Lambert equal-area projection. To help in the process, we utilized a 5 km digital elevation model (DEM) of Antarctica (by Reference Bamber and BindschadlerBamber and Bindschadler, 1997) which was first registered to the SAR data (meaning projected into the radar imaging geometry) using precise orbit data, and subsequently interpolated to the natural sample spacing of the interferograms (40 m). The geolocation accuracy of this process is about 1 km.
To improve the geolocation accuracy, the same geolocation algorithm was applied to both ascending and descending passes, and the results were compared at the gridpoints of the original 5 km DEM. It was then assumed that the uncertainty in geolocation was mostly along track, due to uncertainties in the timing of the satellite passes. Uncertainties in the positioning of images in the range direction were assumed to be negligible since the echo-time delay of the radar signal is typically measured with great precision. Along-track time delays were adjusted in the least-squares sense so that all gridpoints of the DEM fell within 1-2 pixels (lOO m) of the same location in both passes. Using this combination of ascending and descending passes, we achieved a geolocation accuracy better than 100 m.
All interferograms were subsequently corrected for surface topography (influencing mostly grounded ice) using the registered 5km DEM of Antarctica (by Reference Bamber and BindschadlerBamber and Bindschadler, 1997). This correction worked well on the ice-shelf area, BI and HTR. Over the rough topography of grounded ice along LC, the 5 km DEM was not sufficiently accurate and detailed to remove the topographic fringes. Our main interest being the ice-shelf area, surface topography in the LC scene was removed only on the ice-shelf area.
The along-track time delays determined from the ascending/descending-pass registration were also used to register existing measurements of the ice-shelf velocity (Reference VaughanVaughan and others, 1995) to the interferograms (see figs 2 and 3 where these velocities arc plotted in both the ascending and descending passes). The existing velocity data provided a basis for evaluating the precision of interferometrically derived horizontal ice-shelf velocities once the tidal signal was eliminated using one of the methods described in the following sections of this paper.
Results
A difficult challenge of this study was the qualitative interpretation of the fringe patterns for both H1R and LC. (Fringe patterns are the graphical representation of an interferogram, as shown in figures 4 and 5.) As is readily appreciated from the interferograms (figs 4 and 5.) see also Reference Hartl, Thiel, Wu and DoakeHartl and others, 1994; K.-H. Thiel and others, unpublished information, 1996), fringe patterns caused by the combination of creep-flow and tidal displacements, and subject to the effects of SAR “look geometry “, can seem incomprehensible. Even considering that the cyclic color (or gray-scale) change in the fringe pattern represents a “contour map" of ice-shelf displacement in a particular, albeit awkward, direction (i.e. the satellite range direction), it is difficult to comprehend the kinematics of the ice shelf from a typical interferogram.
Our interpretation of the interferograms was achieved by a heuristic process that combined manipulation of the interferogram data and creation of artificial interferograms using a finite-element model of ice-shelf creep. The modelling work is presented in companion papers (Hulbe and others, in press; Reference MacAyealMacAyeal and others, 1998). Modelling of the creep flow and generation of artificial interferograms from model results for comparison with the real interferograms proved to be helpful in guiding us toward a better understanding of the fringe patterns. However, all the interpretations presented here, in retrospect, can be supported by reference to the interferograms alone. The results and conclusions presented here, therefore, are not contingent on the accuracy or applicability of assumptions made as part of the modelling work.
Separation of tidal flexure and creep flow
As mentioned above, the ice-shelf displacement measured by SAR interferometry is due to the combined effects of ocean tide and creep flow. To differentiate between these two effects, we exploit the fact that tidal displacement and creep flow have two widely different time-scales. Displacement associated with tides is periodic, with periods considerably less than the time-span between two SAR scans needed to construct interferograms. Displacement associated with creep flow monotonically increases through time, and has a time-scale that is essentially infinite when compared to that of the tides. These differences between tidal displacement and creep flow allow their effects to be separately identified using an interferogram differencing technique (i.e. differential interferometry).
Differential interferometry, i.e. taking the difference between two interferograms of the same scene and in the same orbital geometry, was first illustrated for glaciology applications by Reference Hartl, Thiel, Wu and DoakeHartl and others (1994), and may be used to separate the creep-flow motion of the ice shelf from the tidal motion. In two interferograms spanning the same temporal baseline, the deformation signal associated with creep flow will be the same [creep deformation is presumed steady and continuous in time). A differential interferogram produced from these two interferograms will therefore contain no creep-deformation signal but only a tide signal measuring a differential tidal displacement between four different epochs (or three epochs mixed together if only three serial images are used to form the two interferograms).
Two examples of differential interferograms showing tidal motion are shown in figures 6 and 7 for the HIR and LC scene. Within the interior of the ice shelf, the amplitude and spatial variability of tidal motion is consistent with the large-scale patterns of tidal amplitude and phase predicted for diurnal and semi-diurnal tides by Robertson and others (in press; see also Reference Smithson, Robinson and FlatherSmithson and others, 1996). Along coasts, however, there are narrow boundary layers approximately 5 km wide where the ice shelf deforms more precipitously to accommodate the zero tidal range of the grounded ice. The extent of this zone is determined by the flexural rigidity of the ice, which is a function of ice temperature, fabric and thickness (Reference HoldsworthHoldsworth, 1977). The limit of tidal flexing of the ice shelf defines the hinge line (Reference HoldsworthHoldsworth, 1969). The grounding line, where the ice detaches from its bed and becomes afloat, typically occurs downstream from the hinge line.
Two additional features are important to notice in the differential interferograms displayed in figures 6 and 7. One is that the fringe pattern associated with tidal motion is simpler than that displayed in each single interferogram (figs 4 and 5). There are fewer regions exhibiting rapid increases in fringe spacing. A second feature is that tidal displacement varies from one differential interferogram to another, and the variation is not linear (i.e. one differential interferogram is not simply an amplified or attenuated version of the other).
Separating creep flow from the tidal signal is conversely more difficult because SAR interferometry only measures differences in tidal displacement of the ice shelf between different epochs, and not the absolute tidal displacement of the ice shelf at a given epoch. Several methods are possible to circumvent this problem. The simplest is to ignore the tidal signal. In the case where the time-span between satellite passes coincides with a dominant period of the tide (semi-diurnal or diurnal), the differential tidal signal should indeed be small compared to the horizontal creep motion of the ice shelf. We believe this was the case for at least one interferogram acquired for HIR (orbits 3028 and 2985). In most cases, however, the tidal signal will introduce a significant error in the horizontal ice velocity which varies with position on the ice shelf.


A second method is to combine several interferograms to synthesize an interferogram with a longer temporal baseline than that provided by any single interferogram. For instance, the addition of four ascending passes acquired along HIR allows synthesis of a new interferogram with a 9 day temporal baseline (instead of the nominal 3days). Over this longer baseline, the interferometric signature of the tidal motion will remain more or less the same, while the creep motion of the ice shelf will generate phase variations 3 times larger than in a 3 day interferogram. The technique therefore reduces tidal contamination by a quantity proportional to the increase in temporal baseline.
The inconvenience of this second method is that it requires a large number of interferograms to effectively reduce tidal contamination. Assuming a tidal signal 1 m in magnitude, and an ice-shelf velocity of 1000 m a−1, which means l m d−1 in the radar line of sight, at least four scenes separated by 3 days are needed to reduce the tidal signal by a factor 10. A reduction factor of 100 would require 10 scenes. There are few places in Antarctica where ERS can provide that many scenes.
A third method is to assume that the ice-shelf tidal displacement in a single interferogram is a linearly scaled version of the displacement map measured from differential interferometry. This technique was utilized to map ice velocities on the floating section of Petermann Glelscher in north Greenland (Reference RignotRignot, 1996). The same technique was utilized here. The tidal motion measured from a differential interferogram was normalized and the values were reintroduced into a single interferogram using a proper scale factor chosen to eliminate the tidal signal. The scale factor was determined in the least-squares sense so that interferometrically derived ice velocities from the single interferogram would match prior-determined ice velocities, i.e. from ground survey or feature tracking methods. The control velocities we used were obtained from feature tracking on Landsat MSS imagery (Reference VaughanVaughan and others, 1995) and are displayed in figures 2 and 3.
To compare the performance of the three methods described above, we used the prior-determined ice-shelf velocity data to predict the creep-flow contribution of the unwrapped phase at particular pixels of the interferograms. These were then compared with the unwrapped phase of the actual interferograms. For each interferogram, we computed an artificial phase corresponding to each point of known velocity using

where

and where λ is the radar wavelength (5.6 cm), v is the creep velocity magnitude, △t is the temporal baseline of the interferograms to which the artificial phase is compared, ψ· is the angle between the ice-velocity vector and the cross-track direction, Θ; is the local incidence angle of the radar illumination (about 23°), b is the satellite track angle from true north, and a is the angle of the ice-velocity vector from north.
The comparison between the methods for separating tide from creep-flow signals is summarized in Table 2, comparing the first, second and third approaches for HIR, and the first and third for LC. The best results are obtained using the third approach. The resulting estimates of creep flow are on average within 1-2 fringes of the actual creep flow observed by independent means, which is probably within the error level of the control velocities used to perform the comparison. In terms of ice velocity, the rms error is 75 m a −1 on average, or 15% of the mean velocity of the ice shelf in the two study areas. Examples of interferograms corrected for tide using the third method are shown in Figures 6, 7 and 12.

There are reasons to believe that this third method provides only a first-order removal of tidal effects, which could probably be summarized to the average tidal amplitude over the whole scene and the pattern of tidal bending at the junction between ice shelf and grounded ice. As displayed in the interferometric examples of tide (figs 6 and 7), and as predicted by tidal models (Robertson and others, in press), the tidal deformation regime of a large ice shelf is considerably more complex than entertained through our simple linear model. Despite this limitation, the tidal correction applied to the data was subsequently found to be sufficiently accurate for the study undertaken here, which is to qualitatively explain the patterns of interferometric fringes and obtain first-order agreement between a forward finite-element model simulation of ice-shelf flow and the interferometrically derived creep-flow velocities (Hulbe and others, in press; Reference MacAyealMacAyeal and others, 1998). In other words, the results and conclusions of this study would not be changed if tides were removed more accurately by some other means.
To achieve a higher level of precision in creep-flow velocity, somewhat comparable to that achievable on grounded ice, we would have to take into account the vibrational character of the ice shelf. This type of work is the subject of ongoing research.
Analysis of fringe patterns
figures 4 and 5 display examples of single interferograms made of the HIR and LC study areas using both ascending-and descending-pass SAR images. In Figures 8-12, sub-scenes of the interferograms are shown to better illustrate the interpretation of various fringe patterns. Interferograms of HIR (Fig. 4) and LC (Fig. 5) show similar fringe patterns.
The main difference between the two sites is that the zone of ice-shelf rupture in the LC scene develops along the coast, specifically in the wake of Dodson Peninsula, rather than in the wake of an ice rise.
Discontinuity of fringe sparing across rifts
Rifts and chasms, which penetrate the ice shelf from surface to base, are typically associated with “branch-cut" discontinuities in the fringe pattern. (A branch cut is a type of discontinuity commonly encountered in complex analysis where a field is continuous in all regions except across a line which extends semi-infinitely from a single point.) In Figure 8, we show one such branch-cut discontinuity encountered at a rift that extends west from the downstream end of HIR. The tip of the rift, where the rift terminates within the integrated, undisturbed ice shelf, represents the origin of the branch cut. The eastward extension of the rift represents the line across which fringe spacing is discontinuous. On the downstream side of the rift, fringe spacing is wider than on the upstream side of the rift. The ice shelf on the downstream side of the rift is less influenced by the drag induced by HIR. It thus exhibits less velocity reduction toward the east. The fringe spacing on the downstream side of the rift is thus wider, indicating less shear in the flow, The rate at which the rift widens is associated with the strength of the fringe-line discontinuity across the rift.
Fringe patterns within rifts
West of HIR. the fringe spacing varies abruptly at the transition between adjacent rift zones. Interferometric fringes are still visible in the voids filled by what appears to be a melange of multi-year sea ice, ice-shelf fragments and windblown snow. We term this material “ice melange" to draw attention to its variable composition. The highly textured and bright radar return from this region is indeed inconsistent with the presence of open water. Landsat imagery also indicates the presence of an ice mixture in that region, not open water (Reference Hartl, Thiel, Wu and DoakeHartl and others, 1994).
The fringe pattern covering the ice melange appears to be spatially continuous, as illustrated in Figure 9. Fringes recorded in the melange located close to the ice front are less distorted than those recorded in the melange filling rifts close to HIR. The rifts found close to the ice front are presumably older than those in the wake of HIR, because most rifts seem to initiate along the flanks of HIR and subsequently grow in width and extent as they move seaward with the ice-shelf flow.


The distinct fringe patterns within rifts imply that ice melange has sufficient mechanical competence lo deform in response to differential motion on either side of the rift. This suggests that rifts, some of which ultimately become detachment boundaries for tabular icebergs, can be filled with a material that can bind the two sides of the rift together and that can temporarily halt tabular-iceberg detachment.
The character of fringe patterns within ice melange appears to evolve with the presumed age of the rift within which the melange is located. Fringe patterns in the immediate wake of HIR, where rifts are presumably young, are chaotic, and this suggests that the ice melange in young rifts is thin, mechanically weak and subject to spatially discontinuous deformation. Fringe patterns toward the ice front, where rifts are presumably older, are more continuous than in the immediate wake of HIR, and this suggests that the ice melange in old rifts is strong.
To account for the eventual calving of ice-shelf fragments, we suggest that ice melange which fills rifts may eventually weaken as the rifts propagate toward the ice front where basal melting becomes a significant source of mass loss (Reference ThyssenThyssen, 1988}. Basal melting of a few m a -1 should exceed the natural growth rate of sea ice due to heat losses into the atmosphere, reduce its thickness and weaken its mechanical competence. Ultimately, basal melting (and surface melting where possible) will nearly eliminate the ice melange and turn the rifts into detachment boundaries which liberate tabular icebergs.
Interestingly, however, our inteferograms do not reveal distorted or chaotic fringes within rifts close to the ice front, as would be expected if ice melange were weakening there. This result suggests either that our observations were made well in advance of the next major calving event, in which case the thickness and mechanical integrity of ice melange has not yet been affected by the ice-front conditions, or that processes other than basal melting of ice melange are important in the final separation and release of tabular icebergs from the ice shelf. Tidal waves, for one, probably have an influence on the stability and mechanical integrity of the rifts and on the ice melange when they get trapped underneath the ice shelf proper in the ice-front region.
Rigid-body rotation
The clearest evidence for the mechanical integrity of ice melange is visible in the fringe patterns downstream of HIR (Fig. 10) where large tabular ice-shelf fragments are induced into a state of rigid-body rotation by stresses transmitted through the melange that surrounds the fragments.

Rignot and MacAyeal: Ice-shelf dynamics near front of FRIS
Rigid-body rotation about an axis that is perpendicular to the horizontal plane is signified in fringe patterns by uniformly spaced fringe lines that are aligned with the radar range direction or, equivalently, that are perpendicular to the satellite flight direction (Reference Peltzer, Hudnut and FeiglPeltzer and others, 1994).
The relationship between fringe-line geometry and rigid-body rotation within the horizontal plane is illustrated in Figure 10. Let us consider an ice-shelf fragment in the horizontal, x-y plane that rotates rigidly about a vertical axis at the origin with angular speed Ω. We suppose that the y axis is aligned with the ground-range direction. The velocity,  , of ice motion at any distance r from the origin is

where  is the angular velocity vector, which points along the axis of rotation, perpendicular to the horizontal plane, and
 is the position vector, as shown in Figure 12. The SAR interferogram is sensitive only to the component of motion in the y direction. The y component of , v, is determined by the angle θ between the x axis and the vector .

Substituting Equation (3) into Equation (4), and making use of the definition x = r cos θ, gives

Fringe lines are therefore contours of motion in the range direction. Equation (5) implies that fringe lines associated with rigid-body rotation are aligned with the y axis and have a uniform spacing that depends only on Ω (i.e. ∂e/∂x = Ω).
As shown in Figure 11, ice-shelf fragments downstream of H1R exhibit uniformly spaced fringe lines that are parallel to the range direction. This pattern is consistent between interferograms representing motion over different time intervals and suggests that the rigid-body rotation is caused by the velocity difference between ice-shelf flow west of H1R and the stagnant boundary of BI. In other words, the fragments are being rolled along the boundary of BI by faster-moving ice shelf that borders them on the west. The regular fringe patterns do not appear in differential interferograms showing tidal motion (figs 6 and 7).This result confirms that the rigid-body rotation is due to motions induced by creep flow and is not a transient phenomenon associated, for instance, with tidal-current drag beneath the ice shelf.
For some fragments, most notably those closest to HIR in Figure 11, the rotation is clearly driven by coupling with fast-moving ice west of HIR. The fast-moving ice induces motion in the ice melange, which consequently drags the western ends of the fragments seaward. The eastern ends of the fragments are retarded by contact (either direct or through ice-melange-filled rifts) with slower-moving ice shelf (or BI) to the east. The net effect is to spin the fragments developing on both sides of HIR in a clockwise manner.
For one ice fragment shown in Figure 11, there is an ambiguity as to whether the rigid-body rotation is driven by ice melange, or driven by vorticity of the shear margin along BI (i.e. du/dy — dv/dx where U and v are the x and y components of velocity in the χ-y plane). In the absence of ice mélange, i.e. open water, vorticity in the shear margin would be transmitted to the ice-shelf fragment across the narrow ice bridge designated in Figure 11. The stiffness of the ice in the ice-shelf fragment would ensure that the vorticity would remain uniform within the fragment at the value equal to the vorticity at the ice bridge. Uniform voracity is equivalent to rigid-body rotation.

By counting fringes across an ice raft exhibiting the characteristics of a rigid block rotation about a vertical axis, we can obtain a direct measure of the angular velocity of the ice raft, i.e. Ω, even if limited to a single viewing angle of the satellite. In the HIR scenes, Ω is 2-3° a−1 or 0.010 d−1. The interferograms are therefore sensitive indicators of rigid block rotation. If Ω exceeded the above values by a factor 2 or 3 we would in fact be unable to resolve individual fringes on the ice raft, which would then appear uncorrelated because of phase aliasing.
On the radar scenes collected along LC (figs 3 and 5), rigid-body rotation of ice rafts is also apparent. The size of ice rafts along LC is considerably smaller than along HIR, and this suggests that ice melange in the LC scene does not bind large ice rafts within the general flow of the ice shelf as effectively as does the melange in the HIR scene. We suggest that this difference may be attributed to different mean climate conditions between LC and HIR. Further discussion of the comparison between HIR and LC is presented in a companion paper (Hulbe and others, in press).
Shear layers
Figure 12 displays the shear zones on either side of HIR (see upper right panel of Figure 12 where tidal flexure effects have been removed from the interferogram, as discussed previously). The magnitude of shear strain rates signified by fringe spacing west of HIR changes conspicuously at a distance of about 5 km from the ice-rise boundary where flow is zero. This width is comparable to that inferred from velocity measurements collected along Crary Ice Rise (Reference Bindschadler, Vornbergcr, Stephenson, Roberts and MacAyealBindschadler and others, 1988; Reference BindschadlerBindschadler, 1993), but about twice as wide as that suggested by the bright, crevassed zone indicated in the radar amplitude data (see Fig. 2).
The small width of shear layers along HIR suggests that the ice shelf is more easily deformed in a boundary layer which surrounds HIR. Softening in boundary layers along the margin of fast-moving ice is observed elsewhere, such as along the margin of Ice Stream B (Reference Echelmeyer, Harrison, Larsen and MitchellEchelmeyer and others, 1994). Several processes could contribute to modification of the rheological properties at the margins of HIR. First, the ice rise is small. It would be less able to slow the surrounding ice shelf than would a larger ice rise like BI, or Roosevelt Island and Crary Ice Rise on the Ross Ice Shelf. Faster flow past the sides of the small ice rise would undoubtedly produce surface and basal crevassing and associated infiltration of seawater, both of which would have a softening effect on the ice shelf. Second, large strain rates would contribute to strain heating and ice-fabric development. The residence time of ice within the boundary layer along HIR is on the order of 50 years. This would be sufficient to allow strain-heating rates similar in magnitude to the 10−3 W m−3 magnitude calculated for Ice Stream B, where velocity magnitudes are similar to those of the HIR flow regime. That amount of

Rignot and MacAyeal: Ice-shelf dynamics near front of FRIS
heating would warm the ice by several degrees (e.g. Reference Echelmeyer, Harrison, Larsen and MitchellEchelmeyer and others, 1994). Third, constant cyclical tidal flexure along the boundary would allow additional strain heating, crevassing and brine infiltration. The tidal flexure zone along HIR (e.g. the area of high fringe-line density surrounding HIR shown in Figure 12, lower right panel) appears to correspond to the zone of highest strain rates in the creep flow (e.g. Fig. 12, upper right panel). This correspondence adds further support to the notion that cyclic tidal flexure has an influence on the rheological properties that govern ice-shelf creep How.
CONCLUSIONS
Our interferograms suggest that ice-shelf rifling, a long-term process that culminates in tabular iceberg release, is strongly influenced by sea ice and other types of ice, which fill the rift. Indeed, deformation of sea ice within the rifts suggests that the sea ice binds together large tabular ice-shelf fragments. The eventual detachment of these fragments as icebergs thus appears to be determined in part by the dynamics of the melange which fills rifts.
Interferometry of Antarctic ice shelves provides a highly detailed picture of ice flow and tidal deformation and has revealed important aspects of ice-shelf behavior that were previously unknown. The most striking aspect of ice-shelf behavior revealed by the interferograms of the FRIS studied here concerns the development of ice-shelf rifts, which eventually become tabular iceberg detachment boundaries. The ice-shelf rifts presumably develop as a result of the presence of an ice rise (HIR) or due to coastal roughness (LC). The interferograms of the HIR area, in particular, reveal that the voids within rifts are filled with ice, which we call ice melange (a mixture of sea ice, ice-shelf fragments and wind-blown snow which gives a cluttered SAR amplitude image). Creep flow in the ice shelf is discontinuous across rifts; however, much of the discontinuity is accommodated by deformation of the ice melange within the rifts. This suggests that ice melange possesses a mechanical integrity and is capable of supporting a spatially continuous velocity field. What the specific rheological properties of the ice melange may be (e.g. the strength in shear and tension) remains to be determined through further study. Nevertheless, the fact that ice melange fills rifts and is capable of continuously deforming leads us to speculate that melting of the ice melange may be a means by which the occanic and atmospheric environments can control the location of Antarctica’s ice-shelf calving fronts. A key argument in support of this speculation is the fact that our interferograms reveal that large ice-shelf fragments that, in the absence of the surrounding ice melange, would be tabular icebergs, are literally rolled along the stagnant margin of BI as a result of motion transmitted through the melange from faster-flowing ice shelf to the west.
While the presence of ice melange within rifts has been observed using aerial photographs and Landsat images, the mechanical competence of the melange, and the role it may play as a binding agent in heavily fractured ice shelf, is revealed for the first time by SAR interferometry. This opens the door to speculation about iceberg calving styles and the significance of the collapse of the Wordie Ice Shelf (Reference Doake and VaughanDoake and Vaughan, 1991) or recent events on the Larsen Ice Shelf (e.g. Reference VaughanVaughan and Doake, 1996).
Spatial gradients in oceanic and atmospheric temperature could determine where ice melange melts or disintegrates, thus influencing where tabular ice-shelf fragments will detach from the ice shelf. Enhanced melting and weakening of ice melange from climate warming could trigger a more widespread and sudden release of tabular icebergs. Ice rafts bound together in the wake of HIR, for instance, may detach rapidly as a result of ice melange weakening. Rifts would then propagate upstream of the ice rise. Instead of protecting the ice shelf by creating a zone of flow compression upstream of the ice rise, the ice rise would start acting as an indenting wedge that would help fracture the ice shelf. This kind of ice-shelf fracturing was observed in the region surrounding Buffer Ice Rise on the floating tongue of Fleming Glacier during the collapse of the Wordie Ice Shelf (Reference Doake and VaughanDoake and Vaughan, 1991).
The Larsen Ice Shelf similarly lost a large fraction of its area in two nearly simultaneous calving events in 1995, possibly as a result of its northern location on the Antarctic Peninsula, where climate has warmed over the past 50 years (Nature, 1995; Reference VaughanVaughan and Doake, 1996). Each event displayed a distinct calving style. In the first style, approximately 25% of Larsen B between Jason Peninsula and Robertson Island calved as a single tabular iceberg. The detachment of this large tabular iceberg is thought to represent the “normal" (though episodic) style of calving expected in steady-state conditions (Reference Jacobs, MacAyeal and ArdaiJacobs and others, 1986; personal communication from C. L. Hulbe, 1997). Coincident with that calving event, a second style of calving was displayed. Approximately 1500 km2 of the Larsen Ice Shelf (Larsen A) north of Seal Nunataks disintegrated into hundreds of small, non-tabular pieces.
The suddenness of the second style of calving displayed by Larsen A in 1995 may also implicate the melting of ice melange. The sudden break-up of 1500 km2 of ice shelf into hundreds of small fragments is difficult to explain without a pre-existing network of fractures that would have acted as separation boundaries. Ice-melange filling may have held the fragments together until weakening by an unusually warm summer (suggested by the large number of melt ponds observed on Larsen A prior to break-up) allowed the ice melange to fail in a large storm. The interferograms of the FRIS demonstrate the mechanical importance of ice melange to rift stability near the ice front, and allow us to speculate that ice-melange failure as a result of environmental conditions was possibly one of the factors in the break-up of Larsen A. If our speculation is correct, then ice melange which holds the FRIS together near its calving margin may be a possible weak link in ice-shelf stability which has heretofore not been considered.
Acknowledgements
This work was performed at the Jet Propulsion Laboratory, California Institute of Technology, under a contract with the National Aeronautics and Space Administration (NASA). Support for the University of Chicago component of this project was provided by NASA (NAGW-5005). The ERS data needed for this research were provided by the ESA (ERS-1/2 project code: AO2.USA.160). We thank C. Werner for providing a SAR processor to generate the SAR interferograms, A. Gabriel for help in the project’s inception, C. Hulbe for her assistance in revising the manu-script and for her advice in the development of speculations concerning the calving style of Larson A, J. Bamber for providing a digital topographic map of Antarctica assembled from radar altimetry data, and D. Vaughan, C. Doake, R. Frolich, R. Hindmarsh and other colleagues at the British Antarctic Survey for providing ice-thickness data for the FRIS and for contributing many suggestions during the course of the research reported here.



