I. INTRODUCTION
Over the past decade, thermoelectric devices have been deeply studied as new no-waste energy sources.Reference Bell1 Thermoelectric devices allow the direct transformation of a heat source into an electrical current (Seebeck effect), and vice versa (Peltier effect), without using mechanical moving parts. By this way, thermoelectric devices are high durability systems for cooling/heating capacity. These devices can be used for promising applications such as the recycling into electricity of the large lost heat energy produced by automobile, manufactories, or incinerators. The performance of a thermoelectric material is determined by the value of the dimensionless figure of merit, ZT = S 2T/ρλ, where S is the Seebeck coefficient or thermopower, ρ the electrical resistivity, and λ the thermal conductivity. The ratio S 2/ρ corresponds to the power factor (PF). Present research efforts are focused on developing new materials with high figure of merit preferably close to 1 or higher.
In this context, oxides are being explored as suitable materials for thermoelectric applications at high temperature in air due to the high chemical stability at elevated operational temperatures. These materials have the additional advantage to be generally composed of nontoxic elements, contrary to certain conventional intermetallic compositions used in actual thermoelectric devices. Recently, we have shown that Ge-doped In2O3 bulk ceramics exhibit a great potential as n-type elements.Reference Bérardan, Guilmeau, Maignan and Raveau2 It was observed that the electrical conductivity of In2O3 is increased by one order of magnitude by Ge doping (0.5 at.%) and changes from a semiconducting to a semimetallic behavior, whereas a high n-type thermopower value is obtained at high temperature. It was also shown that the presence of secondary phases In2Ge2O7 promotes a decrease in the total thermal conductivity. However, the increasing amount of these secondary phases, organized as large crown-like agglomerates, induces an increase in the porosity. The correlation between the microstructure and the thermoelectric properties is then quite complex and requires the design of homogeneous and dense composite microstructures.
For that purpose, soft chemistry techniques allow a high interdispersion of metal ions and significantly improve the homogeneity in structural and elemental composition of the powders. Soft chemistry techniques also allow to control the size, the morphology of particles, and to realize materials with extremely low doping rate. The obtained nanopowders have a high reactivity and lead usually to a reduction of the sintering temperature.Reference Lakeman and Payne3 By using different soft chemistry process such as coprecipitation, hydrothermal synthesis or sol-gel techniques, a variety of In2O3 nanoparticles with different structural and shape properties have been already produced.Reference Xu, Cheng, Pan, Xu, Xiang, Yu and Chu4–Reference Neri, Bonavita, Micali, Rizzo, Pinna and Niederberger6 Among these different techniques, the citrate gel process is a suitable technique for the synthesis of nanopowders, which exhibit a high structural homogeneity.Reference Marcilly, Courty and Delmon7 In the citrate gel process, the citric acid complexes metal salts in solution by its carboxyl groups COOH. This leads to the formation of stable metal complex, and by hindering the ions mobility and segregation, the different ions are well distributed at the atomic scale in a polymer network. By heating this polymer network, an amorphous precursor material is synthesized, and by increasing the thermal treatment (between 500 and 900 °C), the respective metal oxide is obtained.Reference Ananthakumar, Anas, Ambily and Mangalaraja8
We have then studied the preparation and the thermoelectric properties of Ge-doped indium oxide ceramics prepared by the citrate gel process. The variation of the Seebeck coefficient, the electrical and thermal properties with temperature, and Ge content will be discussed and compared with those of In2−xGexO3 ceramics prepared by conventional solid state chemistry.
II. EXPERIMENTAL
Indium nitrate [In(NO3)2, 5H2O (99.99%, Alfa Aesar, Karlsruhe, Germany)], hexagonal germanium oxide GeO2, and citric acid C6H8O7 (Reactpur 100%) are used as starting materials. The preparation of the hexagonal germanium oxide is made by the precipitation of germanium chloride (GeCl4, 99.9999%, Alfa Aesar) in deionized water. This leads to the formation of germanium hydroxide Ge(OH)2, which is then evaporated for obtaining the hexagonal GeO2 being soluble in water. In2−xGexO3 powders were prepared by mixing stoichiometric amount (2−x:x:1) of the starting materials in deionized water under stirring. This solution is transferred into an alumina crucible and then heated up to 300 °C on hot plate for several hours to remove excess water. During this thermal treatment, a brown transparent colored gel is formed and then decomposed by self-combustion to a white foam powder. The dried precursor gel was then calcinated at 600 °C for 1 h with a heating rate of 100 °C/h.
Calcined powders mixed with polyvinyl alcohol binder were uniaxially pressed under 300 MPa. The polyvinyl alcohol is necessary for maintaining the shape of the green bulks after pressing. Parallelepiped 2 × 3 × 12 mm3 and cylindrical Ø20 × 4 samples were prepared. These samples were then sintered on platinum foils in an alumina crucible at 1300 °C for 48 h. This thermal treatment was used for a direct comparison with In2−xGexO3 realized by using solid state reaction.Reference Bérardan, Guilmeau, Maignan and Raveau2 The use of platinum foils is necessary for avoiding any contamination from the alumina crucible during sintering. The sintered pellets were then cut in square shape of 8 × 8 mm2 to determine the thermal diffusivity.
Thermogravimetry and differential thermal analysis (TG/DTA) were carried out on a Netzsch Pegasus system (Netzsch, Selb, Germany). X-ray diffraction patterns (XRD) of the prepared In2−xGexO3 powders were collected on a Philips X’Pert Pro diffractometer with X’Celerator (Philips, Almelo, Netherlands) using CuKα radiation in a 2θ range 10–90°. Rietveld refinement analysis (FullProf software)Reference Rodríguez-Carvajal9 were performed for the analysis of the XRD patterns. Particle size distribution was carried out by laser granulometry (Malvern Mastersizer 2000, Malvern, Orsay, France). Scanning electron microscopy (SEM) was performed on a FEG Zeiss Supra 55 (Carl Zeiss, Oberkochen, Germany). For this purpose, samples were polished until obtaining a mirror-like surface, and grain boundaries were then revealed by thermal etching at 1200 °C during 5 min. The measurements of the electrical resistivity and Seebeck coefficient were performed under partial helium pressure by using an ULVAC-ZEM3 device (Ulvac, Yokohama, Japan) from 300 to 1000 K. The thermal conductivity was determined by the product of the geometrical density, the heat capacity (Netzsch DSC 404C Pegasus), and the thermal diffusivity (Netzsch LFA457 MicroFlash). Hall effect experiments were performed as reported elsewhere.Reference Guilmeau, Bérardan, Simon, Maignan, Raveau, Ovono and Delorme10
III. RESULTS AND DISCUSSION
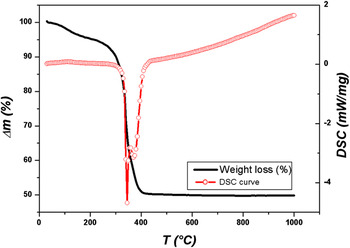
Figure 1 shows the TG/DTA curves of the dried precursor after gel decomposition. A small weight loss (around 7%) is observed in the temperature range 100–200 °C indicating water evaporation. The second significant weight loss (about 40%) appears from 225 °C to around 400 °C with two endothermic peaks at 345 and 370 °C, in agreement with the results reported by Rey et al.Reference Rey, Plivelic, Rocha, Tadokoro, Torriani and Muccillo11 It can be attributed to the decomposition of organic materials. Above 400 °C, the weight remains constant and no more endothermic or exothermic peaks are observed, which indicates that the crystallization of the indium oxide phase is achieved after a thermal treatment above 400 °C.
Thermogravimetry and differential thermal analysis curves of the indium gel decomposition.

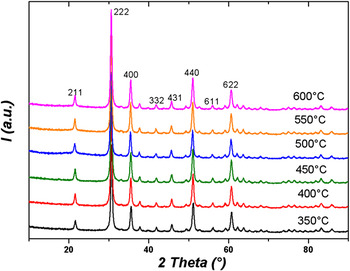
To investigate the changes in the average crystallites size of In2O3 particles resulting from the thermal decomposition of the dried precursor gel for temperatures higher than 400 °C, XRD measurements were carried out on different batches of indium oxide powders calcined at different temperatures between 350 and 600 °C for 1 h (Fig. 2). All diffraction patterns can be indexed with In2O3 Bragg reflectionsReference Marezio12 and show no secondary phases or impurities. The width of peak at the half of the peak intensity does not show any variation with increasing temperature and indicates that the average size of crystallites is stable whatever the calcination temperature is. An average size of 20 nm has been determined by Rietveld refinement and Scherrer formula approximation.Reference Rodríguez-Carvajal9 The calcination temperature was then fixed to 600 °C during 1 h for all compositions to avoid any remaining organic traces, which can prevent the densification of samples during sintering.
X-ray diffraction (XRD) patterns of In2O3 powders calcined between 350 and 600 °C for 1 h.

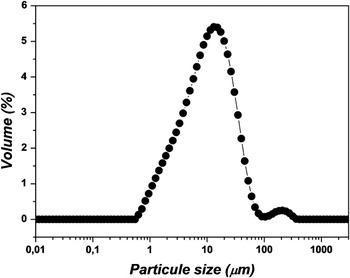
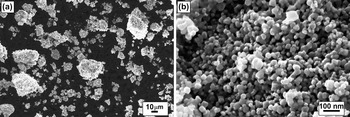
The Fig. 3 shows the particle size distribution of indium oxide powder after calcination. The apparent size distribution is broad (from 1 to 100 μm) with a maximum volume fraction centered on 10 μm which indicates an agglomeration of indium oxide nanoparticles. Micrometric agglomerates of In2O3 nanograins can be also observed on SEM micrographs in Figs. 4(a) and 4(b).
Particle size distribution of In2O3 powder calcined at 600 °C during 1 h.

Scanning electron microscopy (SEM) micrographs of In2O3 powder synthesized by citrate gel process and calcined at 600 °C during 1 h, for different magnifications (a and b).

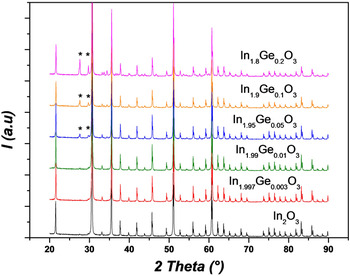
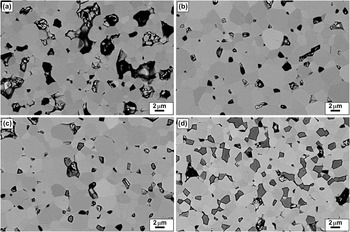
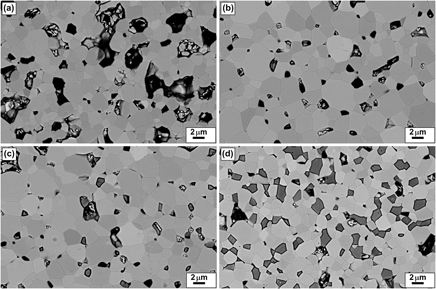
The XRD patterns of the sintered compounds with different Ge amounts are shown in Fig. 5. For Ge content higher than x = 0.01, several peaks corresponding to the In2Ge2O7 phase are observed. This small Ge solubility limit in the In2O3 matrix was recently observed in In2−xGexO3 samples obtained by solid state reaction.Reference Bérardan, Guilmeau, Maignan and Raveau2, Reference Guilmeau, Bérardan, Simon, Maignan, Raveau, Ovono and Delorme10 The SEM micrographs of the different sintered samples are shown in Fig. 6. From x = 0 to x = 0.01, the porosity decreases (see Table I) and a slight grain growth is observed. Above the Ge solubility limit (x = 0.01), secondary phases appear and inner grain grows by diffusion scattering at grain boundaries. It must been noted that, contrary to In2−xGexO3 samples prepared by solid state reaction, their distribution in the matrix is well homogeneous without any large empty sphere shapes.2
XRD patterns of sintered In2−xGexO3 ceramics (the symbols * indicate the presence of In2Ge2O7 phases).

SEM micrographs of sintered In2−xGexO3 ceramics. The nominal compositions are: (a) In2O3, (b) In1.99Ge0.01O3, (c) In1.95Ge0.05O3, and (d) In1.8Ge0.2O3. In2Ge2O7 inclusions correspond to dark gray grains.

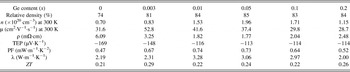
Geometrical density, carrier concentration (n), electrical resistivity (ρ), Hall mobility (μ), Seebeck coefficient (TEP), power factor (PF), thermal conductivity (λ), and ZT values in the In2−xGexO3 series at 1000 K.

On the other hand, samples prepared by citrate gel process exhibit lower densification as compared with solid state reaction prepared samples. This is probably linked to the presence of agglomerates in the nanopowders prepared by the citrate gel process (as shown before). These results also suggest that the Ge for In substitution promotes an increase in the geometrical density of samples until the solubility limit. The geometrical density increases from 74% for x = 0 to 84% for x = 0.01. For higher Ge doping rate and contrary to In2−xGexO3 samples prepared by solid state reaction, the geometrical density does not change and reaches about 84% of the theoretical density. It can be directly linked to the well dispersion of secondary phases in the matrix, as observed by SEM, and the absence of empty sphere secondary phases.
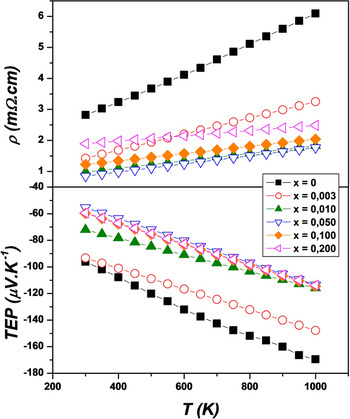
The temperature dependence of the electrical resistivity (Fig. 7) shows a linear increase characteristic to metal-like behavior. The electrical resistivity strongly decreases with increasing Ge content up to x = 0.01 (see for example at 1000 K in Table I). This drastic decrease is caused both by the increase in the geometrical density and in the carrier concentration (Table I). Above the solubility limit, the electrical resistivity increases due to the presence of In2Ge2O7 insulating secondary phases. Concerning the carrier concentration of undoped In2O3, we can notice that this value (n = 0.70 × 1020 cm−3) is higher than those reported in literature for In2O3 prepared by solid state reaction (n = 0.11 × 1020 cm−3).Reference Guilmeau, Bérardan, Simon, Maignan, Raveau, Ovono and Delorme10 The use of the citrate gel process promotes a high reactivity of nanopowders and probably increases the presence of oxygen vacancies as additional donors.
Temperature dependence of the electrical resistivity and Seebeck coefficient (thermopower) of In2−xGexO3 ceramics prepared by the citrate gel process.

The Hall mobility measured for the different samples (Table I) presents a maximum value for x = 0.003 (μ = 52.8 cm2·V−1·s−1). For x ≥ 0.003, the Hall mobility decreases according to the increase in the carrier concentration until the solubility limit. This behavior is in agreement with results recently published for doped In2O3 bulks and thin films.Reference Guilmeau, Bérardan, Simon, Maignan, Raveau, Ovono and Delorme10, Reference van Hest, Dabney, Perkins, Ginley and Taylor13 In a similar way with Sn/Ti/Zr-doped In2O3 compositions, the maximum Hall mobility for In2−xGexO3 ceramics is obtained for low doping level (x = 0.003). Moreover, for a given x value, we observe a difference in the mobility for the Ge/Sn/Ti/Zr-doped In2O3 compositions. This difference may be linked to the influence of the difference of electronegativity and/or ionic radius of the doping metals on the interaction between substitutional ionized Mz+ and electrons, and therefore the scattering rates. For higher substitution rate, the presence of ionized impurity scattering coupled with the increase in the carrier concentration promotes electron–electron scattering and leads to the decrease in the Hall mobility.
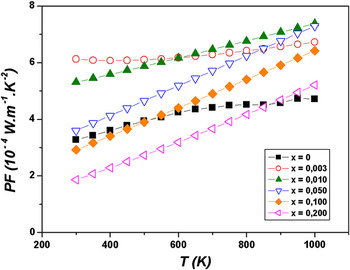
As shown in Fig. 7, the Seebeck coefficient has a negative value which indicates that the majority carriers are electrons. The absolute value of the Seebeck coefficient strongly decreases with the addition of germanium until the solubility limit (Table I). Above this limit of substitution and despite the presence of the In2Ge2O7 secondary phases, the |S| does not change due to the fact that the thermopower is mainly linked to the matrix composition.Reference Bergman and Levy14 In Fig. 8, the temperature dependence of the PF is shown. For x = 0 to x = 0.01, the PF increases, respectively, from 0.47 to 0.74 mW·m−1·K−2 at 1000 K (Table I). At higher doping rates, the PF tends to decrease due to the increase in the electrical resistivity.
Temperature dependence of the power factor in the series with nominal compositions In2−xGexO3.

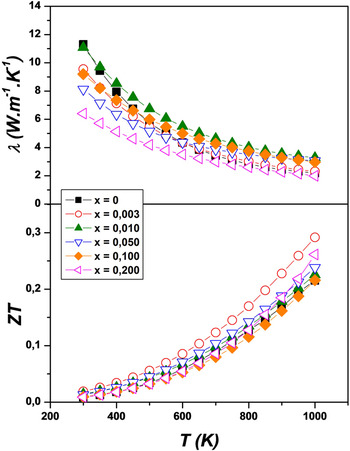
The temperature dependence of the thermal conductivity λ is shown in Fig. 9. For all samples, a decrease in the thermal conductivity with temperature is observed. According to the decrease in the electrical resistivity, the thermal conductivity is increasing with Ge doping level until the solubility limit, starting from 2.19 W·m−1·K−1 for x = 0 to 3.28 W·m−1·K−1 for x = 0.01 at 1000 K (Table I). Above the solubility limit, the thermal conductivity drastically decreases with Ge content and counterbalances the decrease in the PF. The calculated dimensionless figure of merit increases from 0.21 for In2O3 to 0.29 for In1.997Ge0.003O3 and then remains almost stable up to x = 0.2. In contrary to In2−xGexO3 processed by solid state chemistry,Reference Bérardan, Guilmeau, Maignan and Raveau2 the density remains constant above the solubility limit, thanks to the initial high interdispersion of metal ions, homogeneity in elemental composition of the nanopowders, and well dispersion of In2Ge2O7 secondary phases. It can consequently access the comparison between thermal conductivity values measured on the different samples. The origin of the decrease in the thermal conductivity with high Ge doping level can be linked to the appearance of insulating In2Ge2O7 secondary phases. It remains now to understand the origin of this effect, especially if any nanoscale effects due to the presence of defects or nanoinclusions can also exist and play any role in the transport properties of doped In2O3.
Temperature dependence of the thermal conductivity and dimensionless figure of merit (ZT) in the series with nominal compositions In2−xGexO3.

IV. CONCLUSION
The citrate gel process appears as a very suitable technique for the synthesis of Ge-doped indium oxide powders with nanosized grains. Although the germanium solubility limit is very small, the electrical resistivity of bulk sintered compounds is strongly decreased by doping, leading to high PFs, close to 1 mW·m−1·K−2 around 1000 K. Moreover, further Ge additions confirm the benefit role of well-dispersed In2Ge2O7 phases for decreasing the overall thermal conductivity. The dimensionless figure of merit value is increased up to 0.3 at 1000 K, thanks to electron doping and phonon scattering.