

INTRODUCTION
Delirium is common, occurring in approximately one in five general hospital inpatients (Siddiqi et al., Reference Siddiqi, House and Holmes2006), with higher rates in the elderly, those with prior cognitive deficits (Katz et al., Reference Katz, Curyto and TenHave2001; Smith et al., Reference Smith, Fuchs and Pandharipande2009; Franco et al., Reference Franco, Valencia and Bernal2010), and those receiving intensive (Ely et al., Reference Ely, Shintani and Truman2004) and palliative care treatment (Breitbart & Alici, Reference Breitbart and Alici2008; Irwin et al., Reference Irwin, Rao and Bower2008; Barnes et al., Reference Barnes, Kite and Kumar2010). Delirium is a significant independent predictor of poor outcomes, including elevated morbidity and mortality (MacLullich et al., Reference MacLullich, Beaglehole and Hall2009; Kiely et al., Reference Kiely, Marcantonio and Inouye2009; Breitbart & Alici, Reference Breitbart and Alici2012).
Delirium is a state of impaired consciousness affecting all higher cortical functions and implicates neural network information processing abnormalities despite intact brainstem function (Schiff & Plum, Reference Schiff and Plum2000). The position of the thalamus as the gateway between brainstem and cerebral cortex and its dysfunction measured by generalized slowing on the EEG implicate the thalamus in disruption of neural networks required for attention and other functions (Trzepacz, Reference Trzepacz1994; Trzepacz et al., Reference Trzepacz, Mulsant and Dew1998; Trzepacz, Reference Trzepacz1999; Gaudreau et al., Reference Gaudreau, Gagnon and Harel2005; Boettger et al., Reference Boettger, Passik and Breitbart2009; Reference Boettger, Passik and Breitbart2011). Delirium is an alteration of consciousness on a continuum with normal at one end and stupor and coma at the other; these latter conditions exhibit loss of consciousness and complete failure of arousal without an intact sleep–wake cycle. Emergence from coma usually includes a period of delirium until normal consciousness occurs. A minimally conscious state is characterized by partial preservation of consciousness with an intact sleep–wake cycle, and can progress to delirium in patients who recover. Delirium is distinguished from coma by its intact, though abnormal, cognition and sleep–wake cycle and less severe degree of EEG slowing, consistent with poorly gated neurotransmission from the brainstem to support normal cortical functions. Delirium is distinguished from other psychiatric disorders (e.g., catatonia, retarded depression) by its breadth of symptoms reflecting serious dysfunction of multiple brain regions and circuits supported by EEG slowing. Whether all delirium symptoms persist together throughout an episode — and therefore the impaired state of consciousness — is inadequately studied.
In addition, delirium comprises disturbances of cognition, impaired higher-order thinking, and a range of neuropsychiatric symptoms that include altered sleep–wake cycle and motor activity patterns, and psychosis, where attentional deficits are cardinal (Meagher & Trzepacz, Reference Meagher, Trzepacz and Geddes2009). Cross-sectional phenotype work from our and several other research teams supports the existence of three core domains of symptoms, which may inform the underlying neuropathogenesis as being both cortical and diencephalic — attention/other cognition, circadian (sleep–wake cycle and motor activity), and higher-level thinking (semantic language, thought process, and executive function) (Meagher et al., Reference Meagher, Moran and Raju2007; Meagher & Trzepacz, Reference Meagher, Trzepacz and Geddes2009; Franco et al., Reference Franco, Trzepacz and Mejia2009; Kean et al., Reference Kean, Trzepacz and Murray2010; Jabbar et al., Reference Jabbar, Leonard and Meehan2011; Mattoo et al., Reference Mattoo, Grover and Chakravarty2012). Surprisingly few longitudinal studies have been reported, and we lack an understanding of how cognitive and noncognitive elements relate to each other over time. Previous work has found great heterogeneity in the temporal duration of delirium (Rudberg et al., Reference Rudberg, Pompei and Foreman1997; Fann et al., Reference Fann, Alfano and Burington2005; Sylvestre et al., Reference Sylvestre, McCusker and Cole2006). Detailed study of the course of individual symptoms can clarify whether delirium symptoms follow a similar trajectory over time or if different elements follow separate courses, perhaps reflecting varying underlying pathophysiological processes. Moreover, identifying symptoms that are more stable and reliably present over the course of an episode should improve detection and diagnosis.
The present study is a longitudinal study of consecutive patients developing delirium in a palliative care setting who underwent detailed serial phenomenological assessments over the course of their episodes of delirium with the aims to identify: (1) which symptoms are most consistent in their frequency and severity during the course of episodes, (2) the pattern of symptom fluctuation during an episode, including the estimation of the rate of change, and (3) how the three core domains evolve over time.
METHODS
Subjects and Design
One hundred consecutive patients at a palliative care inpatient service at Milford Care Hospice with DSM-IV (APA, 1994) delirium were recruited. Patients were not included if they were imminently dying or where their circumstances were too difficult to allow assessment (as per the opinion of the treating medical team), which resulted in exclusion of approximately 10% of potential recruits. The presence of DSM-IV criteria were ascertained by the liaison psychiatry team. All patients were screened with the Confusion Assessment Method algorithm (CAM) (Inouye et al., Reference Inouye, van Dyck and Alessi1990) within 24 hours of admission by the medical team, who were trained in the use of the CAM to supplement routine case finding for delirium. Assessment of cognitive items was provided by an objective instrument, the Short Orientation Memory Concentration Test (Katzman et al., Reference Katzman, Brown and Fuld1983).
Scales/Measurements
Revised Delirium Rating Scale (DRS-R98)
The DRS-R98 is the most widely used instrument to measure symptom severity in delirium and is useful as a diagnostic and a severity assessment tool (Trzepacz et al., Reference Trzepacz, Mittal and Torres2001). It is a 16-item clinician-rated scale with 13 severity items and 3 diagnostic items (temporal onset of symptoms, fluctuation of symptoms, physical disorder) and is a valid measure of delirium severity over a broad range of symptoms. The 13-item severity section can be scored separately from the 3-item diagnostic section; their sum constitutes the total scale score. The severity of individual items is rated from 0 to 3 points. Thus, DRS-R98 severity scale scores range from 0 to 39, with higher scores indicating more severe delirium and a cutoff score of >15 consistent with a diagnosis of delirium. The total scale can be scored initially to enhance differential diagnosis by capturing characteristic features of delirium, such as acute onset and fluctuation of symptom severity (maximum score 46). All items are anchored by text descriptions as guides for rating along a continuum from normal to severely impaired. It has high interrater reliability, validity, sensitivity, and specificity for distinguishing delirium from mixed neuropsychiatric populations, including dementia, depression, and schizophrenia.
Cognitive Test for Delirium (CTD)
This is a relatively brief (15–20 minutes) test of neuropsychological function that emphasizes visual abilities and is suitable for assessing a broad range of patients, including those who are intubated or cannot speak (Hart et al., Reference Hart, Levenson and Sessler1996). It was originally developed for use in severely ill ICU patients. The subject's responses to all items are nonverbal (pointing, nodding head, raising hand). It allows the assessment of five neuropsychological domains (orientation, attention, memory, comprehension, vigilance) and generates a score between 0 and 30, with higher scores indicating better cognitive function. An optimal cutoff score to discriminate delirium from other disorders is 19; however, it can be used as a continuous, unidimensional measure of cognition in delirium. It reliably distinguishes delirium from dementia, schizophrenia, and depression.
Delirium Etiology Checklist (DEC)
This checklist is employed to categorize all sources of clinical information, including laboratory results, about different body areas that are abnormal so as to standardize the multifactorial assessment of delirium etiology (Meagher & Trzepacz, Reference Meagher, Trzepacz and Geddes2009). Twelve categories are then rated for their degree of potential likelihood as contributing etiologies for the delirium. Each etiological category is rated on a 5-point scale ranging from ruled out (0), present but apparently not contributory (1), present and possibly contributory (2), likely cause (3), or definite cause (4), and it allows for multiple concomitant causes as contributing etiologies for delirium. We analyzed categories rated as either 3 or 4.
Procedures
Demographics, estimated duration of delirium at referral, and psychotropic drug exposure at the time of assessment were documented for each patient. Dementia due to various causes was defined as the presence of persistent cognitive impairment for at least six months prior to the assessment and per DSM-IV criteria based on all available information at the time of initial assessment, including clinical case notes and collateral history from family and/or carers. Those patients who had DSM-IV delirium were assessed twice weekly. At the time of assessment, each patient's medical and nursing charts were reviewed to obtain information regarding sleep, motor disturbances, and possible psychotic experiences. Collateral information was obtained, as recommended by the DRS-R98 training manual, from nursing and medical staff in addition to relatives in order to score particular items. All sources of information from these sources were used to rate items. The initial assessment was labeled time 1 (t1), with subsequent assessments similarly noted. Assessments were conducted by research psychiatrists trained in the use of the DRS-R98 and CTD (DM or ML), and, to further enhance reliability, difficult ratings were discussed and rated by consensus between both raters.
Informed Consent
The procedures and rationale for the study were explained to all patients, but because the majority had an index episode of delirium at entry, most were not capable of giving informed consent. Because of the noninvasive nature of our study, the Limerick Regional Ethics Committee approved patient verbal assent augmented by proxy consent from next of kin (where possible) or a responsible caregiver. This is in accordance with best practices as outlined in the Helsinki guidelines for medical research involving human subjects (World Medical Association, 2004).
Statistical Analyses
Data analysis was conducted utilizing SPSS (IBM), version 19. Continuous variables for demographic and rating scale scores were expressed as means and standard deviations (SD). The summary statistics of variation related to all data recorded, but due to the small numbers involved in the final three assessments (t7–t9), all other analyses (including the mixed-effects model) were based on data recorded inclusive of assessments up to and including the sixth assessment (t6), for a total of 311 visits.
A linear mixed-effects model was utilized to investigate the rate of the mean change in delirium symptoms over the course of the episode and the contribution of each symptom to the total DRS-98R severity score over time. It is an attractive statistical test for analysis of longitudinal data (Hedeker & Gibbons, Reference Hedeker and Gibbons2006), including patients with delirium (Adamis, Reference Adamis2009), because it provides valid estimates even if the longitudinal data are imbalanced, such as if the number of assessments for each patient differs or the time interval between assessments varies. Furthermore, mixed-effects models handle missing data without introducing bias with the only assumption that missing data are missing at random, thus allowing use of all datapoints for all patients in the analysis. Little's MCAR test indicated that there was no systematic pattern of missing values in the dataset [χ2 = 119.5; df = 219; p = 1.0].
RESULTS
Demographic and Clinical Characteristics
Patients' mean age was 70.2 ± 10.5 years (range 36–90), 49% were female, and 27% had dementia. Though a total of 323 assessments (range 2–9) took place, only 311 (the first 6 visits) are reported here due to the small numbers at later visits, where n = 100 at t1 and t2,, n = 57 at t3, n = 27 at t4, n = 16 at t5, n = 11 patients at t6,n = 7 at t7, and n ≤ 4 for t8 and t9. Reasons for discontinuing assessments were death (n = 55), recovery (n = 30), declined (n = 12), and discharged (n = 3).
Mean DRS-R98 total score was 20.2 ± 5.9 and mean CTD score was 13.8 ± 8.0 over 311 assessments. Mean number of etiological categories per patient was 2.7 ± 1.5 (range 1–7) during the entire course of their episodes, where the most common were metabolic or endocrine disturbance (62%), systemic infection (55%), and drug intoxication (41%). A category determined to be likely related to delirium was counted only once per patient per episode even if it persisted over more than one assessment. Mean age for those with comorbid dementia was 72.9 ± 8.2 and for those with “pure” delirium 68.8 ± 11.2. There was no statistical difference between those patients with comorbid dementia (n = 27) and those with “pure” delirium (n = 73) for age (t test, t = −1.60, df = 98, p = 0.113), sex (χ2 test, χ2 = 0.307, df = 1, p = 0.58), mean number of assessments (t test, t = −0.811, df = 98, p = 0.42) or etiological scores (t test, t = −0.607, df = 98, p = 0.545).
Medication use was considerable — all identified cases were receiving medications (mean number of medications = 10.3 ± 3.2 per case over all assessments; range 2–20). The use of psychoactive medications over the course of episodes was as follows: 87% received opioids, 76% antipsychotics, 72% benzodiazepines, 54% corticosteroids, and 1% psychostimulants.
Delirium Phenomenology
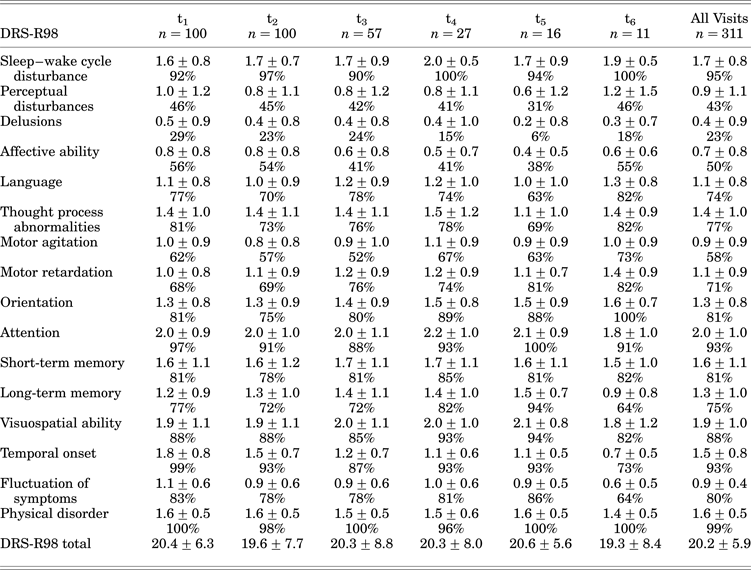
Frequency (%) and severity (mean ± SD) of individual delirium symptoms as rated on the DRS-R98 are shown in Table 1 for each assessment. The most common and consistent DRS-R98 symptoms present (at any severity) over time were: inattention (88–100%), sleep–wake cycle disturbance (90–100%), and any motor disturbance (87–100%), while delusions and hallucinations occurred least frequently (both <50% at all assessments). Next most frequent were language/thought process abnormalities and other cognitive domains. The visual pattern of DRS-R98 severity item mean scores graphed over six timepoints during delirium shows remarkable consistency during the episodes (Figure 1, radar graph).
Mean DRS-R98 severity scale item scores at each assessment.

DRS-R98 severity (mean ± SD) and frequency (%) (symptom present at any severity) of delirium symptoms at each assessment time (t) and for all assessments aggregated
According to the DRS-R98 item for symptom fluctuation, 80% of patients experienced some degree of symptom fluctuation over time. More specifically, when considered over all six assessments, symptom fluctuation was rated as being over minutes in 15% and over hours in 65% of all assessments. Of note, 20% did not have recognizable symptom fluctuation over the assessment period.
Patients with so-called “pure” delirium were compared with those with comorbid delirium and dementia in terms of severity as calculated with the DRS-R98 over the full course of the delirium episode. This did not indicate any statistically significant differences (t test, t = 0.74, df = 306, p = 0.94).
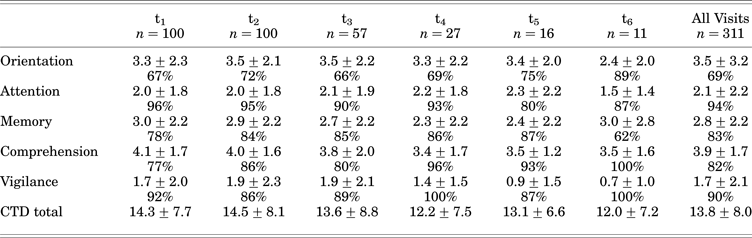
The mean severity and frequency scores for the five CTD domains (Table 2) reflect the findings obtained with the DRS-R98 where attention and vigilance were most affected. Additionally, when graphed over time (Fig. 2), cognitive domains showed quite consistent trajectories, with attention and vigilance the most severely and consistently impaired over time.
Mean scores for the Cognitive Test for Delirium (CTD): five domains at each assessment time.
Cognitive Test for Delirium (CTD) score severity (mean ± SD) and frequency (%) of those with neuropsychological impairment (any score <6) in each domain at each assessment
We also examined the longitudinal patterns for the three core domains using the DRS-R98 severity scale items. Item values were summed and averaged to represent these domains as follows: #9 through 13 for cognitive; #1, 7, and 8 for circadian; and #5 and 6 for higher-level thinking (Fig. 3). The mean core domains showed a consistent trajectory over time.
Comparison of DRS-R98 mean scores for symptom domains (see text for definitions) over assessments t1–t6.
Linear Mixed Effect Model
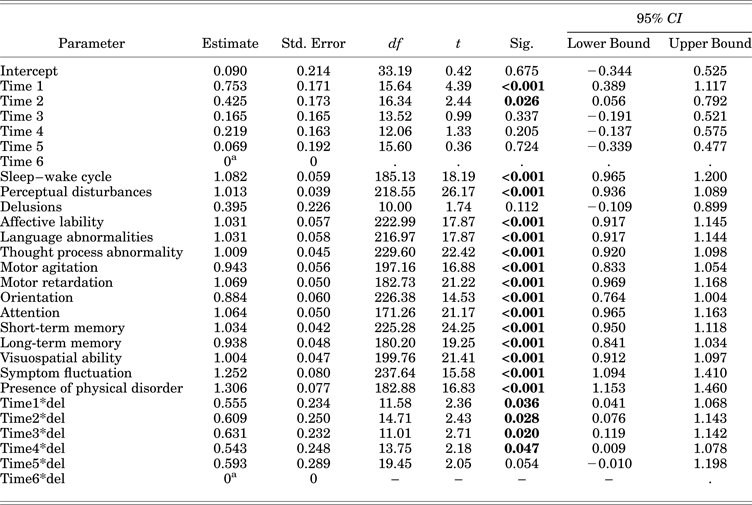
To investigate the change in each individual symptom of the DRS-R98 and the significant contribution of each symptom to total DRS-R98 scores across time, a linear mixed-effects model was constructed. In the initial model, subjects were used as a random effect, time as a repeated variable, and each individual symptom and the interaction of each symptom by time as covariates, while time again was used as a factor variable. The fitted model makes the assumptions that the pattern of change over time is linear and that the correlation matrix is heterogeneous first-order autoregressive. These two assumptions were tested by examining the residuals for normal distribution and using the Akaike Information Criterion (AIC) as indicative of the best-fitting model under different correlation matrix assumptions. The validity of these assumptions was adequate for the data. The initial full model had an AIC equal to 822.18. By sequentially removing individual items from the model that were nonsignificant and on each occasion examining the resulting AIC (lower AIC indicating better fit), the most parsimonious model was identified (presented in Table 3). This final model has an AIC of 635.57 with residuals of normal distribution (Kolmogorov–Smirnov test, Z = 1.030, p = 0.239). As can be seen from this table, all individual symptoms were relatively stable across time (i.e., their interaction with time did not have significant effects and thus were dropped from the final model), with the exception of delusions that contributed significantly across time. This suggests that the severity of individual DRS-R98 items is relatively stable for individual patients when measured over sustained timeframes (three days). Similarly, time was a significant factor only for the first two assessments (one week), indicating that DRS-R98 scores were not significantly altered beyond this point. However, all symptoms significantly contributed to DRS-R98 scores across time. Temporal onset of symptoms item was not included because it is only logical to rate it at the first assessment with the score carried forward for subsequent ratings on the DRS-R98 total scale.
Final mixed-effects model with the parameter estimates
a This parameter is set at zero because it is redundant. Bold type = significant results (p < 0.05).
DISCUSSION
This longitudinal observational study of delirium involved detailed phenomenological assessments using validated tools specific to delirium. Previous serial assessment studies have explored symptoms in the delirium prodrome (Matsushima et al., Reference Matsushima, Nakajima and Moriya1997; de Jonghe et al., Reference de Jonghe, Kalisvaart and Dijkstra2007) as well as the phenomenological expression of delirium using the Delirium Rating Scale (DRS) (Trzepacz et al., Reference Trzepacz, Baker and Greenhouse1988), the Memorial Delirium Assessment Scale (MDAS) (Breitbart et al., Reference Breitbart, Rosenfeld and Roth1997), or the Delirium Index (Rudberg et al., Reference Rudberg, Pompei and Foreman1997; Fann et al., Reference Fann, Alfano and Burington2005; Sylvestre et al., Reference Sylvestre, McCusker and Cole2006; McCusker et al., Reference McCusker, Cole and Bellavance1998; Sherer et al., Reference Sherer, Yablon and Nakase-Richardson2009), which, in contrast to the DRS-R98, allow for assessment of only a relatively small range of symptoms and limited neuropsychological assessment. Using a variety of analytic approaches, including mixed-effects modeling, we found remarkable temporal consistency for severity and stability for a broad range of delirium cognitive and noncognitive symptoms throughout episodes. The relative consistency of symptom profile over more sustained periods of delirium assessment indicates consistent widespread disturbance of neural processes over the course of an episode.
Our findings are consistent with delirium representing an altered state of consciousness that impairs neural processing for all higher cerebral cortical and some subcortical functions (circadian) with an aroused cortex (i.e., not coma) and that the breadth and severity of these symptoms persist throughout the entire time a person is delirious. This consistency was measured despite 80% experiencing more rapid (minutes to hours) fluctuations in the severity of some symptoms. The short-term fluctuation in symptoms may reflect the impact of factors such as circadian rhythms or even more fine fluctuations in neural network activity such as occurs in the default mode network (Greicius et al., Reference Greicius, Supekar and Menon2009). Delirium patients are clinically impaired when quietly resting as well as when cognitively activated by the environment.
Our work reconfirms delirium as a complex neuropsychiatric syndrome characterized by prominent inattention but with a range of cognitive and noncognitive disturbances (Fann et al., Reference Fann, Alfano and Burington2005). Our findings support the concept of delirium as a unitary syndrome with a relatively consistent symptom profile despite a variety of potential causes throughout the entire episode, where some etiologies improve and others newly occur. Most patients in our cohort experienced multiple etiologies, though there was a degree of similarity for types of etiologies across patients given that they were all in a palliative care setting, which also lent some homogeneity to the sample. Trzepacz, Meagher and Franco have proposed that three core domains underlie delirium, which could be clues to neuropathological processes. These are: Cognition, composed of inattention and other cognitive deficits; Higher Level Thinking, encompassing elements of impaired executive function, semantic expression, thought process, and comprehension; and Circadian Rhythm, including motor activity and sleep–wake cycle disturbances (Meagher & Trzepacz, Reference Meagher, Trzepacz and Geddes2009; Franco et al., Reference Franco, Trzepacz and Mejia2009). Along with recent factor analytic studies (Mattoo et al., Reference Mattoo, Grover and Chakravarty2012; Franco et al., Reference Franco, Trzepacz and Meagher2013), these results support our hypothesis by emphasizing the frequency and consistency of the three core domains over the course of a delirium episode. Previously noted (Meagher et al., Reference Meagher, Moran and Raju2007; Jabbar et al., Reference Jabbar, Leonard and Meehan2011) less consistent “associated” symptoms for affect and psychosis were found to be the most variable in our study — relatively speaking, with a background of not much variation — and may reflect pathophysiological influences of particular etiologies, such as neurochemical or neuroinflammatory, or preexisting individual genetic, neuronal, or physiological vulnerabilities. The underlying neural support for these domains is consistent with neuroanatomical findings in lesion and functional neuroimaging studies that implicate certain brain regions and neural circuitry (Trzepacz & Meagher, Reference Trzepacz, Meagher, Yudofsky and Hales2008). Our work provides further evidence that attention, higher-order thinking, and disturbances of the sleep–wake cycle and motor activity are core symptoms.
The temporal nature of delirium phenomenology has significant implications for delirium diagnosis and definition. Diagnostic criteria systems have recognized inattention as the cardinal feature of delirium, reaffirmed by this study, where attention and vigilance were disproportionately impaired, while also being highly consistent over serial assessment. The inherently fluctuating nature of delirium symptoms is a key factor that complicates reliable detection, and it is important that efforts to diagnose and monitor progress in delirium focus on symptoms that are particularly prominent and more consistent in expression over time. Given the growing body of literature supporting the three core domains, we recommend that future revisions of diagnostic classification systems (DSM-V and ICD-11) ensure inclusion of their constituent symptoms. Notably absent from DSM-IV are requirements for the presence of circadian and higher-order thinking disturbances, whereas these had some representation in DSM-III-R (APA, 1987). Disorganized thinking was deemphasized in DSM-IV due to difficulties with reliable identification by nonpsychiatrists (Trzepacz & Meagher, Reference Trzepacz, Meagher, Yudofsky and Hales2008). We recommend that psychotic symptoms and affective lability should not be relied upon for diagnosis, but rather considered as nonmandatory associated diagnostic features.
Limitations include that our study was conducted in a palliative care unit with a highly morbid group of patients, which may affect the generalizability of findings to delirium occurring in other settings. Assessments were conducted twice weekly rather than daily, and we therefore focused on identifying more sustained changes in symptom expression rather than the “micro-changes” known to occur over minutes to hours. The number of cases decreased substantially after the third visit. This needs to be taken into consideration when evaluating cases where episodes are more prolonged, though the mixed-effects model does in fact take it into account. In addition, the identification of comorbid dementia might be better achieved using a validated instrument for the same, such as the IQCODE (Jorm, Reference Jorm1994).
In conclusion, this work has identified how attention is disproportionately and consistently impaired throughout delirium episodes. In addition, individual delirium symptoms and the three core symptom domains also remain relatively stable despite small fluctuations in symptom severity during a given day, thus indicating a consistent state of impaired higher cortical functions throughout a delirium episode. These findings can assist efforts to improve delirium detection as well as help guide studies of pathophysiology and treatment, including whether effective interventions impact upon individual symptom domains or delirium as a unitary syndrome.