I. INTRODUCTION
Traditional alloys are designed, usually, based on one element as the principal component with several minor elements, e.g., steels are based on iron with C, Ni, Co, Mo, Ti, etc. as the minor elements. Nowadays, there is a new alloying-design strategy called high-entropy alloys (HEAs), which is also known as multiprincipal element alloys, complex concentrated alloys, compositionally complex alloys, baseless alloys, and metal buffets.Reference Yeh, Chen, Lin, Gan, Chin, Shun, Tsau and Chang1–Reference Gao, Yeh, Liaw and Zhang6 As proposed by Yeh,Reference Yeh, Chen, Lin, Gan, Chin, Shun, Tsau and Chang1,Reference Yeh7 HEAs could be defined from two different viewpoints. From the perspective of the compositions of alloys, HEAs are stated as the alloys, which have at least five principal elements, and the at.% of each element should be within 5–35%. Minor elements, if the HEAs have, usually possess atomic percentages less than 5%. The other definition, which is based on the configurational entropy, shows that HEAs are alloys whose configurational entropies are larger than 1.5R, where R is the ideal gas constant, in the random condition. In both of the two definitions, HEAs have single or multiple solid-solution structures as major phases, such as face-centered cubic (FCC), body-centered cubic (BCC), and hexagonal close-packed (HCP) phases. Some HEAs possess intermetallics as strengthening phases, such as L12Reference He, Wang, Huang, Xu, Chen, Wu, Liu, Nieh, An and Lu8 and B2Reference Wang, Ma, Jiang, Li, Shi, Dong and Liaw9–Reference Ma, Jiang, Li, Wang, Dong, Liaw, Xu and Sun11 phases. It is a brand-new research area on alloy design, which has gained growing attention all over the world.
One main reason for the great interest aroused by HEAs should be their great mechanical properties, such as hardness, compressive and tensile strengths, fatigue, and fracture toughness.Reference Sun, Wang, Zhang, Li and Ruan12–Reference Li, Li, Feng, Zhang, Sha, Lewandowski, Liaw and Zhang21 For hardness, the Al1.5FeCuCoNiCrTi HEA exhibits superior performance, which could reach 1100 HV.Reference Sun, Wang, Zhang, Li and Ruan12 AlCoCrFeNiMo0.5 HEAs possess the excellent compressive strength, whose yield strength, fracture strength, and plastic strain could be 2757 MPa, 3036 MPa, and 2.5%, respectively.Reference Zhu, Fu, Zhang, Wang, Li and Hu13 Regarding the tensile performance, the yield strength, fracture strength, and ductility of the Al11(CoCrFeMnNi)89 HEA are about 835 MPa, 1172 MPa, and 7%, respectively.Reference He, Liu, Wang, Wu, Liu, Nieh and Lu15 Gludovatz et al.Reference Gludovatz, Hohenwarter, Catoor, Chang, George and Ritchie16 found that the CrMnFeCoNi HEA possesses excellent toughness, exceeding 200 MPa m1/2, comparable to the best cryogenic steels, certain austenitic stainless steels, and high-Ni steels. HEAs also have promising fatigue properties, such as the Al0.5CoCrCuFeNi HEA,Reference Hemphill, Yuan, Wang, Yeh, Tsai, Chuang and Liaw17,Reference Tang, Yuan, Tsai, Yeh, Lundin and Liaw18 which could exceed some conventional alloys, such as 4340 steel, 1015 steel, Al 6061, Inconel 625 superalloy, and Ti–6Al–4V titanium alloys. A fatigue ratio [fatigue-endurance limit (based on the stress range)/ultimate tensile strength] is proposed by Hemphill et al.Reference Hemphill, Yuan, Wang, Yeh, Tsai, Chuang and Liaw17 to compare the fatigue performance of HEAs with that of other materials. They declared that the range of the fatigue-endurance limit of HEAs is from 540 to 945 MPa and the fatigue ratio mentioned above is between 0.402 and 0.703, which demonstrate that the fatigue properties of HEAs could compete with and be better than conventional alloys and metallic glasses.Reference Hemphill, Yuan, Wang, Yeh, Tsai, Chuang and Liaw17
Recently, there are research activities on the performance of HEAs under low temperatures (below room temperature), such as the CoCrFeMnNi HEA.Reference Gludovatz, Hohenwarter, Catoor, Chang, George and Ritchie16,Reference Laplanche, Gadaud, Horst, Otto, Eggeler and George22–Reference Zhang, Liaw and Zhang28 It is interesting to find that the CoCrFeMnNi HEA shows a great temperature dependence on its tensile yield strength below room temperature.Reference Gali and George26 What’s more important is that the tensile yield strength and ultimate strength, as well as the ductility, are dramatically increased as the temperature reduced from 293 to 77 K. These studies on the low-temperature properties of HEAs give us a new understanding in this area and may provide a great potential on the cryogenic applications of HEAs, such as cryogenic containers and outer space probes. In this case, even though there are several review papers on different aspects of HEAs,Reference Zhang, Zuo, Tang, Gao, Dahmen, Liaw and Lu3–Reference Diao, Feng, Dahmen and Liaw5,Reference Yeh7,Reference Tsai and Yeh29–Reference Praveen and Kim35 it is still necessary for us to have a review on the properties of HEAs at low temperatures since so far no review paper focusing on the low-temperature behaviors of HEAs has been done, and yet there is a great potential for the application of HEAs at cryogenic temperatures.
In this article, we summarized the mechanical behaviors and deformation mechanisms of HEAs at low temperatures. The review paper could enable people to have a comprehensive understanding of HEAs under cryogenic situations. This paper could be helpful to broaden the research area of HEAs and promote their applications in industries.
II. MECHANICAL BEHAVIORS OF HEAs AT LOW TEMPERATURES
A. Tension and compression
Qiao et al.Reference Qiao, Ma, Huang, Chuang, Liaw and Zhang36 first studied the compressive properties of the AlCoCrFeNi HEA at ambient and cryogenic conditions and published the results in 2011. They prepared the AlCoCrFeNi HEA with a BCC structure, using arc melting, and conducted the compression tests with the as-cast samples at the strain rate of 2 × 10⁻⁴ s−1, which are under both cryogenic and ambient temperatures. Then they found that the yield and fracture strengths at a low temperature, i.e., 77 K, are much higher than those at room temperature, i.e., 298 K, with just a little decrease of the fracture strain. The yield and fracture strengths and fracture strain of the AlCoCrFeNi HEA changed from 1450 MPa, 2960 MPa, and 15.5% at 298 K to 1880 MPa, 3550 MPa, and 14.3% at 77 K, respectively.Reference Qiao, Ma, Huang, Chuang, Liaw and Zhang36 They used the thermal-activated process to explain the increased strength at low temperatures, i.e., dislocations could overcome barriers with the help of the thermal energy, even though the stress is not high. The chance or possibility for the dislocation movement in this process, P, is described asReference Rösler, Harders and Baeker37
 $$P \propto \exp \left( { - {{Q - V{\tau ^*}} \over {kT}}} \right)\quad ,$$
where Q is the barrier energy, V is the activation volume, τ* is the effective stress, k is the Boltzmann’s constant, and T is the temperature. In this case, as the temperature decreases, the dislocations have the lower possibility to overcome the obstacles.
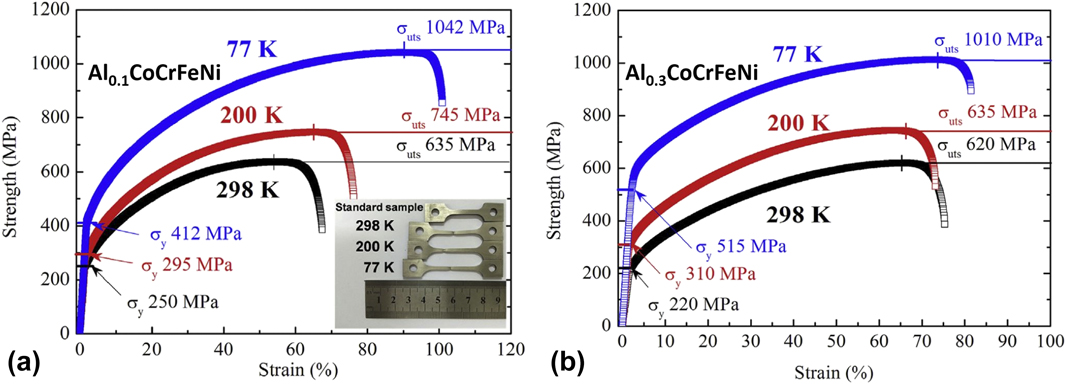
Based on the AlxCoCrFeNi HEA system, Li et al.Reference Li and Zhang38 fabricated and studied the Al0.1 and Al0.3 HEAs with an FCC structure at low temperatures. They prepared the Al0.1 and Al0.3 HEA samples using vacuum magnetic-levitation melting and a hot forging of 87% at 1323 K. For the Al0.1 HEA, as shown in Fig. 1(a),Reference Li and Zhang38 the tensile yield strength, ultimate strength, and ductility are increased from 250 MPa, 635 MPa, and 58.5% at 298 K to 412 MPa, 1042 MPa, and 81.6% at 77 K, respectively. In Fig. 1(b),Reference Li and Zhang38 the tensile yield strength, ultimate strength, and ductility of the Al0.3 HEA at 298 K are 220 MPa, 620 MPa, and 58.4%, respectively, while those at 77 K are 515 MPa, 1010 MPa, and 68%.
Tensile stress–strain curve of the (a) Al0.1 and (b) Al0.3 under 77 K, 200 K, and 298 K, respectively. Reprinted with permission from Ref. Reference Li and Zhang38.

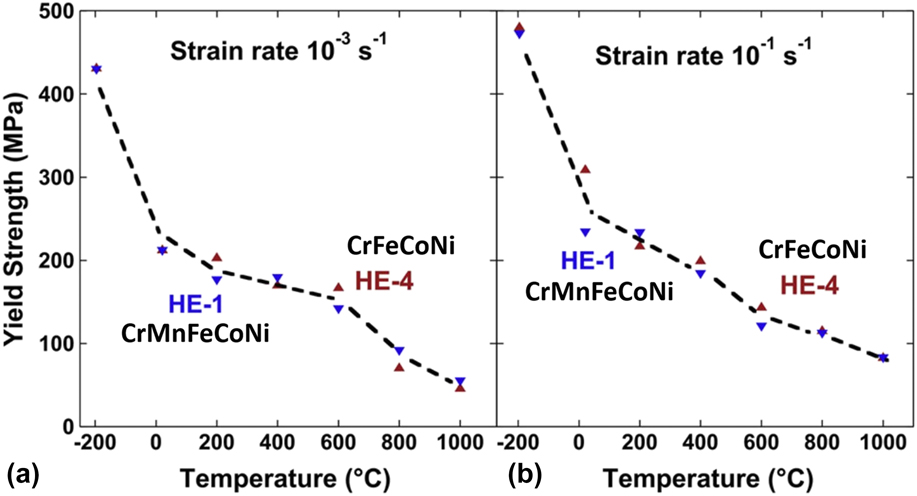
Gali et al.Reference Gali and George26 pointed out the strong temperature dependence in the range of 77–1273 K and weak strain-rate dependence of strength under the strain rates of 10−3 and 10−1 s−1. They synthesized the CrMnFeCoNi and CrFeCoNi HEAs by arc melting, annealing at 1273 K for 24 h, and hot rolling with a total reduction in the thickness of ∼92%. The tensile tests are performed at the strain rates of 10−3 and 10−1 s−1, respectively, and the temperature dependences of the yield strengths of the two HEAs are shown in Fig. 2.Reference Gali and George26 However, Li et al.Reference Li, Zhao, Diao, Liaw and Meyers27 reported an obvious strain-rate dependence in the Al0.3CoCrFeNi HEA (the grain size of ∼500 µm) with the strain rate varying form 10−4 to 1800 s−1. As presented in Figs. 3(a) and 3(b),Reference Li, Zhao, Diao, Liaw and Meyers27 the compressive true stress–strain curves and the corresponding strain-rate sensitivity, which is defined as  $\log {\sigma _{\rm{y}}}/\log \dot{\varepsilon }$ (σy is the yield stress and
 $\dot{\varepsilon }$ is the strain rate), are plotted, where the pure Al is used for comparison. As they stated, the strain-rate sensitivity is ∼0.053, which is about two times higher than that of the pure Al, i.e., ∼0.028.Reference Li, Zhao, Diao, Liaw and Meyers27 They also studied the thermal softening of the Al0.3CoCrFeNi HEA at a high strain rate of 1800 s−1, as plotted in Fig. 3(c). The thermal parameter, which is defined by dσy/dT (T is the absolute temperature), was confirmed to be ∼ −0.4 MPa/K in a temperature range of 173–353 K.Reference Li, Zhao, Diao, Liaw and Meyers27
Temperature dependences of yield strengths of the CrMnFeCoNi (HE-1) and CrFeCoNi (HE-4) HEAs at the strain rates of (a) 10−3 and (b) 10−1 s−1. Reprinted with permission from Ref. Reference Gali and George26.

(a) True stress–strain curves of the Al0.3CoCrFeNi HEA with different strain rates of 10−4 to 1800 s−1 and the pure Al with the strain rate of 10−2 s−1. (b) Yield stress versus  ${\rm{log}}\left( {\dot{\varepsilon }} \right)$ of the Al0.3CoCrFeNi HEA and pure Al. (c) Yield stress as a function of temperature from 173 to 353 K at the strain rate of 1800 s−1. Reprinted with permission from Ref. Reference Li, Zhao, Diao, Liaw and Meyers27 (Creative Commons Attribution 4.0 International License—https://creativecommons.org/licenses/by/4.0/legalcode).

The temperature dependences are strong at the low and high temperatures, while those are relatively small in the middle temperature range, and no truly athermal region can be observed even at 1273 K, as shown in Fig. 2.Reference Gali and George26 As Gali et al. mentioned in their paper,Reference Gali and George26 by contrast, it is not usually for the pure FCC metals to possess that kind of temperature dependences of yield strengths. For binary solid-solution alloys, the transition of thermal and athermal portions are mostly at low temperatures. Then, they come up with a thought that there are some strong obstacles in the HEAs, which need to be further investigated. Later, in 2015, Haglund et al.Reference Haglund, Koehler, Catoor, George and Keppens24 studied the temperature dependence of shear modulus in the CrMnCoFeNi HEA and found that the shear modulus of the HEA increased by only 8%, as the temperature is reduced from 300 to 55 K, which is smaller than that of the pure Ni, i.e., 12%. Thus, the temperature dependence of the strength for the HEA is not related to that of its shear modulus.Reference Haglund, Koehler, Catoor, George and Keppens24
To achieve a further understanding of the CoCrFeMnNi HEA, Laplanche et al.Reference Laplanche, Gadaud, Horst, Otto, Eggeler and George22 measured the temperature dependences of elastic modulus and thermal expansion from 200 to 1270 K, and the samples were fabricated by vacuum-induction melting, annealing at 1470 K for 48 h, swaging with a diameter reduction of 60%, and then heat-treating at 1170 K for 1 h. They determined that the HEA has no linear temperature dependence of the coefficient of thermal expansion, which is similar to that of FCC steels.Reference Laplanche, Gadaud, Horst, Otto, Eggeler and George22 The temperature dependence of the elastic modulus of the HEA showed a similar trend, compared to that of shear modulus.Reference Laplanche, Gadaud, Horst, Otto, Eggeler and George22 In this case, the strong temperature dependence of strength is not related to that of elastic modulus, neither to that of thermal expansion.
B. Toughness
HEAs possess the higher fracture toughness at cryogenic temperature than at room temperature, such as the CrMnFeCoNi HEA.Reference Gludovatz, Hohenwarter, Catoor, Chang, George and Ritchie16 Gludovatz et al.Reference Gludovatz, Hohenwarter, Catoor, Chang, George and Ritchie16 fabricated the CrMnFeCoNi HEA using arc melting, cold forging, and cross rolling at ambient temperature and studied the fracture toughness at cryogenic and room temperatures. At the temperature of 77 K, the fracture toughness is higher than 200 MPa m1/2 at cracking initiation and increases to more than 300 MPa m1/2 at stable crack growth.Reference Gludovatz, Hohenwarter, Catoor, Chang, George and Ritchie16 The equiatomic CrCoNi alloyReference Zhang, Sheng, Wang, Gludovatz, Zhang, George, Yu, Mao and Ritchie39 is reported to have a higher fracture toughness than the CrFeMnCoNi HEA, due to its high strength, remarkable ductility, and continuous work hardening, which mainly result from the conventional strengthening of the twin boundary and three dimensional (3D) twin network. The reason for the large number of twins in the CrCoNi alloy could be due to the low stacking fault energy (SFE), which is about 25% lower than that in the CrFeMnCoNi HEA.Reference Laplanche, Kostka, Reinhart, Hunfeld, Eggeler and George23
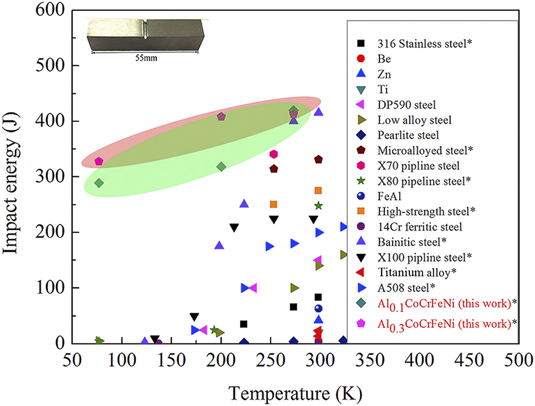
For impact toughness, the Al0.1CoCrFeNi and Al0.3CoCrFeNi HEAs studied by Li et al.Reference Li and Zhang38 have great performance. As shown in Fig. 4,Reference Li and Zhang38 the Charpy V-Notch impact energy of the Al0.1CoCrFeNi HEA is about 328 J at 77 K and increases to 413 J at 298 K. It can be seen obviously that the HEAs possess much better impact toughness than the conventional metals and alloys, especially at cryogenic temperatures. Xia et al. also investigated the impact toughness of the AlxCoCrFeNi HEA, and the samples were fabricated by vacuum-levitation melting. In their results, the Al0 and Al0.1 samples, i.e., the CoCrFeNi and Al0.1CoCrFeNi HEAs, exhibit excellent performance with the Charpy-impact energy of 398 J and 371 J at 77 K, respectively. They pointed out that the excessive addition of Al will lead to the precipitate of brittle BCC and B2 phases, which could reduce the impact toughness by more than two orders of magnitude, such as the Charpy-impact energy of Al0.75CoCrFeNi HEA is only 1.82 J.
Charpy V-notch energy of different metal materials under various temperatures. Reprinted with permission from Ref. Reference Li and Zhang38.

C. Fatigue
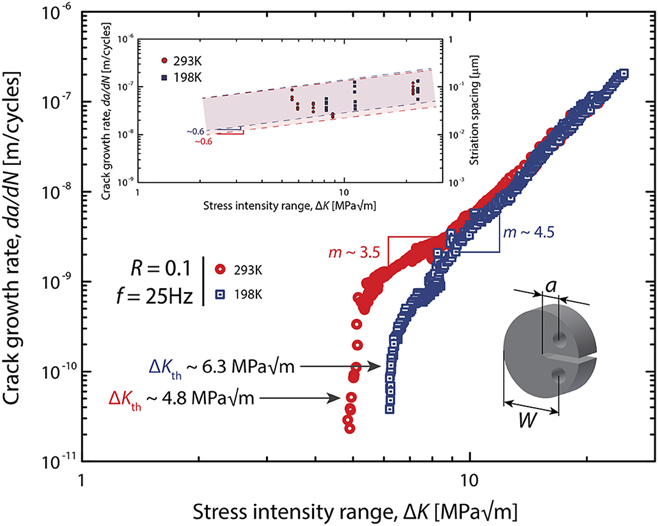
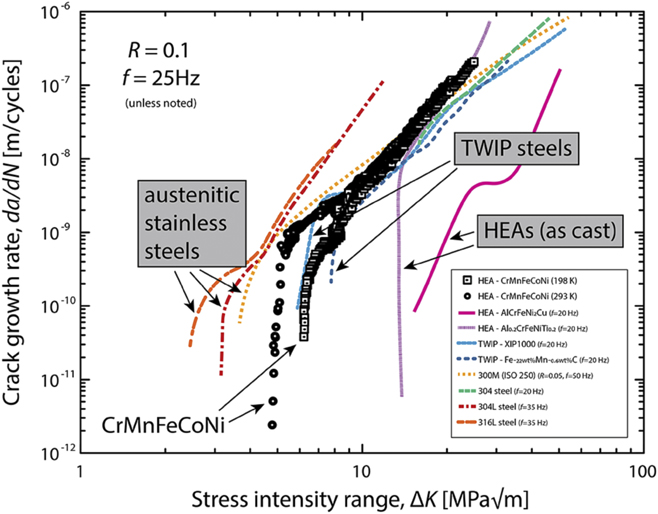
Thurston et al.Reference Thurston, Gludovatz, Hohenwarter, Laplanche, George and Ritchie40 investigated the fatigue-crack-growth behavior of the CrMnFeCoNi HEA under lower, near-threshold, growth rates at ambient and cryogenic temperatures, and the samples were synthesized by vacuum-induction melting, annealing at 1473 K for 48 h, swaging to reduce the diameter from 40 to ∼16.5 mm at ambient temperature, and recrystallizing at 1073 K for 1 h. In Fig. 5,Reference Thurston, Gludovatz, Hohenwarter, Laplanche, George and Ritchie40 the fatigue threshold (ΔK TH) is improved from ∼4.8 MPa m1/2 at 293 K to ∼6.3 MPa m1/2 at 198 K, increasing by ∼30% with lowering the temperature. As presented in Fig. 6,Reference Thurston, Gludovatz, Hohenwarter, Laplanche, George and Ritchie40 by the comparison of the fatigue-crack-growth behaviors of HEAs, austenitic steels, and twinning-induced plasticity (TWIP) steels, the HEAs exhibit better performance than others at both 198 and 293 K, especially the CrMnFeCoNi HEA, which displays a lower fatigue threshold than the Al-containing HEAs.
Under a load ratio (R = σmin/σmax, where σmin and σmax are the applied minimum and maximum stresses, respectively) of 0.1, the fatigue-crack-growth rate of the CrMnFeCoNi HEA at 198 and 293 K. Reprinted with permission from Ref. Reference Thurston, Gludovatz, Hohenwarter, Laplanche, George and Ritchie40.

Fatigue-crack-growth behavior of the HEAs, austentic stainless steels, and TWIP steels. Reprinted with permission from Ref. Reference Thurston, Gludovatz, Hohenwarter, Laplanche, George and Ritchie40.

III. DEFORMATION MECHANISMS
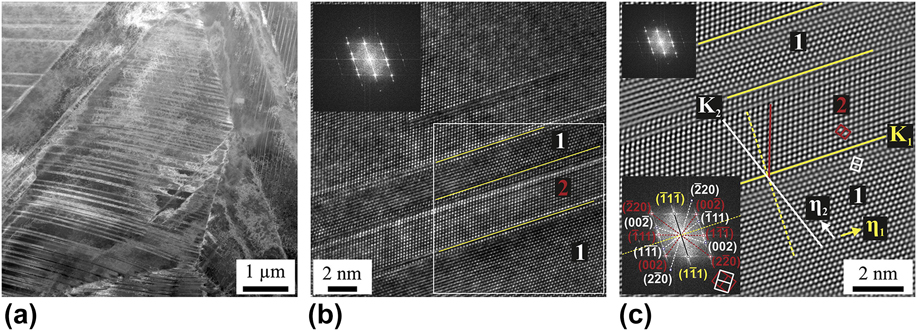
The deformation mechanisms of the CoCrFeMnNi HEA at cryogenic and ambient temperatures were studied by Otto et al.Reference Otto, Dlouhý, Somsen, Bei, Eggeler and George25 in 2013 with the samples prepared by arc melting, heat-treating at 1473 K for 48 h, cold rolling, and homogenizing. Figure 7(a)Reference Otto, Dlouhý, Somsen, Bei, Eggeler and George25 shows the transmission electron microscopy (TEM) bright-field results of the coarse-grained sample after a tensile strain of 1.7% at 873 K, and it illustrates that at the beginning of plastic deformation, the dislocation glide is mainly located on a set of {111} lattice planes. The {111} dislocation slip dominates the early stage of deformation (∼2%) at 873, 293, and 77 K, as shown in Figs. 7(b) and 7(c).Reference Otto, Dlouhý, Somsen, Bei, Eggeler and George25 When the strain becomes higher (∼20%), the microstructures exhibit great difference, as presented in Fig. 8,Reference Otto, Dlouhý, Somsen, Bei, Eggeler and George25 which contains extensive twinning at 77 K. In Fig. 8(a),Reference Otto, Dlouhý, Somsen, Bei, Eggeler and George25 there are a large amount of deformation twins in the grain with a high density. Figure 8(b)Reference Otto, Dlouhý, Somsen, Bei, Eggeler and George25 presents an area with two deformation twins whose thickness is ∼2.5 nm, and the two twining regions are denoted as “1” and “2”. Figure 8(c),Reference Otto, Dlouhý, Somsen, Bei, Eggeler and George25 focused on the area outlined by the white square in Fig. 8(b),Reference Otto, Dlouhý, Somsen, Bei, Eggeler and George25 demonstrates the orientations of the parent crystal and the twins, which are represented by the twinning elements,  ${K_1} = \left( {\bar{1}1\bar{1}} \right)$,
 ${\eta _1} = [\bar{1}12]$, and
 ${K_2} = \left( {\bar{1}11} \right)$,
 ${\eta _2} = [\bar{1}1\bar{2}]$. They concluded that the deformation-induced twinning could be the reason for the increased ductility at low temperatures. Moreover, the ultimate tensile strength and the work hardening rate are increased due to the interfaces in the grains introduced by twinning during deformation. In the latest study, by Lin et al.,Reference Lin, Liu, An, Wang, Zhang and Liao41 the authors observed the phase transformation from FCC to HCP structure in the FeCoCrNi HEA during cryogenic deformation at a low temperature, i.e., 4.2 K. They confirmed that the phase transformation is associated with the glide of Shockley partial dislocation on the {111} plane of the FCC phase. However, the effect of the phase transformation on the cryogenic mechanical properties of the FeCoCrNi HEA is not clear.
TEM bright-field microstructures of the coarse-grained (the grain size of 150 µm) CoCrFeMnNi HEA after tensile strains of (a) 1.7% at 873 K, (b) 2.4% at 77 K, and (c) 2.1% at 293 K, respectively. Reprinted with permission from Ref. Reference Otto, Dlouhý, Somsen, Bei, Eggeler and George25.

TEM images of the fine-grained CoCrFeMnNi HEA (the grain size of 4.4 µm) with a strain of 20.2% at 77 K. (a) Microstructure of the twinning-zone. (b) High-resolution TEM image of twins with an inset of the Fourier transform image of the regions denoted “1” and “2”. (c) Image of the area marked by the white square in (b) after additional Fourier transform filtering. Reprinted with permission from Ref. Reference Otto, Dlouhý, Somsen, Bei, Eggeler and George25.

Stepanov et al.Reference Stepanov, Tikhonovsky, Yurchenko, Zyabkin, Klimova, Zherebtsov, Efimov and Salishchev42 studied the cryo-deformation of the CoCrFeNiMn HEA and analyzed the hardening mechanisms quantitatively during rolling at 77 and 293 K. The dislocation-density variations as a function of strain at the two temperatures are exhibited in Fig. 9(a).Reference Stepanov, Tikhonovsky, Yurchenko, Zyabkin, Klimova, Zherebtsov, Efimov and Salishchev42 As presented in Fig. 9(b),Reference Stepanov, Tikhonovsky, Yurchenko, Zyabkin, Klimova, Zherebtsov, Efimov and Salishchev42 the twinned-grain fraction under 77 K is about two times higher than that at room temperature during the early stage of deformation. The twin fraction under cryo-rolling reaches the maximum at the strain of ∼25%, while the fraction of room-temperature rolling is ∼64%. In Fig. 9(c),Reference Stepanov, Tikhonovsky, Yurchenko, Zyabkin, Klimova, Zherebtsov, Efimov and Salishchev42 the values of the distances between twins at both temperatures illustrate that the twinning dominates the deformation mechanism, which will reduce the contribution of slip.
(a) Dislocation density, (b) fraction of twinned grains, and (c) space between twins of the CoCrFeNiMn HEA versus strain at 77 and 293 K. Reprinted with permission from Ref. Reference Stepanov, Tikhonovsky, Yurchenko, Zyabkin, Klimova, Zherebtsov, Efimov and Salishchev42.

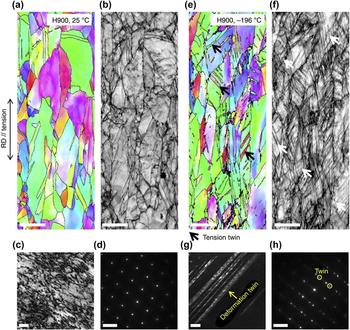
The V10Cr15Mn5Fe35Co25Ni HEA (atomic percent) was developed and investigated by Jo et al.,Reference Jo, Jung, Choi, Sohn, Kim, Lee, Kim and Lee43 in which room-temperature deformation twinning was utilized to improve the cryogenic strength. They prepared the samples by vacuum-induction melting, homogenizing at 1373 K for 6 h, rolling with a reduction ratio of 75% at room temperature, and annealing at 1023 and 1173 K to develop partially and fully recrystallized structures, respectively. As shown in Figs. 10(a) and 10(b),Reference Jo, Jung, Choi, Sohn, Kim, Lee, Kim and Lee43 deformation twinning can be barely observed in the inverse pole figure and image-quality results at ambient temperature, regarding the fully recrystallized alloy. However, twinning can be seen clearly at cryogenic temperatures shown in Figs. 10(e) and 10(f).Reference Jo, Jung, Choi, Sohn, Kim, Lee, Kim and Lee43 In Fig. 10(c),Reference Jo, Jung, Choi, Sohn, Kim, Lee, Kim and Lee43 we can see the dislocations with a high density on the TEM bright-field image, which is verified, using selected-area diffraction (SAD) along the [011] axis presented in Fig. 10(d).Reference Jo, Jung, Choi, Sohn, Kim, Lee, Kim and Lee43 As can be seen in Fig. 10(g),Reference Jo, Jung, Choi, Sohn, Kim, Lee, Kim and Lee43 the twins at 77 K could be observed on the TEM dark-field image, which is confirmed by SAD results in Fig. 10(h).Reference Jo, Jung, Choi, Sohn, Kim, Lee, Kim and Lee43
The microstructures of the fully recrystallized V10Cr15Mn5Fe35Co25Ni HEA at ambient and cryogenic temperatures.Reference Jo, Jung, Choi, Sohn, Kim, Lee, Kim and Lee43 The scale bars are 5 µm, 5 µm, 50 nm, and 5 nm−1, respectively, in both the (a–d) and (e–h) with the same order. RD represents rolling direction. Reprinted with permission from Ref. Reference Jo, Jung, Choi, Sohn, Kim, Lee, Kim and Lee43 (Creative Commons Attribution 4.0 International License—https://creativecommons.org/licenses/by/4.0/legalcode).

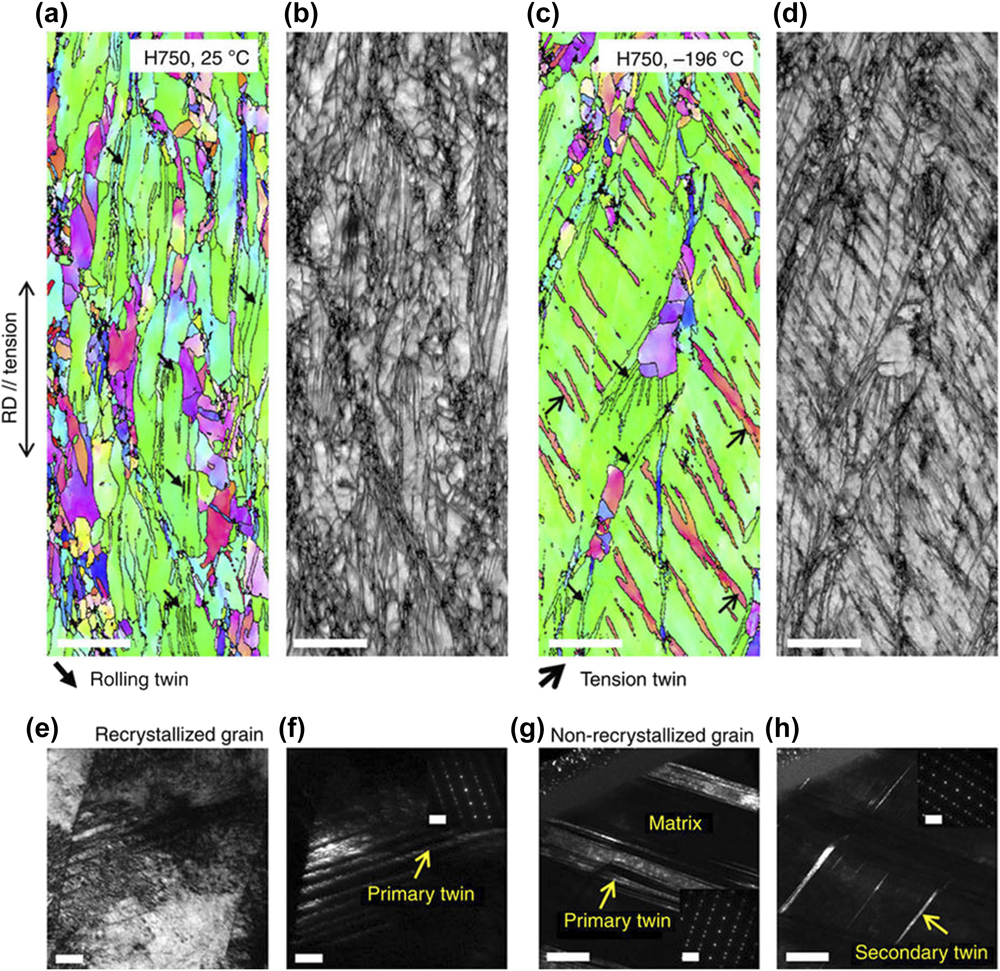
For the partially recrystallized V10Cr15Mn5Fe35Co25Ni HEA presented in Fig. 11,Reference Jo, Jung, Choi, Sohn, Kim, Lee, Kim and Lee43 a large number of twins can be observed after the deformation at room temperature in Figs. 11(a) and 11(b),Reference Jo, Jung, Choi, Sohn, Kim, Lee, Kim and Lee43 which are mostly reserved after cold rolling. In the cryogenic condition, twins with a 60° orientation are formed in the grains with no recrystallization, which have different orientations from the retained twins after cold rolling, as presented in Figs. 11(c) and 11(d).Reference Jo, Jung, Choi, Sohn, Kim, Lee, Kim and Lee43 For the thickness of twins, fine twins (10–30 nm) can be observed in the grains with recrystallization in Figs. 11(e) and 11(f),Reference Jo, Jung, Choi, Sohn, Kim, Lee, Kim and Lee43 while the twin bundles (∼500 nm) in Fig. 11(g)Reference Jo, Jung, Choi, Sohn, Kim, Lee, Kim and Lee43 are generated together with the fine secondary twins in Fig. 11(h).Reference Jo, Jung, Choi, Sohn, Kim, Lee, Kim and Lee43
The microstructures of the partially recrystallized V10Cr15Mn5Fe35Co25Ni HEA at ambient and cryogenic temperatures.Reference Jo, Jung, Choi, Sohn, Kim, Lee, Kim and Lee43 The scale bars are 5 µm, 5 µm, 50 nm, and 5 nm−1, respectively, in both the (a–d) and (e–h) with the same order. RD represents rolling direction. Reprinted with permission from Ref. Reference Jo, Jung, Choi, Sohn, Kim, Lee, Kim and Lee43 (Creative Commons Attribution 4.0 International License—https://creativecommons.org/licenses/by/4.0/legalcode).

IV. STACKING FAULT ENERGY
Since twinning could be the dominant factor for the improvement of cryogenic mechanical properties of HEAs, the research on the SFE of HEAs, which is closely related to twinning, is very necessary. Smith et al.Reference Smith, Hooshmand, Esser, Otto, McComb, George, Ghazisaeidi and Mills44 investigated the SFE of the CrMnFeCoNi HEA using both experimental and simulation methods. They measured the dissociation of dislocations and their core structures with diffraction contrast scanning transmission electron microscopy and high angle annular dark-field STEM. Many planar slip bands consist of 1/2〈110〉 dislocations and wide variations on the distances of the dissociation were determined in their work. They used the embedded-atom model potential in their simulation to build the model of a solid solution with 3 elements, whose results illustrate that the SFE in the alloy should be a local property instead of a global variable.
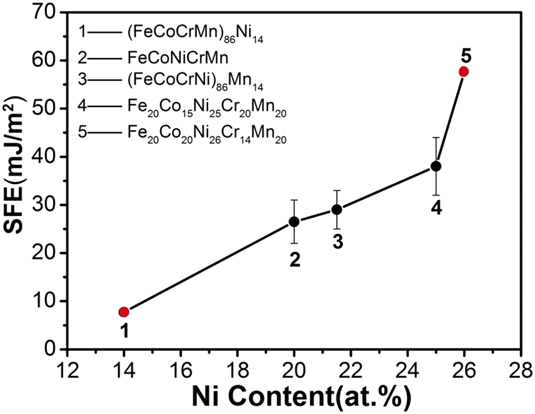
Liu et al.Reference Liu, Wu, Wang, He, Liu, Chen, Liu, Wang and Lu45 measured the SEF of the FeCoNiCrMn HEA system with the samples fabricated by arc melting, homogenizing at 1473 K for 10 h, and cold rolling with a reduction of 35% in thickness. The equation that they utilized to determine the SFE is described asReference Aerts, Delavignette, Siems and Amelinckx46
 $$d = {{Gb_{\rm{p}}^2} \over {8\pi \gamma }} \cdot {{2 - v} \over {1 - v}} \cdot \left( {1 - {{2v\cos 2\theta } \over {2 - v}}} \right)\quad ,$$
where G is the shear modulus, b p is the 1/6a 0〈112〉 (a 0 is the lattice constant measured by X-ray diffraction), and v is the Poisson’s ratio. As shown in Fig. 12,Reference Liu, Wu, Wang, He, Liu, Chen, Liu, Wang and Lu45 Ni plays an important role in the SFE of the alloys, i.e., the SFE increases with increasing the Ni content. They thought that the composition dependence of SFE in the HEA is due to the high SFE of Ni, which substitutes other elements with the low SFE, boosting the SFE of the whole alloy.
Values of SFE in the FeCoNiCrMn HEA system versus the content of Ni. Reprinted with permission from Ref. Reference Liu, Wu, Wang, He, Liu, Chen, Liu, Wang and Lu45.

V. DISCUSSION
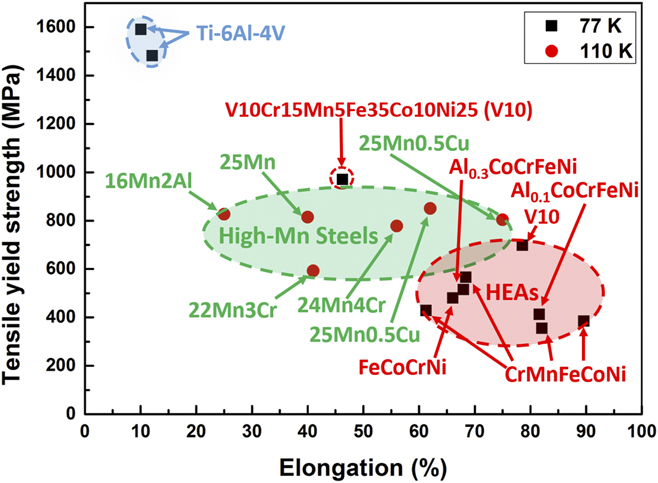
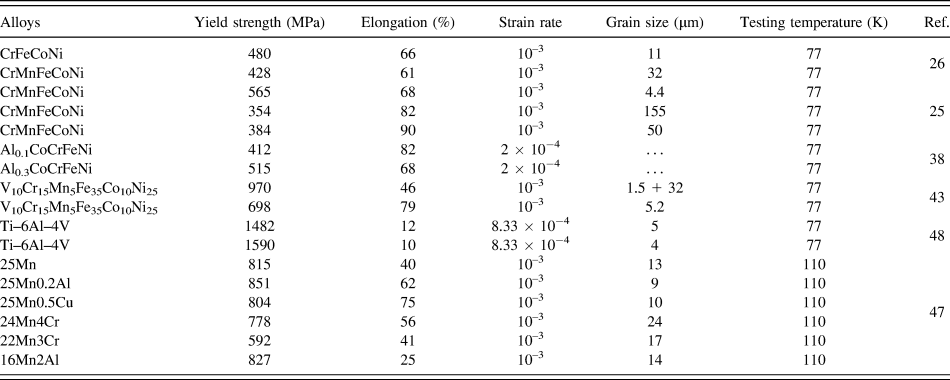
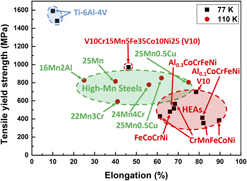
We summarized and plotted the tensile yield strengths and elongations at low temperatures of several HEAs and conventional cryogenic alloys in Fig. 13 and Table I,Reference Otto, Dlouhý, Somsen, Bei, Eggeler and George25,Reference Gali and George26,Reference Li and Zhang38,Reference Jo, Jung, Choi, Sohn, Kim, Lee, Kim and Lee43,Reference Seo, Jeong, Sung and Kim47,Reference Nagai, Yuri, Ogata, Umezawa, Ishikawa, Nishimura, Mizoguch and Ito48 which also shows the testing conditions and grain sizes. The titanium alloyReference Nagai, Yuri, Ogata, Umezawa, Ishikawa, Nishimura, Mizoguch and Ito48 (Ti–6Al–4V) presents the highest tensile yield strengths among the alloys, which are 1482 and 1590 MPa for the forged (the grain size of 5 µm) and rolled (the grain size of 4 µm) samples at 77 K, respectively. However, the elongation of the Ti–6Al–4V alloy stands at the lowest position. Regarding the ductility at cryogenic temperatures, the HEAs, whose elongation could reach ∼90%, seem to have the advantage, compared with the titanium alloy and high-Mn steels. Most of the elongations of the plotted HEAs are in a range of 61–90%. The mechanical properties of high-Mn steels, both the yield strength and ductility, are located in the middle part of the plot, which are between those of HEAs and titanium alloys. The difference of the mechanical properties of the same HEA composition is due to their different grain sizes, such as the CrMnFeCoNi and the V10Cr15Mn5Fe35Co10Ni25Reference Jo, Jung, Choi, Sohn, Kim, Lee, Kim and Lee43 (V10) HEAs. The grain size plays an important role on the mechanical properties. The yield strengths of the CrMnFeCoNi HEA are about 565, 384, and 354 MPa for the samples with the grain size of 4.4, 50, and 155 µm, respectively. The yield strength is decreased as the grain size increased. However, the elongation reaches the peak of ∼90% for the grain size of 50 µm, while that for the grain size of 4.4 and 155 µm are 68% and 82%, respectively. In this case, the small grain size will contribute to better balanced properties with both the yield strength and ductility. It is worth mentioning that the V10 HEA with mixed grain sizes of 1.5 and 32 µm exhibits an excellent combination of strength and ductility, which exceeds the performance of high-Mn steels and other HEAs. The V10 HEA is partially crystallized, which contains small recrystallized (∼1.5 µm) and coarse nonrecrystallized (∼32 µm) grains. The reserved twins after the partial crystallization greatly improve the strength of the V10 HEA at the low temperature of 77 K.Reference Jo, Jung, Choi, Sohn, Kim, Lee, Kim and Lee43
Tensile yield strength versus elongation at 77 and 110 K for HEAs and conventional cryogenic alloys.Reference Otto, Dlouhý, Somsen, Bei, Eggeler and George25,Reference Gali and George26,Reference Li and Zhang38,Reference Jo, Jung, Choi, Sohn, Kim, Lee, Kim and Lee43,Reference Seo, Jeong, Sung and Kim47,Reference Nagai, Yuri, Ogata, Umezawa, Ishikawa, Nishimura, Mizoguch and Ito48 The blue, green, and red characters represent titanium alloy, high-Mn steels, and HEAs, respectively.

Mechanical properties, grain sizes, and testing conditions of the HEAs and conventional alloys.Reference Otto, Dlouhý, Somsen, Bei, Eggeler and George25,Reference Gali and George26,Reference Li and Zhang38,Reference Jo, Jung, Choi, Sohn, Kim, Lee, Kim and Lee43,Reference Seo, Jeong, Sung and Kim47,Reference Nagai, Yuri, Ogata, Umezawa, Ishikawa, Nishimura, Mizoguch and Ito48

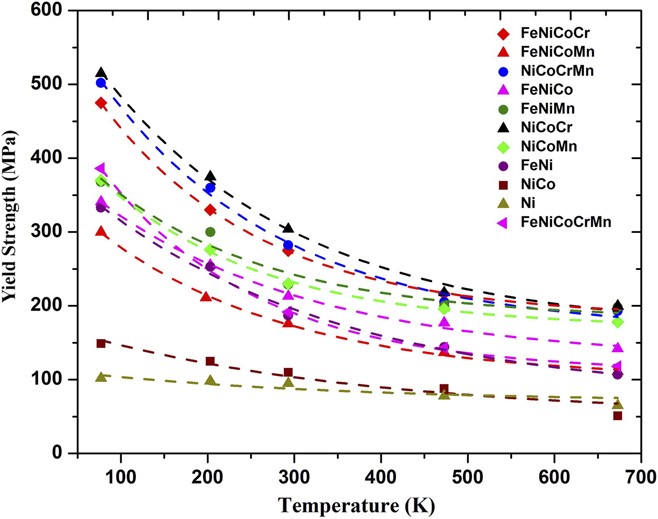
As shown in Fig. 14,Reference Wu, Troparevsky, Gao, Morris, Stocks and Bei34 Wu et al. summarized the temperature dependence of the 0.2% offset yield stresses of different kinds of the equiatomic alloys and pure Ni. The alloys with more than 3 elements show obvious temperature dependence. However, the FeNi alloy with 2 elements also possess clear temperature dependence, which is stronger than that of the FeNiCoMn alloy with 4 elements. Therefore, the reasons for the strong temperature dependence of the above alloys, both binary and multicomponent alloys, are needed to be further investigated.
Temperature dependences of the 0.2% offset yield stresses of different kinds of equiatomic alloys and pure Ni. Reprinted with permission from Ref. Reference Wu, Troparevsky, Gao, Morris, Stocks and Bei34.

Based on the values of SFE calculated by Liu et al.,Reference Liu, Wu, Wang, He, Liu, Chen, Liu, Wang and Lu45 the FeCoNiCr and FeCoNiCrMn HEAs have the SFE of 27 ± 4 mJ/m2 and 26.5 ± 4.5 mJ/m2, respectively. The two values of SFE for the two alloys are very close. However, the FeCoNiCr HEA shows a much better yield strength than the FeCoNiCrMn HEA at cryogenic and ambient temperatures, even at high temperatures. This trend may remind us of the viewpoint that the higher configuration entropy introduced by 4 or more elements cannot ensure the better mechanical properties, compared with the ternary alloys. For example, the NiCoCr alloy, which is a kind of medium-entropy alloys (MEAs), has the highest yield strength from the low to high temperatures among all the alloys as summarized by Wu et al. in Fig. 14.Reference Wu, Troparevsky, Gao, Morris, Stocks and Bei34 In that figure, Wu et al.Reference Wu, Troparevsky, Gao, Morris, Stocks and Bei34 plotted the comparison of yield strengths of equiatomic alloys with two, three, four, and five elements, as well as the pure Ni. All the alloys in Fig. 14Reference Wu, Troparevsky, Gao, Morris, Stocks and Bei34 show the temperature dependence of strength while the pure Ni presents no obvious temperature dependence.
Zhang et al.Reference Zhang, Sheng, Wang, Gludovatz, Zhang, George, Yu, Mao and Ritchie39 reported the ultra-high mechanical properties of the CrCoNi MEA, which are due to the conventional strengthening of the twin boundary and 3D twin network. In their work, the 3D twin network is confirmed to be able to oppose the de-twinning process during deformation, and the interfaces of twins provide the path for the dislocation slip. Especially, at cryogenic temperatures, the twinning activity could be further improved, which will contribute to generate the 3D hierarchical twinning during deformation. Laplanche et al.Reference Laplanche, Kostka, Reinhart, Hunfeld, Eggeler and George23 studied the reasons for the higher mechanical properties of the CrCoNi MEA than those of the FeCoNiCrMn HEA. They verified a SFE of 22 ± 4 mJ/m2 in the CrCoNi alloy, which is ∼25% lower than that in the FeCoNiCrMn HEA. It enables the CrCoNi alloy to have a higher capability of twinning than the FeCoNiCrMn HEA. They also found that the critical resolved shear stress for twinning in the CrCoNi alloy, which is confirmed to be 260 ± 30 MPa, is similar to that in the FeCoNiCrMn HEA. However, the CrCoNi alloy has a higher yield strength and work-hardening rate than the FeCoNiCrMn HEA. Therefore, the CrCoNi MEA could reach the critical twinning stress earlier than the FeCoNiCrMn HEA during deformation. Then the high and stable work hardening induced by nanotwinning could lead to the superior mechanical performances of the CrCoNi alloy. The twinning could be the main reason for the excellent properties of FCC MEAs and HEAs at low temperatures. However, the contribution of other strengthening mechanisms in the CrCoNi alloy is still needed to be investigated in future.
VI. FUTURE DIRECTIONS
The study on the cryogenic behaviors of HEAs, such as tensile and compressive properties, toughness, and fatigue, is still at the early stage. More HEA systems are expected to be investigated under low-temperature conditions. Besides HEAs with FCC structures, the BCC and HCP HEAs may also have special properties below room temperature. Research on the MEAs, such as the CrCoNi alloy, becomes another hotspot due to their outstanding mechanical properties at both ambient and cryogenic temperatures.
The strong temperature dependence of the strength in HEAs could be further investigated, which is very helpful for us to have a better understanding of the mechanical behavior of HEAs in cryogenic conditions.
The reason behind the excellent cryogenic mechanical properties of HEAs are still needed to be further studied. A comprehensive deformation mechanism is expected to be established, which could explain the deformation behavior of HEAs in depth at cryogenic temperatures. The influence of the high-entropy effect of HEAs on the cryogenic properties is also an interesting and important point.
Functional properties of HEAs below room temperature are also worth investigating, such as magnetic and electrical properties.
The above proposed research activities will prompt the industrial applications of HEAs. The cryogenic applications of HEAs have a bright future, such as the storage and transport of the various liquefied gases and the outer space probe.
To enable people to efficiently do the literature survey of HEAs, a widely accepted naming rule for HEAs needs to be established. We can name the HEAs using their components in the order of the periodic table or alphabet. For instance, the equiatomic HEA with the components of Co, Cr, Fe, Mn, and Ni can be named as CrMnFeCoNi in the order of the periodic table or CoCrFeMnNi in the order of the alphabet.
VII. CONCLUSIONS
In this article, we summarized the mechanical properties of HEAs at cryogenic and ambient temperatures. Both the HEAs with the BCC sturcture, such as the AlCoCrFeNi HEA, or the FCC structure, e.g., the FeCoNiCrMn HEA, have been found to possess excellent mechanical properties at low temperatures, especially the ductility. The V10Reference Jo, Jung, Choi, Sohn, Kim, Lee, Kim and Lee43 HEA with partial crystallization has good balanced mechanical properties of strength and ductility at the low temperature of 77 K, which exceeds most of the cryogenic alloys. The twins that retained from the partial crystallization will dramatically improve the strength of the HEA. However, most research was focused on the FCC HEAs, which could be highly enhanced by deformation twinning at low temperatures.
The strong temperature dependence of the strengths in HEAs could be one of the unique features, compared to the pure metal and most conventional alloys. For the HEAs mentioned above, their yield and fracture strengths, as well as the ductility, are improved as the temperature decreased from room temperature to 77 K. The Al0.3CoCrFeNi HEA exhibits an obvious temperature dependence of yield strength at an ultra-high strain rate of 1800 s−1. The strain-rate dependence of the strengths of HEAs also exists in some HEAs, which could depend on the compositions and sufficient high strain rates.
The toughness of HEAs at cryogenic temperatures is another highlight, which exceeds most of the conventional alloys. The fracture toughness of the CrMnFeCoNi HEA is higher than 200 MPa m1/2 at 77 K.Reference Gludovatz, Hohenwarter, Catoor, Chang, George and Ritchie16 Moreover, the CrCoNiReference Zhang, Sheng, Wang, Gludovatz, Zhang, George, Yu, Mao and Ritchie39 MEA is reported for having better fracture toughness than the CrMnFeCoNi HEA, which is related to the ability of the dislocation movement controlled by twinning. The CoCrFeNi HEA has the great performance of impact toughness with the Charpy-impact energy of 398 J at 77 K.Reference Li and Zhang38 In terms of fatigue properties, the CrMnFeCoNi HEA exhibits better performance than austenitic steels and TWIP steels at low temperatures.
The deformation twinning could be the dominant reason for the strengthening of FCC HEAs at low temperature. The HEAs with an FCC structure usually possess the low SFE, which is very important for the formation of twinning at low temperatures.
More investigations are needed to understand the cryogenic behaviors of HEAs, such as the BCC and HCP HEAs. Moreover, a comprehensive deformation mechanism of the cryogenic behaviors of HEAs needs to be established. Functional properties of HEAs at cryogenic temperatures, such as magnetic and electrical properties, are also worth studying. The research on cryogenic properties of HEAs will prompt the industrial applications, which is very important to the future of HEAs.
ACKNOWLEDGMENTS
ZL and PKL would like to acknowledge the Department of Energy (DOE), Office of Fossil Energy, National Energy Technology Laboratory (DE-FE-0008855, DE-FE-0024054), with Mr. V. Cedro and Mr. R. Dunst as program managers. ZL and PKL thank the support from the project of DE-FE-0011194 with the program manager, Dr. J. Mullen. PKL very much appreciates the support of the U.S. Army Research Office project (W911NF-13-1-0438) with the program managers, Dr. M.P. Bakas, Dr. D.M. Stepp, and Dr. S.N. Mathaudhu. ZL, XF, CL, SYW, RF, and PKL thank the support from the National Science Foundation (DMR-1611180) with the program directors, Dr. G. Shiflet and Dr. D. Farkas. We very much appreciate the support of the Center for Materials Processing with Prof. Claudia Rawn as the director.