

Le Luxembourg est le pays de l’Union Européenne où la proportion d’étrangers est la plus forte (Thill-Ditsch, Reference Thill-Ditsch2010). Il constitue donc un cadre privilégié pour l’étude de l’intégration des étrangers, en particulier des Portugais. En effet, l’Institut National de la Statistique et des Études Économiques du Grand-Duché du Luxembourg estimait, au 1er janvier 2011, à près de 512 000 la population résidant au Luxembourg, dont environ 221 000 étrangers, soit 43 % de la population (statec, 2011). Parmi ces étrangers, les Portugais sont les plus nombreux puisqu’ils représentent, avec un effectif d’un peu plus de 81 000 habitants, 37 % de la population étrangèreFootnote 1, c’est-à-dire 16 % de la population totale.
L’immigration portugaise, de nature essentiellement économique et familiale, a débuté à la fin des années 1960 et ne s’est jamais interrompue depuis (Berger, Reference Berger2008). Cette immigration est originaire de régions rurales du Portugal, et issue d’un milieu social modeste. Les autorités luxembourgeoises ont permis la venue de ces travailleurs peu qualifiés, dotés d’un faible niveau d’instruction, pour occuper les emplois situés au bas de l’échelle sociale, principalement dans le secteur de la construction pour les hommes, et dans celui du nettoyage pour les femmes.
Les descendants des primo-arrivants représentent aujourd’hui environ un tiers de la population portugaise résidant au Luxembourg. Malgré une intégration socio-économique relativement réussie qui se manifeste notamment par une ascension sociale ascendanteFootnote 2, la proportion de Portugais issus de l’immigration à avoir opté pour la nationalité luxembourgeoiseFootnote 3 était encore récemment marginale.
Jusqu’en 2009, la législation en matière de nationalitéFootnote 4 imposait l’abandon de la nationalité antérieure pour pouvoir devenir Luxembourgeois. Or, si parfois l’acquisition de la nationalité peut répondre à des motivations pratiques (accès à l’emploi, titres de séjours…), les motivations d’ordres symbolique ou affectif apparaissent essentielles, notamment pour les Portugais. Delfina Beirão (Reference Beirão1999) montre, à partir d’une série d’entretiens que, malgré une relative facilité pour acquérir la nationalité luxembourgeoise, les jeunes adultes portugais issus de l’immigration sont peu nombreux à la vouloir. Leur nom à consonance portugaise, leur apparence (teint plus basané, cheveux noirs…), ou encore leur degré de maîtrise de la langue luxembourgeoiseFootnote 5 sont autant de signes qui les renvoient à leur origine et au sentiment de rester étrangers. Néanmoins, ils estiment faire partie du Luxembourg en tant que citoyens à part entière, sentiment légitimé par leur lieu de naissance ou le fait d’y avoir vécu presque toute leur vie. Leur identité, contrairement à celle de leurs parents qui se sentent Portugais, est le résultat d’une négociation permanente entre deux environnements différents, familial et sociétal, entre le pays de naissance de leurs parents et le Luxembourg. D’une manière générale, l’intégration socio-économique et la « discrétion » qui caractérise la diaspora portugaise masque « l’intensité des liens intercommunautaires, des rapports conservés et entretenus avec le pays natal, des stratégies de maintien d’une identité culturelle qui permettent d’être à l’aise dans le pays d’accueil sans pour autant se sentir obligé de s’y fondre » (Charbit, Hily et Poinard, 1997). C’est ainsi qu’Albano Cordeiro (Reference Cordeiro1987) les qualifient de « bilocalisés ».
Dès lors, le principe de la double nationalité – introduit en droit luxembourgeois par la loi du 23 octobre 2008Footnote 6 – apparaît comme une solution idéale pour les étrangers qui souhaitent témoigner de leur attachement au Luxembourg, tout en voulant conserver, à travers leur nationalité d’origine, un lien avec le pays et la culture de leurs parents. Depuis le 1er janvier 2009, date d’entrée en vigueur de la loi, 2 593 PortugaisFootnote 7 ont choisi d’être naturalisés en 2009 et 2010, soit davantage qu’au cours des 15 années qui ont précédé la loi (2 304 Portugais furent naturalisés de 1994 à 2008).
Cette double appartenance appelle – au-delà de la problématique de la naturalisation – à s’interroger sur la manière dont s’intègrent les immigrés et leur descendance au sein du Grand-Duché. Cette question de l’intégration nous apparaît essentielle, puisqu’elle pose le problème de la cohésion sociale dans un pays où la population se composera à l’avenir d’une part de plus en plus importante d’individus – nationaux ou non – issus de l’immigration. Pour ce faire, nous concentrerons notre étude sur la communauté portugaise, la plus nombreuse au Luxembourg et installée depuis suffisamment longtemps pour permettre une analyse comparative pertinente entre primo-arrivants, descendants d’immigrés, autochtones et Portugais résidant au Portugal. La multidimensionnalité du processus d’intégration (notamment à travers la dimension socio-économique et celle des valeurs) sera abordée grâce à l’exploitation statistique de l’enquête European Values Study (EVS) de 2008. Mais préalablement, nous procéderons à un examen synthétique de la littérature sociologique en matière d’intégration, afin de construire le cadre théorique et conceptuel de notre recherche.
Théories de l’intégration
La théorie classique en sociologie de l’immigration s’inscrit dans la tradition durkheimienne, et a dominé toute la première partie du XXe siècle. Elle définit l’intégration comme « le degré de conformité aux normes collectives majoritaires » (Lescarret et Philip-Asdish, Reference Lescarret, Philip-Asdish, Preteur and De Leonardis1995). Cette théorie envisage l’effacement de la culture et de l’identité originelle des migrants au profit des normes dominantes de la société d’accueil, de façon à ce que l’étranger devienne « invisible » (Marger, Reference Marger1994). On parle alors d’intégration par assimilation, définie comme le « partage d’une mémoire historique commune » (Park et Burgess, 1921). Pour Robert Park (Reference Park1928), l’un des fondateurs de l’École de Chicago, l’assimilation est l’étape ultime de l’intégration. Elle n’est atteinte qu’à l’issue d’une évolution lente et progressive – sur environ trois générations – car il y a une tendance à « résister » de la part du migrant malgré son attirance vers la société d’accueil. L’absence de rupture avec la culture d’origine entraîne la marginalité à l’origine de phénomènes de déviance et de pathologies. Pour Michèle Tribalat (Reference Tribalat1996), « l’assimilation implique la résorption des spécificités migratoires et culturelles » et peut se mesurer par l’intermédiaire d’indicateurs sociodémographiques (augmentation des unions mixtes, convergence des comportements féconds…), socioculturels (usage dans la famille de la langue du pays d’accueil, mélange des sociabilités…), socio-économiques (insertion socioprofessionnelle, mobilité sociale ascendante…) et sociopolitiques (naturalisation, participation politique…). Cette théorie va être critiquée en raison de son point de vue ethnocentrique qui hiérarchise les valeurs du pays d’accueil et celles du pays d’origine du migrant, tout en les jugeant incompatibles. En outre, elle attribue un rôle déprécié aux personnes issues de l’immigration en interprétant leurs caractéristiques et leurs conduites en termes de « manquements » (Sayad, Reference Sayad1999).
Au cours de la 2e moitié du XXe siècle, les théoriciens de l’intégration par assimilation vont affiner le concept sans remettre en question l’idée de la convergence des caractéristiques des immigrés vers la moyenne de celles de la société d’accueil. Dans cette optique, Milton Gordon (Reference Gordon1964) propose une conception multidimensionnelle du processus d’intégration dans lequel l’assimilation est l’aboutissement d’une succession de sept étapes :
- l’acculturation qui suppose l’adoption des caractéristiques culturelles de la société d’accueil ;
- la dimension structurelle ou la participation dans les organismes du pays d’accueil ;
- « l’amalgamation », c’est-à-dire le mariage mixte ;
- la dimension identitaire avec un développement du sentiment d’appartenance à la société d’accueil et à ses institutions ;
- l’absence de préjugés et d’hostilité de la part de la société d’accueil ;
- la disparition des discriminations ;
- l’acquisition de la nationalité et la participation politique.
L’intérêt de ce découpage réside dans la possibilité de « mesurer » les diverses dimensions de l’intégration conduisant à l’assimilation, ainsi que le degré d’interaction entre elles. Pour Gordon, il peut y avoir acculturation sans qu’il y ait nécessairement un glissement vers les autres étapes menant à l’assimilation. En revanche, la dimension structurelle est essentielle en jouant un rôle positif sur toutes les autres dimensions. L’intégration structurelle – qui n’est pas clairement définie par Gordon – tend à affaiblir le sentiment d’appartenance au groupe d’origine du fait de l’interaction avec les institutions du pays d’accueil.
D’autres auteurs (Zimmer, Reference Zimmer and Jansen1970 ; Yinger, Reference Yinger1981) proposeront un schéma d’assimilation assez comparable. Cependant, l’ethnocentrisme de ce corpus théorique, l’absence d’une situation finale autre que l’assimilation ou la marginalisation envisageable et les critiques liées à l’existence d’une classe moyenne représentative de la société d’accueil à laquelle les immigrants doivent s’ajuster (Glazer et Moynihan, 1972), ont conduit au développement de théories alternatives de l’intégration.
Parmi celles-ci, on peut citer la théorie du pluralisme ethnique et culturel (ou du multiculturalisme). Développée à partir de la moitié des années 1980, elle prend le contre-pied de la théorie classique de l’intégration en postulant le caractère désirable de sociétés plurielles ou multiethniques (Schmitter Heisler, 1992). Les travaux inscrits dans ce courant théorique rejettent donc la philosophie assimilationniste ou intégrationnisteFootnote 8 (Joppke, Reference Joppke1996 ; Wieviorka, Reference Wieviorka1996 ; Martiniello, Reference Martiniello1997). Même si ce courant se situe souvent au niveau idéologique, il présente l’intérêt de montrer que, parfois, la mobilisation des ressources communautaires favorise l’intégration socio-économique, en offrant des opportunités de travail par exemple.
Afin de concilier ces points de vues antagonistes et d’apporter une réponse aux critiques dont elles font l’objet, Alejandro Portes (1995) propose une théorie de l’assimilation dite « segmentée »Footnote 9. Ce modèle se concentre – contrairement à celui de l’assimilation classique – sur les cas de figure où les caractéristiques des immigrés ne convergent pas vers celles de la population du pays d’accueil. En effet, si pendant la première moitié du XXe siècle, la théorie classique était adaptée à l’étude de l’intégration des migrants, notamment aux États-Unis (Alba et Nee, 1997), il semble en aller autrement avec l’arrivée de populations non européennes (Zhou, Reference Zhou1997 ; Esser, 2003), avec des différences ethniques qui tendent à se maintenir d’une génération sur l’autre (Gans, Reference Gans1973). Influencée par le caractère multidimensionnel des travaux de Gordon, la théorie segmentée propose trois modèles d’intégration (Portes et Zhou, Reference Portes and Zhou1993 ; Silberman, Reference Silberman2002) :
- la théorie de l’assimilation classique est ici présentée comme l’une des formes particulières que peut prendre le processus d’intégration. Elle se manifeste par l’assimilation culturelle (acculturation) conjointement à une intégration sur le plan économique (mobilité sociale ascendante) ;
- l’intégration dite « infériorisante » (Portes, 1995) correspond à une assimilation culturelle, mais sans intégration économique. Alors que les différences culturelles avec la société d’accueil se sont fortement réduites, la communauté immigrée continue d’évoluer dans les sphères économiques défavorisées ;
- enfin, l’intégration sur le mode du pluralisme culturel (Gordon, Reference Gordon1964) se traduit par une mobilité sociale ascendante conjointement à une absence d’acculturation. En préservant les traits culturels de sa communauté, l’immigré peut profiter d’une certaine forme de solidarité ethnique dans le domaine économique.
Par exemple, en France, François Dubet (Reference Dubet1987) observe que les communautés portugaise, asiatique et turque s’intègrent davantage sur ce mode de pluralisme culturel, tandis que les Maghrébins connaîtraient plutôt une intégration « infériorisante ». Les travaux de Mirna Safi (Reference Safi2006) confirment cette analyse. Ils montrent en outre que les Espagnols ont un mode d’intégration qui correspond à celui de la théorie classique.
La théorie de l’assimilation segmentée repère deux types de facteurs qui déterminent le mode d’intégration des immigrés : les facteurs individuels (lieu de naissance, âge d’arrivée, durée de séjour, éducation, maîtrise de la langue du pays d’accueil…) et collectifs (politique d’immigration menée dans le pays d’accueil, regard de l’opinion publique sur l’immigration et les communautés d’immigrés…). Parmi ces derniers, la communauté ethnique présente dans le pays hôte – selon le niveau de ressources qu’elle met à la disposition de ses membres – joue un rôle considérable dans le processus d’intégration (Portes et Sensenbrenner Reference Portes and Sensenbrenner1993).
En parallèle, la seconde moitié du XXe siècle a connu le développement d’un ensemble de travaux théoriques présentant une conception interactive de l’intégration, qui procéderait par « acculturation » ou « négociation »Footnote 10. Melville Herskovits (Reference Herskovits1967) est l’un des premiers scientifiques à avoir pensé la négociation de l’acculturation comme le processus initiateur de l’intégration sociale. L’intégration est ainsi un processus par lequel les immigrants et la population de la société d’accueil s’acculturent mutuellement, en prenant part de manière dynamique à la construction d’ensembles identitaires négociés (Schnapper, Reference Schnapper1991). Elle est le produit de l’élaboration conflictuelle de normes collectives par des groupes différents (Reynaud, Reference Reynaud1989). L’acculturation résulte donc d’un emprunt mutuel et de la réinterprétation des éléments culturels existants. Toutefois, cette réciprocité est asymétrique : l’immigré subit l’altération culturelle la plus profonde puisque l’immigration est en soi un projet de changement culturel (Abou, Reference Abou1981 ; Lebon, Reference Lebon1983). Le processus d’acculturation s’inscrit dans la durée, qui varie selon la pertinence des politiques sociales et leur capacité à favoriser la rencontre des différents acteurs permettant la « négociation-acculturation ». C’est également un processus multidimensionnel, dont l’issue est imprévisible. En effet, en impliquant diverses dimensions (psychologiques, sociologiques, économiques…), il peut prendre une multitude de formes différentes (Costa-Lascoux, Reference Costa-Lascoux and Paugam1996), aboutissant à des trajectoires d’intégration dont les formes sont variables (Bastenier, Reference Bastenier, Collot, Didier and Loueslati1993). Plusieurs auteurs ont construit des typologies de situations d’acculturation (Bastenier et Dassetto, Reference Bastenier and Dassetto1993 ; Lapeyronnie, Reference Lapeyronnie1993 ; Esser, Reference Esser2006) qui montrent que le processus d’intégration sociale se déroule sur plusieurs champs distincts et indépendants : ceux de l’insertion économique et de la participation socioculturelle (constitution et négociation de valeurs). En outre, il apparaît que le maintien d’une identité culturelle qui ménage les allégeances anciennes ne constitue nullement un frein à l’intégration (Abou, Reference Abou1981; El Moubaraki, 1989).
Par exemple, John W. Berry (Reference Berry1997, Reference Berry2001) pose le problème de l’intégration des migrants installés sur le continent nord-américain à travers l’interrogation du maintien par les immigrés de leurs caractéristiques culturelles et celle des relations avec la société d’accueil. Il distingue quatre situations d’acculturation :
- l’assimilation (ou disparition du groupe d’origine), lorsque la communauté immigrée ne préserve pas son patrimoine culturel tout en étant ouverte aux relations avec les autres groupes ;
- l’intégration (ou la fusion de groupes différents dans un ensemble commun), si elle préserve son patrimoine culturel en restant ouverte à la société d’accueil ;
- la ségrégation (ou le cloisonnement des groupes dans la société), en cas de préservation de son patrimoine culturel conjointement à un isolement du reste de la société ;
- la marginalisation, si la communauté immigrée ne préserve pas son patrimoine culturel sans entretenir de relations avec la société d’accueil.
Cette illustration témoigne de la conception interactive de l’intégration sociale, rendue possible seulement à travers une négociation, dans laquelle la réciprocité et l’imprévisibilité des équilibrations culturelles entre le groupe migrant et la société d’accueil sont essentielles (Manço, 1999).
Cet exposé théorique en matière d’intégration va nous permettre de donner une interprétation pertinente à la trajectoire suivie par les immigrés portugais et leur descendance au Luxembourg. Il fait apparaître le rôle prédominant de l’insertion socio-économique et de l’acculturation dans le processus d’intégration, mais également celui de facteurs contextuels, tels que l’attitude de la société d’accueil et de ses institutions envers les immigrés ou encore celles de la communauté ethnique. Le travail quantitatif ci-dessous, réalisé à partir de l’exploitation statistique de l’enquête EVS de 2008, propose de « mesurer » l’intégration avec une vision multidimensionnelle.
L’enquête EVS 2008
L’European Values Study Footnote 11 (EVS) est un programme d’enquête européen qui porte sur les valeurs humaines fondamentales. Il donne un aperçu des idées, des croyances, des préférences, des attitudes, valeurs et opinions des citoyens de toute l’Europe, à travers des thèmes tels que la société, la politique, le travail, la famille, la religion, etc. L’EVS, qui a débuté en 1981, est répété tous les neuf ans (1981, 1990, 1999, 2008) dans un nombre croissant de pays. La 4evague couvre 47 pays européens ou régions pour un total d’environ 70 000 personnes interrogées.Footnote 12
Au Luxembourg, l’enquête EVS de 2008 a été réalisée auprès d’un échantillon représentatif de la population résidante composé de 1 610 individus âgés de 18 ans ou plus. Au niveau national, cette enquête fait partie du projet de recherche valcos (valeurs et cohésion Sociale), cofinancé par le Fonds National de la Recherche (fnr) et le ceps/instead dans le cadre du programme vivre, dont l’objectif est de créer une mesure multidimensionnelle de la cohésion sociale à partir de micro-données.
L’enquête EVS pose des questions sur le lieu de naissance des personnes interrogées ainsi que sur celui de leurs parents, l’année d’arrivée au Luxembourg le cas échéant et demande si l’enquêté a des grands-parents étrangers. En combinant les réponses à ces questions nous avons constitué – pour réaliser notre étude – trois groupes de « générations », en nous basant sur les liens qu’ils entretiennent avec la migration, fréquemment utilisés dans la littérature anglo-saxonne12Footnote 13:
- G1 (ou « immigrés » ; N = 160) se compose des immigrés portugais – c’est-à-dire les personnes nées au Portugal de parents également nés au Portugal, quelle que soit leur nationalité actuelle – arrivés au Luxembourg après l’âge de 10 ans.
- G2 (ou « issus de l’immigration » ; N = 55) regroupe les individus nés au Luxembourg de parents nés au Portugal, auxquels s’ajoutent les immigrés nés au Portugal mais arrivés au Luxembourg à l’âge de 10 ans ou avant. Dans de nombreux travaux, ces derniers constituent un groupe distinct : G1,5. Mais comme en l’espèce ils forment un groupe dont l’effectif est trop faible pour obtenir une analyse statistique de qualité, nous avons préféré les réunir avec la « seconde génération ». Ce regroupement ne nous apparaît pas gênant, principalement parce que ces individus ont immigré pendant l’enfance et donc, à l’instar des « vrais » G2, ont connu une immersion précoce dans la société luxembourgeoise, notamment dans le système scolaire.
- G3 (ou « autochtones » ; N = 168) sont les personnes nées au Luxembourg de parents nés au Luxembourg et dont les quatre grands-parents ne sont pas étrangers. Cette sélection à partir de l’origine des grands-parents permet notamment d’éliminer de cette « génération » les petits-enfants d’immigrés dont les parents sont nés au Luxembourg, et donc un éventuel biais dans l’analyse à cause d’un manque d’homogénéité dans le groupe.
Ce type d’analyse par « générations » utilise généralement le groupe 2,5 (ou « mixte ») : les individus nés d’une union mixte, d’un parent autochtone luxembourgeois et d’un parent immigré portugais en l’occurrence. Nous ne nous servirons pas de cette catégorie d’individus, pratiquement inexistants au LuxembourgFootnote 14. Plusieurs raisons peuvent être avancées pour expliquer cette situation. Tout d’abord l’immigration portugaise est essentiellement familiale, c’est-à-dire que de nombreux couples sont déjà constitués – parfois avec des enfants – avant l’arrivée au Luxembourg. Mais aussi, la société luxembourgeoise est relativement cloisonnée, notamment en ce qui concerne les échanges entre les primo-arrivants et les autochtones. Nous reviendrons sur ce point ultérieurement.
Nous disposons donc de trois groupes d’individus que nous allons pouvoir situer les uns par rapport aux autres, afin de tester le mode d’intégration des Portugais. Notons dès à présent que pour effectuer notre étude comparative nous sélectionnons seulement les Luxembourgeois (G3) qui appartiennent à un milieu social voisin de celui des Portugais. En effet, il nous paraît aberrant de comparer le comportement moyen des Luxembourgeois, soit celui d’une mosaïque de milieux sociaux, avec celui des Portugais qui, comme on l’a vu, appartiennent exclusivement à un milieu social peu favorisé, ayant immigré pour occuper des emplois peu qualifiés. Cette sélection est réalisée à partir du niveau d’études des parents, en retenant dans l’analyse exclusivement les individus dont les parents n’ont aucune formation ou un niveau d’études primaire. C’est le cas de la quasi-totalité des primo-arrivants portugais et de leurs enfants.
Afin de tester le comportement des Portugais au regard des théories présentées ci-dessus, nous avons évalué leur degré d’intégration dans les dimensions socio-économique et de l’acculturation.
- La dimension socio-économique est mesurée par l’intermédiaire de trois variables : le statut d’activité, la situation socioprofessionnelle et le revenu. Elles permettent de prendre en compte l’insertion professionnelle,Footnote 15le statut social et financier des individus (voir annexe 1). Cette dimension de l’intégration nous paraît essentielle puisque l’activité permet d’entretenir des contacts (favorisant peut-être l’interculturalité), mais aussi d’avoir une rémunération et par conséquent, un certain nombre de droits (allocations, sécurité sociale…) ainsi que l’accès à des biens et services.
- La dimension culturelle est appréciée sur la base d’une douzaine de questions portant sur les valeursFootnote 16 familiales, le travail et la religion (voir annexe 2). L’éventuelle distance culturelle entre les groupes que nous avons constitués est ainsi prise en compte.
Outre l’analyse des indicateurs composant chacune des dimensions précitées, nous avons également construit des indicateurs synthétiques qui permettent une mesure de l’intégration socio-économique et culturelle, ainsi que la relation que ces deux facettes de l’intégration entretiennent entre elles. Les résultats obtenus par modélisation logistique sont exposés ci-dessous.
La « mesure » de l’intégration socio-économique et culturelle
Nous avons construit deux modèles de régression logistique expliquant l’indicateur socio-économique et l’indicateur culturel. Leur objectif est de décrire la force de la relation qui lie notre variable d’intérêt, à savoir celle des « générations », avec lesdits indicateurs. Ces derniers sont des variables dichotomiques dont les bornes opposent une intégration « élevée » à une intégration « moindre »Footnote 17. Pour déterminer le seuil de cette opposition nous avons découpé notre échantillon au niveau de la valeur moyenne que prend l’agrégation de chacune des composantes de nos indicateurs, auxquelles nous avons attribué un « score ».
Enfin, pour contrôler les effets de structure, nous avons introduit les variables suivantes dans le modèle : le sexe, l’âge, le niveau d’études et la mixité des relations.
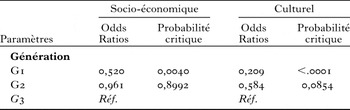
Un premier modèle, construit en l’absence des variables de contrôle, montre que les immigrés portugais (G1) ont nettement moins de chances (environ 2 fois moins) de connaître une intégration socio-économique « élevée » que les autochtones (G3) (voir tableau 1). Autrement dit, ils occupent fréquemment les emplois les moins valorisés socialement et les moins rémunérateurs (voir annexe 1). En revanche, leurs enfants (G2) semblent avoir bénéficié d’une mobilité sociale ascendante, puisqu’il n’y a pas d’écart significatif entre la mesure de leur intégration et celle des autochtones étudiés qui, rappelons-le, appartiennent à un milieu social comparable.
Probabilité relative d’être « intégré » dans les dimensions socio-économique et culturelle selon les générations d’appartenance (sans les variables de contrôle)

Total N = 383.
Source:
EVS, 2008.
Note de lecture:
les chances des immigrés portugais (G1) d’être « intégré » dans la dimension socio-économique sont 0,52 fois moins élevées que celles des Luxembourgeois (G3).
De même, pour l’indicateur culturel, les autochtones luxembourgeois ont plus de chances – près de 5 fois plus – que les immigrés portugais d’être « mieux intégrés ». Ces résultats traduisent des différences culturelles manifestes entre ces deux groupes. En effet, les autochtones sont plus enclins à adopter des valeurs dites « modernes » ou « progressistes »Footnote 18 que les immigrés. Par exemple, sur le thème de la religion, ces derniers assistent plus fréquemment à des offices religieux et accordent davantage d’importance au mariage, tout en désapprouvant le fait que deux personnes puissent vivre ensemble sans être mariées. Aussi, à propos de la valeur travail, ils sont plus nombreux que les Luxembourgeois à considérer que travailler est un devoir vis-à-vis de la société, ou qu’il est humiliant de recevoir de l’argent sans avoir à travailler. Ou encore, au sujet de la parentalité, les immigrés portugais pensent plus souvent qu’avoir des enfants est un devoir vis-à-vis de la société, que les couples homosexuels ne devraient pas pouvoir adopter d’enfants, et que les femmes célibataires ne devraient pas faire d’enfants. Mais comme l’a montré Charles Fleury (Reference Fleury2010a; 2010b), c’est surtout dans le niveau d’adhésion aux normes d’obligation familiale qu’au Luxembourg les différences entre les immigrés et les autochtones sont particulièrement marquées. En effet, les premiers trouvent davantage normal que les seconds que les enfants adultes prennent soin de leurs parents malades et ce, même lorsque l’aide qu’ils doivent fournir à leurs parents nuit à leur propre bien-être. En outre, les immigrés portugais sont plus nombreux à être d’accord avec l’idée qu’il faut toujours aimer et respecter ses parents, quels que soient leurs qualités et défauts, et avec l’idée selon laquelle les parents doivent toujours faire au mieux pour leurs enfants même aux dépens de leur propre bien-être. Pour toutes ces thématiques, les opinions des immigrés portugais divergent de celles des autochtones luxembourgeois. La seule fois où ce n’est pas le cas, c’est pour l’item qui demande si le mari et la femme doivent contribuer l’un et l’autre aux ressources du ménage. Toutefois, cette position sur les relations de couples est contrebalancée par une autre. A la question : est-ce que les hommes devraient assumer autant de responsabilités que les femmes en ce qui concerne la maison et les enfants, ce sont encore une fois les immigrés qui se montrent les plus conservateurs, puisqu’ils répondent un peu plus négativement que les Luxembourgeois.
Ce conservatisme dans les valeurs, qui se manifeste notamment par des liens familiaux plus forts et des normes d’obligation familiale plus prégnantes, est davantage l’apanage des pays du sud de l’Europe que ceux du pays du Nord et de l’Ouest, jugés plus individualistes (Attias-Donfut et Wolff, Reference Attias-Donfut and Wolff2009 ; Kalmijn et Saraceno, 2008 ; Daatland et Herlofson, 2003 ; Reher, Reference Reher1998). Pour expliquer ce phénomène, il peut être intéressant de mettre en relation les attitudes des individus avec les systèmes de sécurité sociale des pays dont ils sont originaires (Fleury, Reference Fleury2010a ; Masson, Reference Masson2009 ; ocde, 2011 ; Segalen, Reference Segalen2008 ; Esping-Andersen, 1999 ; Millar et Warman, Reference Millar and Warman1996). En effet, le Portugal, avec un régime de sécurité sociale de type méditerranéen, se caractérise par un faible niveau de pension publique, ce qui se traduit par de fortes attentes à l’égard de la solidarité familiale (Ogg et Renaut, Reference Ogg and Renaut2005 ; Wall et al., 2001 ; Ferrera, Reference Ferrera1996). Au contraire, au Luxembourg, le niveau des pensions est parmi les plus élevés d’Europe et les attentes à l’égard de la famille s’en trouvent réduites (Ametepe et Hartmann-Hirsch, 2010 ; Trausch, Reference Trausch2009).
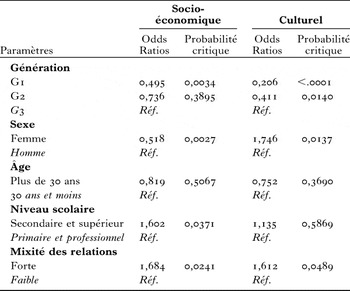
Il semblerait donc que le simple fait de résider au Luxembourg ait moins d’impact sur la constitution de valeurs « modernes » qu’y naître ou y avoir été socialisé très jeune, comme le laisse à penser l’absence d’écart significatif – dans la dimension culturelle – entre les enfants d’immigrés et les autochtones. Il est toutefois notable que cet écart devient significatif lorsque l’on introduit dans le modèle les variables de contrôle, alors que les autres résultats s’en trouvent peu modifiés (voir tableau 2). Donc, à sexe, âge, niveau scolaire et mixité des relations égaux, les descendants d’immigrés portugais ont moins de chances d’être « intégrés » culturellement que les autochtones luxembourgeois, mais plus de chances de l’être que leurs parents (environ 2,5 fois moins de chances contre 5 fois moins).
Probabilité relative d’être « intégré » dans les dimensions socio-économique et culturelle selon les générations d’appartenance (avec les variables de contrôle)

Total N = 383.
Source:
EVS, 2008.
Note de lecture:
les chances des immigrés portugais (G1) d’être « intégré » dans la dimension culturelle sont 0,206 fois moins élevées que celles des Luxembourgeois (G3), à sexe, âge, niveau scolaire et mixité des relations égaux.
L’analyse des variables structurelles montre que, toutes choses égales par ailleurs :
- les femmes ont 2 fois moins de chances que les hommes d’être intégrés dans la sphère socio-économique. Il est vrai que dans ce domaine, l’existence de discriminations et d’inégalités liées au genre est bien connue, au Luxembourg comme ailleurs (Leduc, Reference Leduc2011 ; Lejealle, Reference Lejealle2008). En revanche, dans la dimension culturelle, le fait d’être une femme joue un rôle positif sur l’intégration. Les femmes ont une plus grande probabilité que les hommes d’être porteuses de valeurs « modernes ».
- L’âge ne semble pas jouer de rôle sur l’intégration, que ce soit dans la dimension socio-économique ou culturelle.
- Au contraire, une mixité élevée dans les relationsFootnote 19 augmente les chances – d’un peu plus d’1,5 fois – d’intégration dans les deux dimensions concernées. Cette variable apparaît particulièrement importante pour les théoriciens de l’intégration par acculturation. En effet, pour eux, c’est la rencontre des immigrés et des autochtones qui leur permet de s’acculturer mutuellement et de construire des normes collectives négociées. Dès lors, cela expliquerait qu’une forte mixité des relations augmente la probabilité d’intégration dans la dimension culturelle. Cette rencontre serait notamment permise par le travail. Or on observe une relation positive entre l’intégration socio-économique et le niveau de mixité des relations. Notons que dans notre échantillon, à peine un peu plus de la moitié des immigrés portugais et des Luxembourgeois entretiennent des relations mixtes élevées, alors que c’est le cas pour 9 descendants d’immigrés sur 10. Ces derniers ont commencé à nouer des contacts avec des Luxembourgeois dès leur plus jeune âge, notamment à l’école. En outre, ils y ont appris le luxembourgeois, ce qui facilite les relations avec les autochtones. Par rapport à la « seconde génération », les immigrés portugais entretiennent relativement peu de contacts avec les Luxembourgeois. Pourtant, le contexte luxembourgeois est propice au développement des relations intercommunautaires. En effet, le pays jouit d’un faible niveau de ségrégation résidentielle (Lord et Gerber, Reference Lord and Gerber2009) : contrairement à la plupart des autres pays européens, les villes du Grand-Duché sont de petite taille,Footnote 20 on y retrouve très peu de logements sociaux, un faible taux de chômage, une population étrangère peu stigmatisée… Cette situation pourrait en partie s’expliquer par l’objectif migratoire des immigrés portugais qui est d’épargner suffisamment d’argent pour ensuite retourner vivre au Portugal (Beirão, Reference Beirão1999). Dès lors, avec un tel état d’esprit, une partie d’entre eux ne chercherait pas à nouer de relations profondes avec les autochtones. Aussi, on ne peut pas écarter l’hypothèse d’une trop forte divergence culturelle entre ces groupes – comme le font apparaître nos résultats – qui empêcherait la constitution de relations amicales suivies.
- Sans grande surprise, le niveau scolaire augmente les chances d’intégration socio-économique. On observe donc une relation positive entre le niveau scolaire et la sphère socio-économique, mais pas avec la dimension culturelle, le résultat n’étant pas significatif dans ce cas. Cette situation nous apparaît logique puisqu’il n’y a également pas de relation entre les sphères socio-économique et culturelle (voir tableau 3). En effet, ces deux variables semblent indépendantes, le coefficient de corrélation est proche de 0, quel que soit le groupe considéré.
Tableau 3Coefficient de corrélation linéaire (de Pearson) entre les dimensions socio-économique et culturelle

Total N = 383.
Source:
EVS, 2008.

Cette absence de dépendance entre les dimensions socio-économique et culturelle ne paraît pas compatible avec la théorie classique de l’intégration. À la lecture des résultats de notre régression logistique (voir tableau 2), on observe une relative proximité entre les valeurs des descendants d’immigrés portugais et celles des Luxembourgeois, au moins avec celles de la population autochtone qui appartient au même milieu social. En effet, l’écart observable dans le domaine culturel entre les immigrés portugais et les Luxembourgeois est moindre que celui entre ces derniers et les enfants d’immigrés. Dans la dimension socio-économique l’écart est absent. Mais l’indépendance entre les dimensions socio-économique et culturelle plaide plutôt en faveur de la segmentation de l’intégration puisqu’au niveau de l’individu, l’intégration dans un domaine n’entraîne pas nécessairement l’intégration dans un autre.
Afin d’approfondir la réflexion théorique de l’intégration portugaise au Luxembourg, nous avons poursuivi l’analyse en y introduisant la population portugaise résidant au Portugal. L’objectif est de voir si les résultats observés ci-dessus sont réellement le fruit d’un processus d’intégration particulier, ou si cette convergence des caractéristiques individuelles est davantage liée à une évolution naturelle – des mœurs par exemple –, c’est-à-dire à un effet de génération.
Les Portugais au Portugal
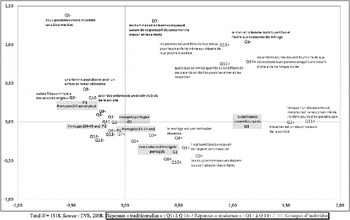
Pour ce faire, nous avons réalisé une analyse des correspondances multiples (acm) des 14 questions qui composent la dimension culturelle utilisée précédemment (voir annexe 2). Les réponses à chacune de ces questions indiquent, soit un comportement dit « moderne », soit « traditionnel ». Ce sont donc 28 points actifs qui ont participé au calcul des composantes (voir figure 1). Nous avons ensuite projeté 6 points illustratifs sur le plan afin de visualiser les attractions ou les oppositions qui les caractérisent. Ces 6 points représentent les trois « générations » déjà utilisées – les immigrés portugais (G1), leurs enfants (G2) et les autochtones luxembourgeois (G3) – ainsi que trois groupes de Portugais résidant au PortugalFootnote 21, répartis selon trois groupes d’âgeFootnote 22: les jeunes adultes (18-29 ans) (P1), les adultes (30-49 ans) (P2) et les plus âgés (50 ans et plus) (P3).
Représentation sur un plan factoriel des composantes de la dimension culturelle

L’axe 1 et l’axe 2 marquent tous les deux une opposition entre les réponses dites « traditionnelles » et celles dites « modernes », de gauche à droite d’une part, et de haut en bas d’autre part.
De manière générale les points qui représentent les Portugais qui résident au Portugal sont proches les uns des autres et se situent dans la partie où se regroupent l’essentiel des réponses traditionnelles. Cependant, plus les individus sont jeunes et plus ils tendent à se rapprocher des valeurs modernes. Autrement dit, les valeurs au sein de la société portugaise semblent se moderniser au fil des générations. À proximité de ces points, de ceux des adultes et des individus les plus jeunes en particulier, se trouve celui qui représente les immigrés portugais. Notons qu’une analyse par âges détaillés de cette catégorie réduit la distance qui la sépare des Portugais n’ayant pas émigré. Cela signifie que les immigrés portugais conservent les valeurs de leur pays d’origine sans qu’il y ait d’acculturation avec les Luxembourgeois. Au contraire, ces derniers, comme l’a montré la modélisation logistique, sont porteurs de valeurs plus modernes. Le cas des enfants d’immigrés portugais est particulièrement intéressant. Ils se montrent pratiquement aussi modernes que les Luxembourgeois sur certains sujets – voire davantage, comme sur la question de la religion ou de l’égalité des relations de couples par exemple – tout en se montrant nettement plus traditionnels parfois, notamment par rapport aux normes d’obligation familiale (comme sur la question de la responsabilité des enfants adultes lorsque leurs parents ont besoin d’assistance ou sur l’amour et le respect qu’ils doivent fournir à leurs parents quels que soient leurs qualités et défauts). Il semblerait donc que l’acculturation ait des difficultés « à pénétrer » la sphère familiale. Par conséquent, ils se situent dans une situation intermédiaire entre le conservatisme de leurs parents – ainsi que celui de leurs concitoyens restés au pays – et la modernité qui qualifie les Luxembourgeois.
Au regard des théories de l’intégration présentées ci-dessus, plusieurs interprétations sont permises :
- Du point de vue de la théorie classique de l’intégration, on peut considérer que les caractéristiques des descendants d’immigrés ont en partie convergé vers celles de la société d’accueil, tout en s’éloignant de celles des Portugais résidant au Portugal. À terme, il se pourrait que leur descendance proche (enfants, petits-enfants ?) rompe complètement avec la culture de leurs ancêtres au profit des valeurs luxembourgeoises. Toutefois, nous avons vu que l’absence de convergence des dimensions socio-économique et culturelle renvoie plutôt à une intégration segmentée. Mais si l’on se place du point de vue de la théorie élaborée par Milton Gordon (Reference Gordon1964), l’inexistence de la dimension socio-économique dans sa typologie et le rôle primordial qu’occupe l’assimilation structurelle – que l’on pourrait identifier à la variable « mixité des relations » dans notre modèle – nous empêche de rejeter complètement cette théorie.
- La théorie de la segmentation permet d’interpréter l’intégration portugaise sur le mode du pluralisme culturel, qui se manifeste à la fois par une mobilité sociale ascendante et une absence d’acculturation. En effet, on peut considérer que les descendants d’immigrés ont amélioré leur condition sociale par rapport à leurs parents, pour converger vers celle des Luxembourgeois qui appartiennent à un milieu social similaire. En revanche, on peut envisager leur situation culturelle « hybride » comme une absence d’acculturation totale, notamment si elle se maintient en l’état au fil des générations suivantes.
- Enfin, on peut interpréter l’intégration des descendants d’immigrés portugais comme une acculturation mutuelle avec les Luxembourgeois. La position intermédiaire qu’ils occupent dans le champ des valeurs serait la « photographie » de la dynamique en cours visant à construire des ensembles identitaires communs. Si en théorie, c’est l’individu doté d’un arrière-fond migratoire qui subit l’altération culturelle la plus forte, il est difficile d’établir dans quelle mesure le groupe dominant, c’est-à-dire les autochtones, a connu un changement culturel. Car même en comparant l’évolution des caractéristiques, il est difficile de capter la part du changement qui revient à l’acculturation mutuelle de celle qui est le résultat d’une évolution endogène.
Cet article nous montre la difficulté d’interprétation du mode d’intégration, à travers les théories existantes, des Portugais nés – ou socialisés très jeunes – au Luxembourg de parents qui ont émigré du Portugal. Nous avons vu qu’une partie importante des descendants d’immigrés portugais connaissent une amélioration de leur situation socio-économique, par rapport à celle de leurs parents, pour se rapprocher des normes luxembourgeoises. L’écart qui les sépare encore pourrait disparaître par l’adoption de la nationalité luxembourgeoise, permise par la loi du 23 octobre 2008 qui leur offre la possibilité de devenir Luxembourgeois sans renier la nationalité portugaise, héritage familial auquel ils restent attachés. En effet, ils pourraient accéder aux emplois publics protégés et rémunérateurs, sous réserve de posséder des connaissances suffisantes dans les trois langues officielles du pays. En parallèle, leur identité culturelle semble s’être construite à un niveau intermédiaire entre le pays de naissance de leurs parents et le Luxembourg. Leurs connaissances linguistiques illustrent bien cette construction « hybride » de leur identité. Leurs parents leur ont transmis le portugais et ils ont appris les langues du pays à l’école. En conséquence, connaissant plusieurs langues, mais sans en maîtriser vraiment aucune parfaitement, la plupart d’entre eux parlent une sorte de « pidgin’ franco-portugais-luxembourgeois » (Hartmann, Reference Hartmann1988).
Nous verrons à plus long terme, avec les générations suivantes, si les Portugais-Luxembourgeois empruntent une voie qui les mène plutôt vers une intégration dite classique, segmentée, ou interactive. Cependant, la question que l’on peut se poser est celle de la forme préférable que l’intégration devrait prendre pour permettre une cohésion sociale optimale au sein de la société luxembourgeoiseFootnote 23, et donc, de la politique sociale qui doit être menée pour y parvenir. A priori, une intégration dans sa forme classique, où les individus deviennent indiscernables les uns des autres d’un point de vue culturel peut apparaître séduisante. L’absence de différences trop marquées devrait se traduire par une forte cohésion sociale et nationale. Cependant, comme le font remarquer de nombreux chercheurs (Lapeyronnie, Reference Lapeyronnie1993, Augé, Reference Auge1994, Touraine, Reference Touraine1997), une pression normative excessive risque de susciter en réaction le rejet de l’acculturation à la société d’accueil. Dès lors, l’intégration ne serait possible que dans un cadre global qui permettrait la conciliation des univers culturels de la famille et du pays d’accueil. Le Luxembourg offre aujourd’hui un environnement qui favorise cette conciliation, à la fois par un contexte et une politique qui n’entrave pas, voire soutient cette interculturalité et par l’attitude plutôt bienveillante de la société envers l’immigration. Toutefois, on peut se demander si, à l’avenir, une progression du chômage, la remise en cause du généreux système de sécurité sociale grand-ducal ou l’immigration d’une population extra-européenne réputée – à tort ou à raison – difficile à intégrer, pourrait bouleverser cet équilibre dont ont bénéficié les immigrés portugais, en particulier leur descendance qui, comme on l’a vu, sont sur la voie de l’intégration, quelle que soit la définition qu’on lui donne.
Annexe 1 : Répartition des « générations » dans les composantes de la dimension économique
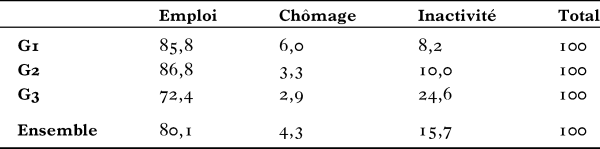
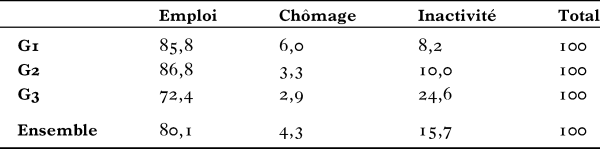
Les immigrés portugais (G1) et leurs descendants (G2) occupent plus fréquemment un emploi que les autochtones (G3). Ces derniers enregistrent un taux d’inactivité nettement plus élevé que les Portugais (voir tableau A.1.1). Cela peut s’expliquer en partie par un effet d’âge : certains autochtones appartiennent à des générations pour lesquelles il était d’usage que les femmes ne travaillent pas et s’occupent d’activités domestiques. La raison complémentaire est que les Portugais, hommes et femmes, ont immigré au Luxembourg pour travailler et épargner dans l’espoir de retourner au pays, donc pour ne pas être inactifs. En ce qui concerne le chômage, les taux sont faibles, mais les immigrés y sont davantage exposés que les autres.
Statut d’activité selon les « générations » (%)
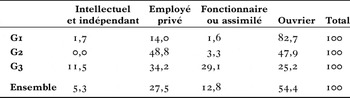
L’échantillon étudié regroupe des individus qui proviennent d’un milieu modeste, avec des parents dotés d’un faible niveau scolaire et qui ont rarement poursuivi des études supérieures, au profit d’études professionnelles ou de niveau secondaire. Il en découle une très faible proportion de travailleurs intellectuels ou indépendants que l’on trouve essentiellement parmi les autochtones (voir tableau A.1.2). Cela pourrait s’expliquer, là aussi, par un effet d’âge : étant en moyenne plus âgés que les Portugais, les Luxembourgeois ont pu profiter d’avancements conditionnés à l’ancienneté.
Situation socio-professionnelle des actifs occupés selon les « générations » (%)

De même, la quasi-totalité des individus qui occupent un poste de fonctionnaire ou assimilé sont autochtones. Précisons que le Luxembourg est un État officiellement multilingue dans lequel la maîtrise de la compétence légitime multilingue (français, allemand, luxembourgeois) préside aux critères d’embauche dans l’administration publique, ce qui en fait un secteur protégé, réservé aux détenteurs du capital linguistique rare que constitue la maîtrise des trois langues usuelles du pays (Fehlen, Reference Fehlen2009). Le secteur public attire d’autant plus les autochtones qu’il distribue des rémunérations supérieures à celles qu’ils pourraient espérer dans le secteur concurrentiel, compte tenu de leur niveau d’éducation (Hartmann-Hirsch, Reference Hartmann-Hirsch2008).
Cette segmentation du marché du travail laisse les emplois aux conditions difficiles majoritairement aux étrangers, notamment aux immigrés portugais qui sont sur-représentés parmi les ouvriers. Toutefois, leurs enfants bénéficient d’une relative mobilité sociale ascendante puisque seule une moitié d’entre eux sont ouvriers, l’autre moitié est employée dans le secteur privé.
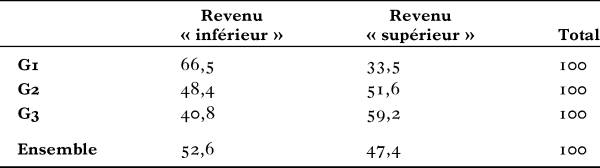
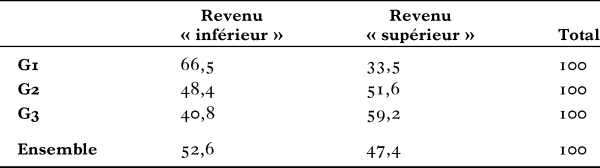
Nous avons construit un indice de revenu que l’on considère comme « inférieur » si les individus qui appartiennent à un ménage d’une seule personne disposent d’un revenu inférieur à 2000 € par mois, 2500 € pour deux, 3000 € pour trois, et 4000 € pour quatre personnes ou plus. Dans les autres cas, il est dit « supérieur ». La définition du revenu est large, elle englobe toutes les rentrées d’argent dans le foyer : salaires, allocations familiales, pensions... Cette typologie montre que les autochtones ont en moyenne des revenus supérieurs à ceux des « secondes générations » de Portugais, eux-mêmes disposant de revenus supérieurs à ceux de leurs parents (voir tableau A.1.3). Cette situation dépend principalement de la situation socioprofessionnelle : les fonctionnaires ont en moyenne des revenus supérieurs à ceux des employés et les ouvriers sont les moins biens rémunérés.
Indice de revenu selon les « générations » (%)
Annexe 2 : Répartition des « générations » dans les composantes de la dimension culturelle
La dimension culturelle est abordée à travers 14 questions relatives aux valeurs des individus sur le travail, la famille ou la religion. Les questions sont les suivantes :