1. Introduction
China's growth has significantly improved the country's living standards, but has brought serious damage to its environment. China's air and water, particularly in urban areas, are among the most polluted in the world. Ambient concentrations of most pollutants exceed international standards several times over burdening China with vast human and economic costs. In addition, China's sheer size, together with its speed of growth, means that its environmental problems spill over to the rest of world, not only through cross-border pollution in the form of acid rain and dust storms but also in contributions to global warming and damage to the ozone layer. China's prospects for controlling environmental damage is not, therefore, just a domestic issue; it must be a concern for the rest of the world as well.
Two forces are responsible for much of China's environmental degradation. The first is China's extreme dependence on coal. Today, coal satisfies more than 60 per cent of China's demand for energy, making China the world's largest coal consumer. The second factor is China's booming cities. Rising urbanization, accompanied by increased automobile use and largely untreated emissions of municipal waste, has increased the portion of the population exposed to the greater pollution found in urban areas.
The government has recognized the environmental challenges confronting the country, and over the past decade has established environmental authorities and introduced a comprehensive legal framework to protect the environment. It has also invested considerable resources in protecting its air and water. It is said that these efforts can claim some successes, but much remains to be done. In fact, according to reports on the state of the environment in China by the State Environmental Protection Administration, the government of China, for both water and air quality, some percentage of monitoring sections of the seven major rivers and cities still remains at extremely polluted levels, although the percentage with higher grade standards rose, and the percentage with lower grade standards fell from 2001 to 2005.
One crucial issue seems to be the problems of the implementation of the local level environmental protection. MacBean (Reference MacBean2007) argues that despite the mass of laws and policy tools in place in China and the wide spread of environmental officials throughout the country it seems that compliance with regulations is poor. It points out, as the main reasons, the higher value placed on conventionally measured economic growth and job maintenance or expansion by other departments and local governments. What is more serious is that there is ample evidence of domestically created ‘pollution haven’ by the big cities; moving out the polluting industries from the city areas to rural and other less developed provinces through the interjurisdictional competition for polluted industries within China. China's environmental prospects, therefore, appear to depend highly on how each region addresses the problems of the implementation of environmental protection.
The purpose of this study, with a focus on regional environmental states in China, is to examine statistically whether regional latecomers suffer the domestically created ‘pollution haven’ effect through the interjurisdictional competition for polluted industries within China, or enjoy the spillover effect of nationwide progress in environmental management and technology. In short, this study intends to verify whether underdeveloped regions enjoy a so-called latecomer's advantage or suffer its disadvantage in the area of environmental management and technology. The analytical framework of the Environmental Kuznets (EK) curve is used to arrive at a conclusion. We focus on the per capita emission of waste gas, wastewater, and solid wastes as environmental indices of Chinese provinces. In the following sections, we will first review previous studies and clarify this paper's position (section 2), present our own empirical study (section 3), and end with some concluding remarks (section 4).
2. Previous studies, our position
The EK curve provides an analytical framework to examine how economies deal with environmental issues. The curve postulates an inverted-U relationship between pollution and economic development. At early stages of development, environmental quality deteriorates with increases in per capita income, while at higher levels of development, environmental degradation is seen to decrease with further increases in per capita income. Kuznets's name was apparently attached to the curve by Grossman and Krueger (Reference Grossman, Krueger and Garber1993) who noted its resemblance to Kuznets inverted-U relationship between income inequality and development. Dasgupta et al. (Reference Dasgupta, Laplante, Wang and Wheeler2002) describe the process as conceived by the ‘conventional’ explanations for the inverted-U relationship in the following way: In the first stage of industrialization, pollution grows rapidly because people are more interested in jobs and income than in clean air and water, communities are too poor to pay for abatement, and environmental regulation is correspondingly weak. Along the curve, pollution per capita levels off in the middle-income range and then falls toward pre-industrial levels in wealthy societies. It is because leading industrial sectors become cleaner, people value the environment more highly, and regulatory institutions become more effective.
2.1. Empirical testing of the EK curve, debates
The issue of the EK curve was first discussed in the World Bank's (1992) World Development Report. Since the World Bank's report, there have been numerous empirical tests and theoretical debates on the EK curve. Empirical evidence has been accumulating, supporting the validity of the EK curve for some regions and environmental problems. Grossman and Krueger (Reference Grossman and Krueger1995) found an EK-curve relationship between the per capita GDP and urban air quality (the concentration of suspended particulate matter (SPM) and sulfur dioxide (SO2)), while Selden and Song (Reference Selden and Song1994) discovered the existence of an EK-curve relationship for the aggregate emissions of SPM, SO2, oxides of nitrogen, and carbon monoxide. The theoretical works have also shown that an EK curve can result if a few plausible conditions are satisfied as income increases in a society. At the first stage, Grossman and Krueger (Reference Grossman and Krueger1991) argued that economic growth affects the quality of environment in three different channels of scale effects, technological effects, and composition effects. Lopez (Reference Lopez1994) used a fairly general theoretical model to show that if producers pay the social marginal cost of pollution, then the relationship between emissions and income depends on the properties of technology and preferences. Stokey (Reference Stokey1998) made a theoretical contribution to the explanation of the EK curve using dynamic growth models.
Since the mid 1990s, however, the EK curve has been attacked on empirical, methodological, and interpretative grounds. From an empirical aspect, Shafik (Reference Shafik1994) presented more ambiguous results, seemingly implying that the EK curve may not hold at all times and for all pollutants. Furthermore, empirical research has been limited to the environmental problems for which data exist, such as the concentration of pollutants in urban areas. It has also methodologically been shown that the very existence of an EK curve is questionable; the EK curve may well arise as a ‘methodological artifact’ (Nahman and Antrobus, Reference Nahman and Antrobus2005). The methodological problem of cross-sectional approach will be discussed later. One of the most damaging criticisms of the EK curve that advocates caution in interpreting its causes and implications is based on the linkage between the EK curve and the international trading of industrial goods. Suri and Chapman (Reference Suri and Chapman1998) and Rothman (Reference Rothman1998), notably, argued that the EK curve might arise due to the relocation of ‘dirty’ industries to developing countries as a country reaches higher levels of development. Nahman and Antrobus (Reference Nahman and Antrobus2005) stated that the EK curve may thus be no more than a ‘historical artifact.’
2.2. Frontiers of EK-curve studies
Most of the empirical studies so far have concentrated on validating the EK-curve hypothesis and its requirements, using cross-sectional data. This cross-sectional approach adopted by most studies might, as Borghesi (Reference Borghesi1999) argued, be misleading, since environmental degradation is generally increasing in developing countries and decreasing in industrialized ones; the EK curve within the cross-sectional framework might reflect the mere juxtaposition of two opposite trends rather than describe the evolution of a single economy over time.
One of the frontiers of EK-curve studies, thus, is to examine the EK curves of specific countries using time-series data, to compare them in terms of the height and timing of their peaks, their shapes, etc., and to investigate the causes of different EK-curve patterns. De Bruyn et al. (Reference De Bruyn, van den Bergh and Opschoor1998), noticing that conventional cross-section estimation techniques have generated spurious estimates of the EK curve, estimated time series models individually in four countries (the Netherlands, UK, the United States, and then West Germany) for three types of emissions: carbon dioxide, nitrogen dioxide, and sulfur dioxide (CO2, NOx, and SO2) and showed that the time patterns of these emissions correlate positively with economic growth, and that emission reductions may have been achieved as a result of structural and technological changes in the economy. Irie et al. (Reference Irie, Kobayashi and Morita2000) tested the empirical validity of the EK curves of individual countries for SO2, using relevant time-series data from 30 developed countries (OECD countries and the former Soviet Union). The main findings were that: (1) the EK curves were verified for SO2 emissions in 17 countries, (2) the EK curves varied in the shape of their trajectories and the height and timing of their peaks, and (3) the differences in height can be explained by five factors: the technology available in the country, the scale of the economy, the quality of the fuel used, the leading industries, and the political system.
This time-series approach has been developed, as Dasgupta et al. (Reference Dasgupta, Laplante, Wang and Wheeler2002) argued, to examine the hypothesis that developing societies, by utilizing progressive environmental management and the technologies of more advanced countries, might be able to experience an EK curve that is lower and flatter than what conventional wisdom would suggest; they might be able to develop their economies from low levels of per capita income with little degradation in environmental quality, and then at some point experience improvements in both income and environmental quality. Concerning environmental management, Panayotou (Reference Panayotou1997) – formulating a tentative equation for a sample of 30 developed and developing countries for 1982–1994 – found that effective policies and institutions can significantly reduce environmental degradation at low income levels and speed up improvements at higher income levels, thereby lowering the EK curves, at least for ambient SO2 levels. Matsuoka et al. (Reference Matsuoka, Matsumoto, Kawauchi and Iwase2000) compared the EK curves of various Asian countries and explained the differences in their height by the dissemination of environmental monitoring systems in those countries. As for environmental technology, Martin and Wheeler (Reference Martin, Wheeler and Low1992) argued that, because increased openness to trade tends to lower the price of cleaner-imported technologies while increasing the competitive pressure to adopt them, firms in relatively open developing economies adopt cleaner technologies more quickly.
One counter-argument to this hypothesis of the latecomer's advantage is the well-known ‘pollution haven’ hypothesis. For example, Dasgupta et al. (Reference Dasgupta, Laplante, Wang and Wheeler2002) argues that the relatively high environmental standards in high-income economies impose high costs on polluters, and shareholders pressure the firms to relocate to low-income countries, whose people are so eager to get jobs and income that their environmental regulations are weak or nonexistent. The scenario may not shift the latecomers’ EK curves downward; on the contrary, it may even lift them.
2.3. Application of the EK-curve analyses to China
Although there has been a large body of literature on the EK-curve studies for several countries and for several environmental quality indices as shown above, it is in recent times that the studies on the EK curve of China have increasingly appeared in the literature. Shen and Hashimoto (Reference Shen and Hashimoto2004) investigated whether the EK-curve hypothesis may exist on a country level by using the cross-province panel data of the seven pollutants of China, and found that the EK-curve hypothesis is verified in five of these pollutants, while the other two reveal an N-shape relationship between pollutant emission and per capita income. Liu et al. (Reference Liu, Heilig, Chen and Heino2007) showed that, by utilizing environmental monitoring data from Shenzhen on concentration of pollutants in ambient air, main rivers, and nearshore waters from 1989–2003, production-induced pollutants support EKC while consumption-induced pollutants do not. Shen (Reference Shen2006), by using Chinese provincial data from 1993–2002 to investigate the relationship between per capita income and per capita pollutant emission based on a simultaneous equation model, reported that an EKC relationship is found in COD, arsenic, and cadmium emissions, but SO2 shows a U-shaped curve and ‘dust fall’ indicates no relationship. Song et al. (Reference Song, Zheng and Tong2008), the latest study in the literature, reexamined the relationship between environmental pollution and economic growth in China through a sophisticated method of a panel cointegration approach with Chinese provincial data over 1985–2005. They found that there is a long-run cointegrating relationship between the per capita emission of waste gas, wastewater, and solid wastes and the per capita GDP; all three of these pollutants are inverse U-shaped.
All these studies discussed above stay at the stage of examining the validation of the EK-curve hypothesis and its requirements, but do not appear to step forward into the analyses of regional latecomer's effects – the domestically created ‘pollution haven’ effect or the spillover effect of nationwide progress in environment management and technology in the framework of the EK curve. As for the ‘pollution haven’ issues of China in the global context, most studies have focused on the relationship between environment and international trade or foreign direct investments (FDI). They investigate whether China has become a ‘pollution haven’ of polluted industries when so many industries have been transferred from developed countries to China. A hypothesis is that these transferred industries are mostly dirty because China has relatively less strict environment regulations than developed countries. Recent studies tend to think China has not become a ‘pollution haven’ because increased FDI and production fragmentations have contributed positively to the decline in the pollution intensity of China's trade (see Dean and Lovely, Reference Dean and Lovely2008). The possible interjurisdictional competition for polluted industries within China, however, has been neglected.
This paper, with a focus on regional environmental states in China, tries to examine whether regional latecomers suffer the domestically created ‘pollution haven’ effect through the interjurisdictional competition for polluted industries within China, or enjoy the spillover effect of nationwide progress in environmental management and technology, by using the analytical framework of the EK curve. In other words, this study will verify the existence of the latecomer's advantage or disadvantage in underdeveloped provinces in the area of environmental management and technology. Our contribution to the EK-curve literature may consist in challenging a regional analysis within China in the context of the regional latecomer's effects on environment. As regional environmental indices, the per capita emission of wastewater, waste gas, and solid wastes in the provincial level will be examined in the following section.
3. Empirical studies
We now turn to the empirical studies within the analytical framework of the EK curve. Our analysis consists of two steps. First, we will simply overview the relationships between per capita real GDP and environmental indices in Chinese provinces. We then move to a regression analysis using provincial panel data to examine the existence of the EK-curve pattern and to see whether the latecomer's advantage or its disadvantage dominates in the environmental management of undeveloped Chinese provinces.
3.1. Data
In our empirical analysis, we collect data from 29 provinces in mainland China from 1988–2007. All provincial data are available in the China Statistical Yearbook. We select 29 of the 31 provinces under the administration of the central government: Beijing, Tianjin, Hebei, Shanxi, Inner Mongolia, Liaoning, Jilin, Heilongjiang, Shanghai, Jiangsu, Zhejiang, Anhui, Fujian, Jiangxi, Shandong, Henan, Hubei, Hunan, Guangdong, Guangxi, Hainan, Sichuan, Guizhou, Yunnan, Shaanxi, Gansu, Qinghai, Ningxia, and Xinjiang. ChongQing and Tibet are excluded because ChongQing data have been separated from Sichuan data in 1996 or 1997 and Tibet data are not available in most years.
We use the provincial GDP per capita (yuan) as the economic indicators, and the provincial industrial emissions per capita as the environmental indicators: wastewater (ton), waste gas (cubic meter), and solid waste generated (ton). Industrial waste gas emissions per capita have three components: sulfur dioxide discharged (ton), soot discharged (ton), and dust discharged (ton). Considering that provincial GDP data included in the Yearbook are at current prices, they have to be converted into fixed prices. We adjusted all provincial GDP data by deflating the provincial Consumer Price Index in 2000.Footnote 1
3.2. Overview of the time-series EK curves in sample provinces
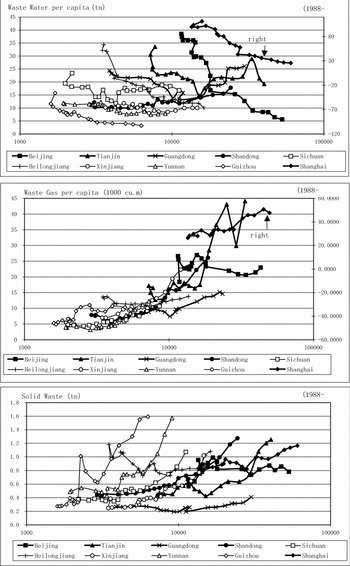
Figure 1 indicates the time series relationships between per capita real GDP and environmental indices in main samples of Chinese provinces. It is in the case of wastewater that the assembly of the provincial trajectories clearly creates inverted-U shape patterns. The locations of the provincial trajectories represent a clear contrast: the downward shifts of the provincial trajectories from the higher-income provinces to the lower-income provinces are observed in the case of wastewater, while upward shifts are seen in the cases of waste gas and solid waste. The GDP-emissions relationships described above may produce different implications among wastewater, waste gas, and solid waste. This point will be statistically clarified through panel estimations in the following section.
The EK curve on wastewater, waste gas, and solid waste in main provinces

3.3. Regression analysis using provincial panel data
We will now move to a regression analysis using provincial panel data to examine the existence of the EK-curve pattern and to see whether the latecomer's advantage or its disadvantage dominates in the environmental management of undeveloped Chinese provinces.
Methodology
We will first clarify some methodological points related to our analysis. To study the relationship between pollution and growth, there are two possible approaches to model construction. One is to estimate a reduced-form equation that relates the level of pollution to the level of income. The other is to model the structural equations relating environmental regulations, technology, and industrial composition to GDP, and then to link the level of pollution to the regulations, technology, and industrial composition. We here take the reduced-form approach for the following reasons. First, the reduced-form estimates give us the net effect of a nation's income on pollution. If the structural equations were to be estimated first, one would need to solve backward to find the net effect. Moreover, confidence in the implied estimates would depend on the precision and potential biases of the estimates at every stage. Second, the reduced-form approach spares us from having to collect data on pollution regulations and the state of the existent technology, which are not always available. Although a reduced-form relationship gives no indication of the direction of causality – namely, whether growth affects the environment or the other way around – we think that the reduced-form relationship between pollution and income is an important first step.Footnote 2
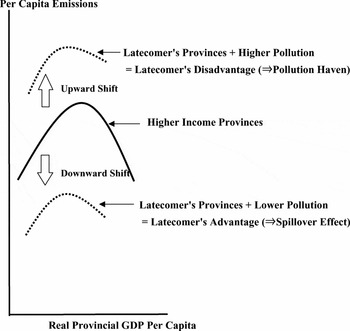
We then specify the reduced-form equation by basically following the traditions of the literatures like Grossman and Krueger (Reference Grossman and Krueger1995) and Selden and Song (Reference Selden and Song1994), and adding appropriate variables in accordance with our analytical interests. Our specific concern regarding the EK curves for the sample provinces in China is whether the provincial EK-curve trajectories have shifted downward or upward from the higher-income provinces to the lower-income provinces, depending on the dominance of either the latecomer's advantage or its disadvantage;Footnote 3 in other words, whether the levels of environmental pollution have been affected not only by the level of per capita income following the EK curve, but also by the speed of development among the provinces. If a sample province reaches a certain level of development later among the provinces and then lowers its environmental pollutants, we speculate that the province does not repeat the EK-curve trajectories already experienced by the developed provinces; it should enjoy the latecomer's advantage by absorbing the progress in environmental know-how, skills, and technology. On the contrary, if the later development in sample provinces is linked with higher pollution, the provinces may suffer from the disadvantage caused by the ‘pollution haven’ scenario (see figure 2). Therefore, we will include a term representing the speed of development among the provinces into the ordinary regression model of the EK curve, to identify the regional latecomer's effects. The speed of development of a sample province in a certain year is specified as the ratio of the GDP per capita of that province relative to the maximum GDP per capita among provinces (equivalent to the GDP per capita of Shanghai province) in that year.
The EK curve and latecomer's effects

Another variable that seems to be important in the time series EK-curve analysis is concerned with a nationwide time effect in environmental management and technology. For example, the more recent, the more technological transfer China may have received as a developing country, or the more pollution China may have suffered from through the ‘pollution haven’ scenario in the world. The variable on a nationwide time effect can be specified as a time-trend, which is simply represented by the number of years.
Based on analytical interests mentioned above, we specify the modified EK-curve model as follows:

where i is the province index, t is the time index, and e is the error term. The dependent variables EMS is a measure of the per capita industrial emissions: wastewater (WWP), waste gas (WGP), and solid waste generated (SWP). The per capita waste gas emissions has three components: sulfur dioxide discharged (SUP), soot discharged (SOP), and dust discharged (DUP). As for the independent variables, GDP is the real provincial GDP per capita. SPEED represents the speed of provincial development, specifically the ratio of the GDP per capita of a certain province relative to the maximum GDP per capita among provinces in a certain year – the lower SPEED means the later regional development. YEAR, a nationwide time effect in environmental management and technology, is indicated by number of years as a time trend.Footnote 4 Dummy variable is for capturing the effect of regulations of central government on environment. The water, air, and solid waste pollution prevention and control law was promulgated in 1984, 1987, and 1995 respectively (World Bank, 2001). The regulation-starting year only for the solid waste pollution is within the estimation range from 1988 to 2007, thus the dummy after 1995 is included for the solid waste estimation. How completely the provincial governments implement those regulations, however, could be endogenous.
To verify the inverted-U shapes of the EK-curves, the signs and magnitudes of α1 and α2, the coefficient of GDP should be examined. Environmental emissions can be said to exhibit a meaningful EK curve with the real GDP per capita, if α1 > 1 and α2 < 0, and if the turning point, −α1/2α2, is a reasonably low number. Of particular importance is the coefficient of SPEED, α3, which is useful for identifying the dominance of the latecomer's advantage or its disadvantage at the provincial level. The positive sign of α3, the lower pollution with the later regional development shown by the downward shift of the latecomers’ trajectories, indicates that the latecomer's advantage surpasses its disadvantage. On the other hand, the negative sign of α3, the higher pollution with the later regional development indicated by the upward shift of the latecomers’ curve, reveals the dominance of the latecomer's disadvantage. The coefficient of YEAR, α4, would have negative sign in case China, as a nation, enjoys the nationwide technological progress and positive sign when she suffers from the ‘pollution haven’ effect in the world. The coefficient of Dummy variable, α5, would have negative sign, since the central government regulations are expected to reduce the per capita industrial emissions.
We posit the following assumption as shown in Selden and Song (Reference Selden and Song1994), behind the very simple model – the exclusion from equation (1) of explanatory variables other than real GDP per capita, speed of development, and nationwide technological progress. It is important to distinguish between variables that are the endogenous consequences of growth and other, more exogenous factors. Potential examples of the former include the composition of output and the level of education. These factors should be omitted from this single-equation model, insofar as our objective is to assess both the direct and the indirect consequences of growth.
Of course, there are also likely to be exogenous factors that affect emissions. For instance, climate and geography vary widely among provinces and may well be correlated with emissions. Insofar as these factors cause the error term e to be correlated among provinces for a given period, pooled cross-section estimates that ignore this correlation will be inefficient. To capture those factors that are not randomly distributed among provinces, we adopt a fixed-effects estimation on all emissions.
Estimation results and interpretations
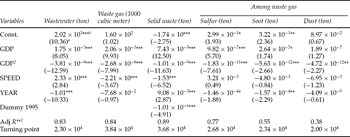
Table 1 lists the results of the estimation on the per capita industrial emissions of wastewater, waste gas, and solid waste generated. First, we must verify the shape of the EK curve of each emission index. In all the cases, the estimates for the coefficients α1 and α2 have the signs of the inverted-U shapes, which are different from zero as high levels of significance, and the turning point indicates a feasible number around 30,000 yuan per capita. All the indices for the industrial emissions can, therefore, be said to reflect a meaningful, inverted-U shaped EK curve with the real GDP per capita in sample provinces. Second, we must see if the latecomer's EK trajectories show a downward shift or an upward shift, namely whether the regional latecomer's advantage or its disadvantage dominates in the environmental management of latecomer's provinces. In the case of wastewater, the estimate for the coefficient of SPEED, α3, is positive and discernable, thereby representing the downward shift of the latecomer's trajectories and the dominance of the regional latecomer's advantage. On the other hand, the case of total waste gas and solid waste generated has the negative and discernable coefficient of α3, showing the upward shift of the latecomer's trajectories, the dominance of the regional latecomer's disadvantage. Third, we must identify a nationwide time effect in environmental management and technology. In the case of waste water, sulfur dioxide discharged and soot discharged, the coefficient of YEAR, α4, is negative and discernable, thereby representing the nationwide technological progress. Lastly, the Dummy variable for the solid waste estimation has the negative and discernable coefficient as expected.
Estimation results using provincial panel data

Notes:
a The t-value is shown in parentheses.
b One, two, or three asterisks indicate that a coefficient estimate is significantly different from zero at the 10, 5, or 1% level, respectively.
Sources: China Statiscal Yearbook (1889–2008).
The estimation results above can be interpreted as follows: First, the provincial panel data proved the validity of the EK-curve hypothesis in all the industrial emissions in China. Since the panel data include more provinces than periods, however, the inverted-U shape relationship might still be a ‘methodological artifact’; the mere statistical description of the fact that China has both many relatively developed provinces and many developing provinces.
Second, the regional latecomer's advantage was verified in the case of wastewater discharged, while its disadvantage was identified in waste gas emissions and solid waste generated. The contrasting result appears to come from the difference in environmental policy performances against each emission. The pollution levy system, covering the pollution charges for water, air, and solid waste, is one of the most representative pollution control policies. However, the system is often criticized for having design deficiencies: pollution fees are often lower than the marginal cost of abatement required to meet emission standards, and pollution levies are assessed only on above-standard emissions. Industrial enterprises choose to remain noncompliant and pay the levy only on their excess pollution (World Bank, 2001). As far as the levy on water pollution is concerned, however, its level is reported to be higher than the marginal abatement costs in many cases (Wang and Wheeler, Reference Wang and Wheeler1996), and also to have been assessed not on above-standard emissions but on total volume of emissions since 1993 (Matsuoka, Reference Matsuoka2000). In these senses, water pollution control may have been well designed compared with the air and solid waste pollution control.Footnote 5 This difference in policy performances may have created the contrasting result on regional latecomer's effects between the case of wastewater and that of waste gas and solid waste. Regional latecomers may have enjoyed the dissemination effect of nationwide progress in water pollution control, while the latecomers may have stayed behind from the progress or even suffered from the ‘pollution haven’ effect in air and solid waste pollution. In cases where pollution leakage among provinces occurs in the area of waste gas emission and solid waste, the estimated EK curve with inverted-U shape may be unsustainable, namely a ‘historical artifact.’
Third, nationwide technological progress was identified in the case of wastewater, sulfur dioxide discharged, and soot discharged. The effect seems to reflect the fact that China, as a developing country, is obtaining the technological transfer in water and air pollution control from advanced countries through governmental cooperation and private direct investment. For example, the Japanese government has provided official development aid (ODA) in the area of environmental protection, including air and water pollution control, as a top priority. Especially, the ‘Environmental Development Model City Project,’ which has been promoted since 1997 based on Japan-China governmental agreement, has contributed to the enhancement of acid rain preventive measures and the measures for effective use of desulfurized by-products (OECC, 2001).
4. Concluding remarks
In this study, using the analytical framework of the EK curve, we set out to examine, with a focus on regional environmental states in China, whether regional latecomers suffer the domestically created ‘pollution haven’ effect through the interjurisdictional competition for polluted industries within China, or enjoy the spillover effect of nationwide progress in environmental management and technology. The analysis focused on such industrial emissions as wastewater, waste gas (sulfur dioxide discharged, soot discharged, and dust discharged as its components) and solid waste in Chinese provinces. We carried out a regression analysis using provincial panel data to see whether the latecomer's advantage or its disadvantage dominates in the environmental management of undeveloped Chinese provinces.
The study's main findings are as follows. First, the regional latecomer's advantage was verified in the case of wastewater, while its disadvantage was identified in waste gas and solid waste. Second, a nationwide technological progress was identified in the case of wastewater, sulfur dioxide, and soot. We speculate that the contrasting result on regional latecomer's effects between wastewater, waste gas, and solid waste comes from the difference in policy performances: the well-designed water pollution control may have regional latecomers enjoy the spillover effect of nationwide progress, while the ineffective control of air and solid waste pollution may cause a ‘pollution haven’ effect through the interjurisdictional competition for polluted industries on regional latecomers. We also presume that nationwide technological progress in waste and air pollution control may reflect the fact that China, as a developing country, is obtaining technological transfers from advanced countries. The results imply the urgent necessity to enhance the policy performances on the air and solid waste pollution control to make the EK-curve pattern sustainable.
However, this study may only be an initial step in the analysis of the environmental latecomer's effects in Chinese provinces. Analytical issues still remain that need to be addressed. First, the EK-curve estimation model might be more sophisticated in terms of adopting dynamic panel modeling with the semi-parametric generalized additive model framework (see Auffhammer and Carson, Reference Auffhammer and Carson2008). Second, another challenge is to have our analysis focus on environmental policy performances. We can insert policy variables into the EK-curve estimation model and conduct policy simulation in terms of shifting the EK curve (see Panayotou, Reference Panayotou1997).