




No CrossRef data available.
Article contents
Time course of appearance of markers of arrhythmia in patients with tetralogy of Fallot before and after surgery
Published online by Cambridge University Press: 21 January 2005
Abstract
Sudden death and ventricular tachycardia are known to occur late after correction of tetralogy of Fallot. Abnormal dispersion of the QT interval, ventricular late potentials, and prolongation of the QRS complex, alone or in combination, are useful markers of the risk for such complications. Our present prospective study investigates the time course of appearance of two markers, dispersion of QT and JT, and ventricular late potentials, before and after corrective surgery. Dispersion of QT and JT, and signal averaged electrocardiographic parameters, were determined sequentially in 20 patients before, a mean of 9 ± 3 days after, and again 35 ± 11 days post-operatively. Dispersion of QT was already abnormal before surgery in two-fifths of the patients, but increased markedly in the later post-operative period. Ventricular late potentials were absent before surgery and in the immediate post-operative period, but were found in one-fifth of patients 1 month later. We conclude that abnormal dispersion of QT is, to some extent, a fact of the natural history of tetralogy of Fallot, but is significantly amplified by surgery. Ventricular late potentials, on the other hand, are absent before surgery, but appear with some delay after the operation, probably as a result of scarring rather than the surgical incision itself. Long-term follow-up is needed to assess the significance of these findings.
Keywords
Information
- Type
- Original Article
- Information
- Copyright
- © 2004 Cambridge University Press
Sudden death, most likely due to arrhythmias, is the main cause of mortality late after apparently successful correction of tetralogy of Fallot.1 In search for markers identifying patients at risk for ventricular arrhythmias or sudden death, a variety of electrocardiographic and electrophysiologic markers have been investigated. Holter recordings, although showing asymptomatic ventricular arrhythmias in a large percentage of patients, do not seem to predict sudden death.2 Subtle changes in parameters evident in the surface electrocardiogram appear to have potential value. These include the duration of the QRS complex, ventricular late potentials, and abnormal dispersion of the QT interval.
According to Gatzoulis et al.3 patients who suffer sudden death or syncopal episodes after correction usually have the duration of the QRS complex prolonged beyond 180 ms.
Ventricular late potentials, as identified on the signal averaged electrocardiogram, are used as markers for the risk of ventricular arrhythmias after myocardial infarction.4 Such late potentials are often present after correction of tetralogy of Fallot,5 and may have some value as risk factors.6
Abnormal dispersion of the QT interval, indicating inhomogeneous repolarization, has also proved useful in predicting the occurrence of ventricular arrhythmias in adults with coronary arterial disease, especially when combined with the signal averaged electrocardiogram.7, 8 There are few studies on the dispersion of QT in patients with tetralogy of Fallot, but some have suggested that increased dispersion, especially when combined with prolongation of the QRS complex, is a valuable predictor of ventricular arrhythmias after corrective surgery.9–11
Ventricular late potentials are generally absent in those with tetralogy of Fallot before repair,5 and thus appear to be a result of surgery. As for QT dispersion, it has been found to be abnormally prolonged in the setting of tetralogy, but it is uncertain whether this is part of the natural history or the result of the operation. In general, the time course of appearance in these patients of ventricular late potentials, or increased QT dispersion, is unknown. We have therefore investigated the time course of appearance of these markers before and after surgical repair of patients with tetralogy of Fallot.
Patients and methods
As part of a larger prospective study investigating QT dispersion and ventricular late potentials in patients with tetralogy of Fallot,12 20 patients had sequential evaluation of the two potential markers before, immediately after, and again later after corrective surgery. The ages of the patients at the time of surgery ranged from 1.3 to 15.7 years, with a mean age of 6.5 years. Surgery was performed under cardiopulmonary bypass and using moderate hypothermia, through a right ventriculotomy in all.
A resting 12 lead electrocardiogram, and a signal averaged electrocardiogram, were recorded on the day before operation, 9 ± 3 days after surgery, and again 1 month later, that is, 35 ± 11 days after surgery. The duration of the QRS complex, and the duration and dispersion of QT and JT, were measured by hand on the electrocardiogram recorded at 25 mm/s. In each instance, we took 3 measurements averaged on each of the 12 leads of the surface electrocardiogram, with the exception of the leads where the T wave was flat and isoelectric. The end of the T wave was defined as the return to the isoelectric line. All measurements were done by two observers, averaging the results of their readings. When the results differed by more than 20 ms, a third person made the same measurements, and the two closest readings were then averaged. Dispersion of QT and JT was defined as the difference between the shortest and the longest intervals measured in any lead. Mean values for such dispersion of QT before and after surgery were compared to a control group of 111 normal children tested in our laboratory, with dispersion greater than 63 ms being considered abnormal.13 No correction for heart rate was made, as this produces spuriously elevated values.13
Signal averaged electrocardiograms were recorded on a Marquette Mac 15 instrument, with a bi-directional filter of 40–250 Hz. Three bipolar orthogonal leads according to Frank were placed using silver chloride electrodes after careful cleansing of the skin with a mixture of ether and alcohol. Between 81 and 1001 complexes were averaged in order to obtain a low level of noise, targeted to be below 0.3 μV. This was not always achieved, and the mean level for the group was 0.5 ± 0.18 μV. The usual parameters were measured, specifically the total filtered QRS complex, the duration of terminal low amplitude signals below 40 μV, and the root mean square of the last 40 ms. Late potentials were deemed present when at least 2 of these parameters exceeded normal values in children as established in our laboratory13 for the recordings before surgery, in other words in the absence of right bundle branch block.
Because all post-operative electrocardiograms showed right bundle branch block, these same criterions could not be applied in the post-operative tracings. We therefore used the correction suggested by Buckingham et al.14 and values were considered abnormal if the filtered QRS exceeded 145 ms, the duration of terminal low amplitude signals was over 45 ms, and the root mean square of the last 40 ms was smaller than 17 μV.
Statistics
Mean and standard deviation was calculated for each parameter. For comparison between the 3 time periods, we used analysis of variance and, if the F value was significant, Bonferroni multiple comparison tests were applied to compare individual groups. To compare percentages in occurrence of late potentials, we used Fischer's exact test.
Results
Results of all parameters before, early, and later after operation are given in Table 1. Abnormal values for QT dispersion, above 63 ms, were already present before surgery in 8 of the 20 patients. Mean dispersion was 59 ± 27.7 ms, and mean dispersion of JT was 54 ± 30.1 ms. Dispersion of QT, therefore, was significantly different from control values, which were 36 ± 13.7 ms (p < 0.001). No significant correlation was found between age and QT dispersion before surgery (r = 0.16), but none of the 6 patients below three and a half years of age had prolonged QT dispersion.
Table 1. Individual values for dispersion of QT and JT (dQT, dJT) and signal averaged electrocardiographic parameters (SAECG), before, early and later after surgery.

In the immediate post-operative period, 9 patients (45%) had abnormal QT and JT dispersion. Mean QT dispersion was now 66 ± 29.6 ms, with JT dispersion measured at 57 ± 24.1 ms. These values were again significantly different from normal, but not from the pre-operative values.
The recordings made 1 month later show abnormally increased QT dispersion in 18 of the 20 cases (90%). Mean QT dispersion was now 95 ± 34 ms, and JT dispersion had increased to 84 ± 34.5 ms. These values were significantly higher than the pre-operative values (p < 0.001 for QT dispersion and p < 0.01 for JT dispersion), but had now also become significantly higher than the values obtained in the immediate post-operative period (p < 0.01 and p < 0.05 respectively) (Figs 1a and b).

Figure 1. Dispersion of the QT interval (a) and JT interval (b) before, immediately after surgery (post-op 1), and later (post-op 2). N = normal for our laboratory. *p < 0.01 vs normal; **p < 0.01 vs pre-op and early post-op.
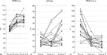
No late potentials had been detected before surgery based on our criterions, with the filtered QRS, the duration of terminal low amplitude signals, and the root mean square of the last 40 ms all being within normal limits. Subsequently, however, sequential changes were seen to differ in these three parameters of the signal averaged electrocardiogram (Figs 2a, b and c).

Figure 2. Individual sequential measurements of the 3 signal averaged electrocardiographic parameters. (a) Filtered QRS. (b) Duration of low amplitude terminal signals less than 40 μV. (c) Root mean square of the last 40 ms.
In the immediate post-operative period, the filtered QRS became longer, mostly as a result of the right bundle branch block. Taking into account the bundle branch block,14 five of the patients now showed a prolonged duration of the filtered QRS complex. With regard to the duration of the terminal low amplitude signals, there was no significant change of the mean value in the immediate post-operative period, although 2 values were above normal. The root mean square of the last 40 ms, however, dropped significantly early post-operatively but, when applying the criterions for right bundle branch block, none was abnormally low, in other words below 17 μV. Importantly, no single patient had 2 or 3 criterions allowing the diagnosis of ventricular late potentials in this immediate post-operative period.
One month later, nonetheless, 4 of the patients (20%) had developed evidence of ventricular late potentials, six had an abnormally prolonged duration of the filtered QRS complex, 7 traces showed prolonged duration of terminal low amplitude signals, and 2 values of the root mean square of the last 40 ms were below the lower limit (Figs 2a, b and c). The most significant change between early and later post-operative period occurred in the duration of the terminal low amplitude signals. None of the patients presented with significant ventricular arrhythmias before or after surgery.
Discussion
In a quest to identify risk factors for ventricular arrhythmias and sudden death after surgical correction of tetralogy of Fallot, various markers, both invasive, such as electrophysiological studies, and non-invasive have been explored.3, 5, 6, 9, 10 Both ventricular late potentials, and increased dispersion of the QT interval, have been reliable markers for the risk of ventricular arrhythmias in adults after myocardial infarction. There are some indications that they may also be useful in predicting malignant ventricular arrhythmias after surgical repair of tetralogy.6, 7, 10 It is well known that such ventricular late potentials, and abnormal dispersion of the QT interval, can be observed in patients with tetralogy of Fallot, especially after surgical repair, but the time course of appearance of these markers for arrhythmia is as yet unknown.
Our study has investigated prospectively and sequentially the time course of appearance of these markers. It confirms that ventricular late potentials are absent before surgical intervention, but also demonstrates that they do not appear immediately after surgery. Late potentials are only detected after a delay of one month. It is likely, therefore, that they are the consequence of the process of scarring rather than the surgical injury itself.
Dispersion of QT, on the other hand, is already abnormal before surgery in almost half the patients, as well as dispersion of JT. These changes may well be related to the fibrosis in the right ventricle that develops over time,15 and which appears to be part of the natural history of the disease. If this were the case, however, we would then expect to find a correlation between age and abnormal dispersion of QT prior to surgery, but this could not be demonstrated in our study. None of the infants and children below the age of three and a half years, however, had abnormal QT dispersion.
Both the number of patients with increased QT dispersion, and the magnitude of the prolongation, increased markedly after corrective surgery. The increase is only mild in the early post-operative period, failing to reach statistical significance, but had become quite massive one month later, affecting nine-tenths of the patients to various degrees. It appears, then, that abnormal dispersion of QT is part of the natural history of tetralogy of Fallot, but is significantly amplified after open-heart surgery. Although we do not have long-term follow-up, others have shown that abnormal dispersion of QT persists after surgery into adulthood. Thus, Therrien et al.16 found highly prolonged dispersion of QT in a group of adults with severe pulmonary regurgitation late after surgical correction of tetralogy. The values were in the same range as ours, and there was no change after replacement of the pulmonary valve.
The predictive value of ventricular late potentials after repair of tetralogy has been controversial. In our experience, although there is a correlation between inducibility of ventricular tachycardia and late potentials,17 no adverse arrhythmic event occurred in a cohort of 104 patients, including 24 patients with ventricular late potentials, followed for a mean of 30 months.18 Daliento et al.9 could not demonstrate a predictive value of ventricular late potentials alone in their study. Janousek et al.6 on the other hand, found late potentials, and especially low root mean squares of the last 40 ms, to be predictive of spontaneous or induced ventricular tachycardia in patients who had undergone surgical correction of congenital cardiac disease via a ventriculotomy.
Dispersion of QT has been studied more recently as a potential risk factor. Increased dispersion indicates abnormalities of repolarization. There is a dispute over whether or not it is an indicator of inhomogeneous repolarization across the myocardium, or merely the result of the T-loop axis and morphology.19, 20 Whatever the underlying mechanism, increased dispersion is clearly a risk factor for malignant ventricular arrhythmias, not only in adults with coronary arterial disease,7, 8 but also after surgical correction of tetralogy of Fallot.9, 21
There is now evidence from several studies that the combination of markers of abnormal depolarization and repolarization have optimal predictive value for predicting the occurrence of malignant ventricular arrhythmias. This appears to be true for the combination of QRS duration and QT dispersion,10, 11 and also for the combination of signal averaged parameters and QT dispersion, as demonstrated in patients with coronary arterial disease or cardiomyopathy.8 The evidence available at this time thus indicates that both abnormalities of depolarization, such as duration of the QRS complex and the parameters obtained from the signal averaged electrocardiogram, and abnormalities of repolarization such as QT and JT dispersion, can be considered useful markers for the risk of ventricular arrhythmias and sudden death after repair. It was this recognition that prompted our interest in the time course of appearance of these markers.
Limitations
Some of our patients underwent surgery at a rather late age. These are children referred from abroad, mostly from developing countries. Some of the results of this study, therefore, may not apply to cohorts of patients undergoing surgery at around one year of age or younger, as is now the rule in developed countries. Furthermore, all of our patients underwent correction through a right ventriculotomy. Results may be different in patients approached through atrial and pulmonary arterial incisions. Finally, our follow-up is rather short, and it will be interesting to obtain data later after surgery in this group.
The presence of right bundle branch block after surgery requires a change in criterions used for late potentials. Indeed, the duration of the filtered QRS complex is prolonged by this intraventricular conduction defect, unrelated to any late potentials. We have chosen to apply the correction proposed by Buckingham et al.14 although it was derived from a cohort of adults. As far as we know, data do not exist regarding the duration of the filtered QRS complex in children with right bundle branch block in the absence of any cardiac anomaly, since this is a very uncommon finding. The criterions of Buckingham et al.14 nonetheless, have been confirmed by independent studies from a group in Athens,22, 23 these investigations also addressing adolescents and adults with right bundle branch block, including surgically corrected patients with tetralogy of Fallot. We realize that these criterions derived from adolescents and adults may be too stringent for children, and we cannot rule out that the number of patients with late potentials has been slightly underestimated. It has been previously shown, however, that ventricular late potentials are found in up to one-quarter of children after surgical correction of tetralogy of Fallot,18 and this corresponds to the proportion in the present study.
Conclusions
Our study demonstrates that ventricular late potentials are absent in patients with tetralogy of Fallot prior to attempted surgical correction, and do not appear immediately after surgery, but only one month later, probably related to the process of scarring. On the other hand, abnormal dispersion of the QT and JT intervals is already present in a substantial proportion of patients before surgery, but increases significantly one month after surgery. Abnormal dispersion of the QT interval, therefore, is part of the natural history of patients with tetralogy of Fallot, but is markedly amplified after surgery. Long-term follow-up is needed to assess the significance of these findings, but existing data shows that the combined use of the markers we have studied is of value in predicting the occurrence of malignant ventricular arrythmias.
References
Murphy JG, Gersh BJ, Mair DD, Fuster V, McGoon MD, Ilstrup DM, et al. Long-term outcome in patients undergoing surgical repair of tetralogy of Fallot. New Engl J Med 1993; 329: 593–599.Google Scholar
Cullen S, Celermajer DS, Franklin RC, Hallidie-Smith KA, Deanfield JE. Prognostic significance of ventricular arrhythmia after repair of tetralogy of Fallot: a 12-year prospective study. JACC 1994; 23: 1151–1155.Google Scholar
Gatzoulis MA, Till JA, Somerville J, Redington AN. Mechanoelectrical interaction in tetralogy of Fallot. QRS prolongation relates to right ventricular size and predicts malignant ventricular arrhythmias and sudden death. Circulation 1995; 92: 231–237.Google Scholar
Simson MB. Use of signals in the terminal QRS complex to identify patients with ventricular tachycardia after myocardial infarction. Circulation 1981; 64: 235–242.Google Scholar
Zimmermann M, Friedli B, Adamec R, Oberhansli I. Frequency of ventricular late potentials and fractionated right ventricular electrogram after operative repair of tetralogy of Fallot. Am J Cardiol 1987; 59: 448–453.Google Scholar
Janousek J, Paul T, Bartakova H. Role of late potentials in identifying patients at risk for ventricular tachycardia after surgical correction of congenital heart disease. Am J Cardiol 1995; 75: 146–150.Google Scholar
Yunus A, Gillis AM, Duff HJ, Wyse DG, Mitchell LB. Increased precordial QTc dispersion predicts ventricular fibrillation during acute myocardial infarction. Am J Cardiol 1996; 78: 706–708.Google Scholar
Goldner B, Brandspiegel HZ, Horwitz L, Jadonath R, Cohen TJ. Utility of QT dispersion combined with signal-averaged electrocardiogram in detecting patients susceptible to ventricular arrhythmia. Am J Cardiol 1995; 74: 1192–1194.Google Scholar
Daliento L, Caneve F, Turrini P, Buja G, Nava A, Milanesi O, et al. Clinical significance of high-frequency, low amplitude electrocardiographic signals and QT dispersion in patients operated on for tetralogy of Fallot. Am J Cardiol 1995; 76: 408–411.Google Scholar
Berul CI, Hill SL, Geggel RL, Hijazi ZM, Marx GR, Rhodes J, et al. Electrocardiographic markers of late sudden death risk in postoperative tetralogy of Fallot children. J Cardiovasc Electrophys 1997; 8: 1349–1358.Google Scholar
Gatzoulis AM, Till JA, Redington AM. Depolarization-repolarization inhomogeneity after repair of tetralogy of Fallot. Circulation 1997; 95: 401–414.Google Scholar
Al Balkhi R. Prévalence des potentiels tardifs ventriculaires et de la dispersion de l'espace QT chez les enfants après correction complète de tétralogie de Fallot. Thèse Université de Genève, 2002.
Vialle E, Al Balkhi R, Zimmermann M, Friedli B. Normal values of signal-averaged ECG parameters and QT dispersion in infants and children. Cardiology in the Young 1999; 9: 556–561.Google Scholar
Buckingham T, Thessen C, Stevens L, Redd RM, Kennedy HL. Effect of conduction defects on the signal-averaged electrocardiographic determination of late potentials. Am J Cardiol 1988; 61: 1265–1271.Google Scholar
Anderson RH, Ho SY. The morphologic substrates for pediatric arrhythmias. Cardiology in the Young 1991; 1: 159–176.Google Scholar
Therrien J, Siu SC, Harris L, Dore A, Niwa K, Janousek J, et al. Impact of pulmonary valve replacement on arrhythmia propensity late after repair of tetralogy of Fallot. Circulation 2001; 103: 2489–2494.Google Scholar
Zimmermann M, Friedli B, Adamec R, Oberhansli I. Ventricular late potentials and induced ventricular arrhythmias after surgical repair of tetralogy of Fallot. Am J Cardiol 1991; 67: 873–878.Google Scholar
Giroud D, Zimmermann M, Adamec R, Oberhansli I, Friedli B. Ventricular late potentials and spontaneous ventricular arrhythmias after surgical repair of tetralogy of Fallot. Do they have prognostic value? Br Heart J 1994; 72: 580–583.Google Scholar
Kors JA, Van Herpens G, Van Bemmel JH. QT dispersion as an attribute of T-loop morphology. Circulation 1999; 99: 1458–1463.Google Scholar
Daliento L, Rizzoli G, Menti L, Baratella MC, Turrini P, Nava A, et al. Accuracy of electrocardiographic and echocardiographic indices in predicting life threatening ventricular arrhythmias in patients operated for tetralogy of Fallot. Heart 1999; 81: 650–655.Google Scholar
Gatzoulis KA, Carlson MD, Biblo LA, Rizos I, Gialafos J, Toutouzas P, et al. Time domain analysis of the signal averaged electrocardiogram in patients with a conduction defect or a bundle branch block. Eur Heart J 1995; 16: 1912–1919.Google Scholar
Brili S, Aggeli C, Gatzoulis K, Tzonou A, Hatzos C, Pitsavos C, et al. Echocardiographic and signal averaged ECG indices associated with non-sustained ventricular tachycardia after repair of tetralogy of Fallot. Heart 2001; 85: 57–60.Google Scholar
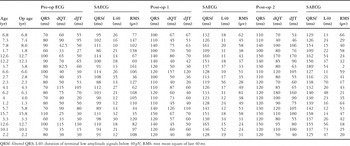
Table 1.

Dispersion of the QT interval (a) and JT interval (b) before, immediately after surgery (post-op 1), and later (post-op 2). N = normal for our laboratory. *p < 0.01 vs normal; **p < 0.01 vs pre-op and early post-op.
Individual sequential measurements of the 3 signal averaged electrocardiographic parameters. (a) Filtered QRS. (b) Duration of low amplitude terminal signals less than 40 μV. (c) Root mean square of the last 40 ms.
 You have
Access
- 6
- Cited by