Introduction
The 5th edition of the Diagnostic and Statistical Manual of Mental Disorders (APA, 2013) includes two conceptualizations of personality disorders (PDs), reflecting the decision of the American Psychiatric Association to ‘preserve continuity with current clinical practice, while also introducing a new approach that aims to address numerous shortcomings of the current approach to personality disorders’ (p. 761).
The categorical approach found in Section II, Diagnostic criteria and codes, is the official diagnostic system, and the criteria are identical with those found in the previous version (APA, 2000). Section III describes the DSM-5 Alternative Model in which PDs are characterized by impairments in personality functioning, i.e. disturbances in self and interpersonal functioning (Criterion A), and pathological personality traits (Criterion B, APA; 2013, p. 761–762). Six specific PDs may be derived from this model (APA; 2013, p. 763–770). The maladaptive personality traits are organized into five broad domains: Negative Affectivity, Detachment, Antagonism, Disinhibition, and Psychoticism, as well as 25 specific facets (APA; 2013, p. 779–781). According to the DSM-5 text, these domains were conceptualized as representing maladaptive extremes of the Five Factor Model (FFM) of personality (John et al. Reference John, Nauman, Soto, John, Robins and Pervin2008).
The Personality Inventory for DSM-5 (PID-5) is one approach to operationalizing the personality trait model (Krueger et al. Reference Krueger, Derringer, Markon, Watson and Skodol2012). The development of this instrument is described in Krueger et al. Reference Krueger, Derringer, Markon, Watson and Skodol2012. Research to date supports the reliability and validity of the five PID-5 domains (see Krueger & Markon, Reference Krueger and Markon2014, for a review).
The focus in the construction of PID-5 was ‘to cover all the maladaptive trait features of DSM-IV-TR PDs’ (Krueger et al. Reference Krueger, Derringer, Markon, Watson and Skodol2012). So far, a number of studies investigating this issue have been published, and indeed indicate that the new DSM-5 traits, as assessed by the PID-5, capture the reliable variance in DSM-IV/DSM-5 Section II personality disorders (e.g. Hopwood et al. Reference Hopwood, Thomas, Markon, Wright and Krueger2012; Few et al. Reference Few, Miller, Rothbaum, Meller, Maples, Terry, Collins and MacKillop2013; Miller et al. Reference Miller, Few, Lynam and MacKillop2015; Bach et al. Reference Bach, Anderson and Simonsen2016; Bastiaens et al. Reference Bastiaens, Smits, De Hert, Vanwalleghem and Claes2016; Morey et al. Reference Morey, Benson and Skodol2016; Wygant et al. Reference Wygant, Sellbom, Sleep, Wall, Applegate, Krueger and Patrick2016).
It has consistently been shown that genetic factors influence DSM PDs (Reichborn-Kjennerud, Reference Reichborn-Kjennerud2008), and a recent study from our group also indicates that the PID-5 domains, measured with a short form of the instrument, are heritable (South et al. Reference South, Krueger, Knudsen, Ystrom, Czajkowski, Aggen, Neale, Gillespie, Kendler and Reichborn-Kjennerud2016). However, the extent to which the two alternative systems for conceptualizing PDs reflect the same genetic and environmental risk factors has not yet been examined.
The main aim of the current study is therefore to estimate the amount of genetic and environmental variance in the DSM-IV/DSM-5 Section II PDs that is captured by the genetic and environmental variance in the PID-5 trait domains. Specifically, we use data from a large population-based sample of adult Norwegian twins on interview-based DSM-IV PDs and a short Norwegian version of the PID-5 inventory, referred to as the PID-5-Norwegian Brief Form (PID-5-NBF), that index the domains but not the facets of Criterion B and not Criterion A, to do the following:
-
(1) Estimate the phenotypic correlation between the DSM-IV/DSM-5 Section II personality disorders and the PID-5-NBF domains.
-
(2) Estimate the proportion of genetic and environmental variance in each of the DSM-IV/DSM-5 Section II personality disorders that is shared with genetic and environmental variance in all the PID-5-NBF domains in aggregate.
-
(3) Calculate the genetic and environmental correlations between the individual DSM-IV/DSM-5 Section II personality disorders and each of the Section III PID-5-NBF domains.
Method
Participants
Data for the present analyses come from a population-based longitudinal study of psychiatric disorders in Norwegian twins recruited from the Norwegian Institute of Public Health Twin Panel (Harris et al. Reference Harris, Magnus and Tambs2006; Nilsen et al. Reference Nilsen, Knudsen, Gervin, Brandt, Roysamb, Tambs, Orstavik, Lyle, Reichborn-Kjennerud, Magnus and Harris2013). Between 1999 and 2004, DSM-IV Axis I and II psychiatric disorders were assessed at interview in 2801 twins (44% of those eligible) born between 1967 and 1979 (wave 1). Several papers describing details of the sample and the measures used in this report have been published (Reichborn-Kjennerud et al. Reference Reichborn-Kjennerud, Czajkowski, Neale, Orstavik, Torgersen, Tambs, Roysamb, Harris and Kendler2007; Kendler et al. Reference Kendler, Aggen, Czajkowski, Roysamb, Tambs, Torgersen, Neale and Reichborn-Kjennerud2008; Torgersen et al. Reference Torgersen, Czajkowski, Jacobson, Reichborn-Kjennerud, Roysamb, Neale and Kendler2008). Between 2010 and 2011 a second wave of interviews were conducted using the same instruments. To maximize participation rate, wave 2 interviews included only a subset of the disorders assessed at wave 1, and were conducted by telephone. Wave 2 also included questionnaire assessment of six PID-5 dimensions (see below). After two written reminders and a final telephone contact to non-responders, 2284 twins (987 complete pairs) were interviewed in wave 2 (83% of the eligible), and 2299 (985 complete pairs) responded to the questionnaire (83% of the eligible). Altogether 2393 twins (1063 complete pairs) participated in wave 2 (87% of the eligible).
Zygosity was determined by a combination of questionnaire items and genotyping. The misclassification rate was estimated to be <1.0%, too low to substantially bias results (Neale, Reference Neale2003).
Of the 3221 twin pairs eligible for wave 1, we had PD data on 1385 complete twin pairs (43.0%) and 23 single twins (0.7% pairwise). Of these complete pairs, 220 were monozygotic male (MZM), 117 dizygotic male (DZM), 449 monozygotic female (MZF), 259 dizygotic female (DZF), and 340 opposite-sex dizygotic (DZU). Of the 2793 twins who participated at wave 1, 63% were females, and the mean age was 21.9 years (range = 18–25). Of the 2793 twins eligible for wave 2, there were 2284 twins (81.7%) comprising 986 twin pairs and 312 single twins who participated in the PD interviews. The distribution of zygosity groups for the pairs with complete PD data at wave 2 were 154 MZM, 76 DZM, 358 MZF, 179 DZF, and 219 DZU. For the maladaptive personality traits assessed at wave 2, we had data from 989 complete twin pairs, and from 318 single responders. The distribution of zygosity groups for the pairs with complete PID-5 data at wave 2 were 157 MZM, 78 DZM, 362 MZF, 178 DZF, and 214 DZU.
Measures
A Norwegian version of the comprehensive Structured Interview for DSM-IV Personality [SIDP-IV, (Pfohl et al. Reference Pfohl, Blum and Zimmerman1995)] was used to assess PDs in both waves. The specific DSM-IV criteria were rated using the following scoring guidelines: 0 = ‘not present’, 1 = ‘sub-threshold’, 2 = ‘present’, and 3 = ‘strongly present’. Behaviors, cognitions, and feelings that predominated for most of the past 5 years were considered to be representative of an individual's long-term personality. As in previous papers from this sample we adopted a dimensional approach to the analyses of the DSM PDs. We counted the number of criteria for each PD scored at either the threshold or sub-threshold level (⩾1). To reduce problems with empty cells and given the highly skewed distribution of the criteria counts, variables were reorganized into new ordinal variables [referred to as PD criteria counts (PD-CC)] having four levels (criteria counts of 0, 1, 2, ⩾2). By way of multiple threshold testing of bivariate normality, we have shown that this coding for the PD criteria are consistent with inferring a single dimension of liability on which estimated ordered thresholds for the number of criteria endorsed reflect severity on a single continuum (Reichborn-Kjennerud et al. Reference Reichborn-Kjennerud, Czajkowski, Neale, Orstavik, Torgersen, Tambs, Roysamb, Harris and Kendler2007; Kendler et al. Reference Kendler, Aggen, Czajkowski, Roysamb, Tambs, Torgersen, Neale and Reichborn-Kjennerud2008; Torgersen et al. Reference Torgersen, Czajkowski, Jacobson, Reichborn-Kjennerud, Roysamb, Neale and Kendler2008). At wave 1, all 10 DSM-IV PDs were assessed: Paranoid (seven criteria), Schizotypal (nine criteria), Schizoid (seven criteria), Antisocial (seven/eight criteria), Borderline (nine criteria), Histrionic (eight criteria), Narcissistic (nine criteria), Avoidant (seven criteria), Dependent (eight criteria), and Obsessive–Compulsive (OCPD; eight criteria). To maximize participation at wave 2, only the five disorders originally proposed for DSM-5 (Schizotypal, Antisocial, Borderline, Avoidant, and Obsessive-compulsive) plus Paranoid PD (necessary for the assessment of criterion 5 for schizotypal) were included. Interviewers were mainly senior clinical psychology graduate students and experienced psychiatric nurses. The interviews in wave 1 were largely conducted face-to-face. In wave 2, all interviews were conducted by telephone. Each twin in a pair was interviewed by a different interviewer. Inter-rater reliability at wave 1 was assessed based on 2 raters scoring of 70 audiotaped interviews. Intraclass and polychoric correlations for the count of endorsed criteria at the sub-threshold (⩾1) level were very high 0.81–0.96 and 0.80–0.99, respectively). At wave 2, inter-rater reliability was assessed similarly by two interviewers re-scoring 95 audio recorded interviews. Intra-class and polychoric correlations for the number of endorsed criteria, again at the sub-threshold level were 0.68–0.85 and 0.81–091, respectively.
The five domains of the DSM-5 alternative trait model plus a sixth domain explicitly targeting compulsivity were assessed using a 36-item inventory (PID-5-NBF). This shortened inventory was created by selecting items from the full PID-5 (Krueger et al. Reference Krueger, Derringer, Markon, Watson and Skodol2012) that were deemed to be good indicators of each domain. The development and psychometric properties of the instrument are described in South et al. Reference South, Krueger, Knudsen, Ystrom, Czajkowski, Aggen, Neale, Gillespie, Kendler and Reichborn-Kjennerud2016. In brief, it shows that the domain scales of PID-5-NBF have good internal consistency. Reliability measured as Chronbach's alpha range from 0.86 (Negative emotionality) to 0.60 (Antagonism). All alphas except that for Antagonism was >0.70 (South et al. Reference South, Krueger, Knudsen, Ystrom, Czajkowski, Aggen, Neale, Gillespie, Kendler and Reichborn-Kjennerud2016). The domains show measurement invariance across gender. The PID-5-NBF thus has psychometric properties similar to the PID-5 with the caveat that it measures only the domains (plus compulsivity).
In a representative sample, the full PID domains correlate reasonably well with the respective domain from the PID-5-NBF used in the current study (i.e. Negative Affectivity = 0.87, Detachment = 0.76, Antagonism = 0.83, Disinhibition = 0.72, and Peculiarity/Psychoticism = 0.92) (South et al. Reference South, Krueger, Knudsen, Ystrom, Czajkowski, Aggen, Neale, Gillespie, Kendler and Reichborn-Kjennerud2016). Each item is a single sentence descriptor of a personal characteristic deemed to tap a given maladaptive trait. Participants are asked to respond using a 1–4 scale (1 = Very true or often true, 2 = Sometimes or somewhat true, 3 = Sometimes or somewhat false, 4 = Very false or often false) according to how strongly each item pertained to them. A total of ten items were used to measure the Negative Affectivity domain, six items measured Antagonism, and five items were created to measure each of Detachment, Disinhibition, Compulsivity, and Psychoticism. Items were randomly numbered on the inventory. The resulting scale scores were positively skewed and log transformations were therefore applied to each sum score.
The Norwegian Data Inspectorate and the Regional Ethical Committee approved the study, and written informed consents were obtained from all participants after complete description of the study.
Statistical analyses
Phenotypic associations between the PID-5 domain constructs and the ordinal PD symptom counts variables were assessed by polyserial correlations. Polyserial correlations quantify the degree of association between a continuous and an ordinal variable, and are less prone to attenuation than Pearson correlation.
To assess the extent of genetic and environmental overlap between the PID-5-NBF domains and each of the PD–CC, we fitted multivariate twin models. Using the classical twin design, individual differences in liability were decomposed into three latent sources: additive genetic (A), i.e. genetic effects that combine additively; common or shared environment (C) that includes all environmental exposures that contribute to twin similarity; and individual-specific or unique environment (E) which includes all environmental factors that contribute to differences between the twins plus measurement error. Because monozygotic (MZ) twins share all their genes and dizygotic (DZ) twins share on average 50% of their segregating genes, A contributes twice as much to the resemblance in MZ compared with DZ twins for a particular trait or disorder. The classical twin design also assumes that MZ and DZ twins share all their C factors and none of their E factors.
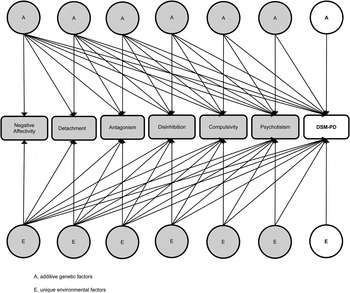
We fitted a series of 7 × 7 Cholesky Triangular Decompositions (Neale & Cardon, Reference Neale and Cardon1992) in which all six PID-5-NBF domain variables were entered first, followed by each of the PD–CC variables in turn. This model (shown in Fig. 1 with only A and E factors) was repeated for each PD–CC variable. The full Cholesky decomposition contains as many latent A, C, and E factors as there are observed variables. Consequently, the first six A, C, and E factors contribute to variance in all of the six PID-5-NBF domains as well as the PD–CC specified last in the model. The last A, C, and E factors contributes variance that is unique to each PD–CC. Altogether 16 such multivariate models (10 wave 1 + 6 wave 2) were fitted.
Cholesky decomposition with the six PID-5-NBF domains and each of the DSM-IV PD criteria counts. a additive genetic factors, e unique environmental factors.

Path coefficients were constrained equal across sex, but separate thresholds and means were estimated for males and females. The basic models, with which subsequent more parsimonious sub-models were compared, were ACE models without sex-effects. Model fit was determined by Akaike's Information Criterion (AIC) (Akaike, Reference Akaike1987). A lower value indicates better fit.
We tested the significance of unique genetic influences for the PD–CC by in turn setting to zero the paths from the last latent A factors in the models, which contribute unique genetic variance to each PD–CC. For every PD–CC, we report the total genetic and environmental variance, as well as the proportion that is unique to each PD–CC, and the proportion that is shared with the total PID-5-NBF.
The genetic and environmental correlations between each PD–CC and PID-5 domain were also calculated based on the best-fit model.
All statistical analyses were performed in R 3.1.2 (R Core Team, 2015) and twin analyses used OpenMx (Neale et al. Reference Neale, Hunter, Pritkin, Zahery, Brick, Kirkpatric, Estabrook, Bates, Maes and Boker2016).
Results
Phenotypic correlations
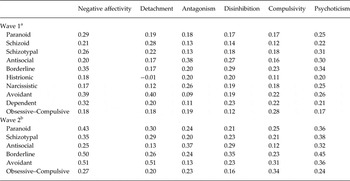
The phenotypic correlations between the PID-5-NBF domains and the PD–CC assessed 10 years previously (wave 1) and concurrently (at wave 2) are given in Table 1.
Phenotypic correlations between PID-5-NBF domains and the DSM-IV PD criteria counts at waves 1 and 2

a PID-5-NBF domains measured 10 years after the DSM-IV PD criteria counts.
b PID-5-NBF domains and DSM-IV PD criteria counts measured concurrently.
The median correlation between the PID-5-NBP domains and the 10 PD–CC measured 10 years earlier was highest for Psychoticism (r = 0.25, range 0.17; 0.34) followed by Negative Affectivity (r = 0.23, range 0.17; 0.39). The lowest median correlation was found for Compulsivity (r = 0.18, range 0.28; 0.12), Detachment (r = 0.19, range −0.01; 0.40) and Antagonism (r = 0.19, range 0.11; 0.38). The highest bivariate correlations were: Avoidant – Detachment (r = 0.4), Antisocial – Antagonism (r = 0.38), Borderline – Negative Affectivity (r = 0.35) and Schizotypal – Psychoticism (r = 0.31).
For the six PID-5-NBF dimensions, the median correlation with the six PD–CC assessed at the same time (Table 1) was highest for Negative Affectivity (r = 0.39, range 0.25; 0.51), followed by Psychoticism (r = 0.36, range 0.24; 0.45), and lowest for Antagonism (r = 0.23, range 0.13; 0.37) and Disinhibition (r = 0.23, range 0.16; 0.35). The strongest bivariate relationships were: Avoidant – Detachment (r = 0.51), Borderline – Negative Affectivity (r = 0.5), Paranoid – Negative Affectivity (r = 0.43), Schizotypal – Psychoticism (r = 0.38), Antisocial – Antagonism (r = 0.37), and OCPD – Compulsivity (r = 0.34).
For the six PD–CC measured at both waves, the rank order for the strongest bivariate correlations with the PID-5 domains was the same in both waves. The four PD–CC assessed only at wave 1, showed the following strongest bivariate relationships with PID-5-NBF traits: Schizoid – Detachment (0.28), Narcissistic – Antagonism (0.26), Dependent – Negative Affectivity (0.32). Histrionic PD was equally related to Antagonism, Disinhibition, and Psychoticism (0.20).
Unique and shared genetic and environmental variance
For all the Cholesky decompositions (10 in wave 1, 6 in wave 2), models specifying only A and E factors were more parsimonious than the full ACE or the CE models, indicated by a more negative AIC value (See online Supplementary Table S1). A further restriction in the AE models by setting to zero the paths specifying unique genetic effects for each of the PD–CC, resulted in improved fit for Paranoid, Schizotypal and Borderline in wave 1, suggesting that for these PD–CC all genetic variance can be accounted for by genetic variance shared with the six PID-5-BNF domains (despite the 10-year gap between assessments). For the remaining seven PD–CC, the full AE model was most parsimonious, indicating specific genetic variance not shared with PID-5-NBF (online Supplementary Table S1). In wave 2, improved parsimony was found for five of the six reduced models of the PD–CC (Paranoid, Schizotypal, Antisocial, Borderline, and Avoidant) indicating no evidence for specific genetic variance that was not shared with PID-5-BNF (online Supplementary Table S1). Deterioration in fit of the reduced model was found for OCPD, indicating that an AE model retaining a unique genetic effect for OCPD fitted best.
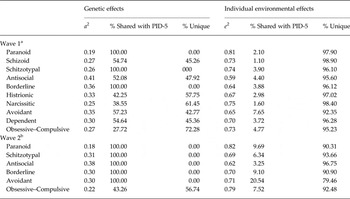
Table 2 gives the proportion of the total variance in each of the PD–CC that can be attributed to A and E factors in the PID-5-BNF dimensions wave 1 and 2, respectively. It also shows the proportion of genetic and environmental variance that is unique to each PD–CC and the proportion of variance shared with the total aggregated PID-5 domains. (Results based on the full AE model are given in online Supplementary Table S2.)
Genetic and environmental variance for DSM-IV PD criteria counts and proportion shared with PID-5-NBF domains from best-fitting models at waves 1 and 2

a 2, Total genetic variance (heritability) for DSM PDs.
e 2, Total environmental variance for DSM PDs.
a PID-5-NBF domains measured 10 years after the DSM-IV PD criteria counts.
b PID-5-NBF domains and DSM-IV PD criteria counts measured concurrently.
As shown in Table 2, the heritability of the 10 PDs assessed at wave 1 ranged from 0.19 (Paranoid) to 0.41 (Antisocial) with median and mean of 0.27 and 0.30 respectively. At wave 2, the proportion of genetic variance of the six assessed PD–CC was found to be in the range 0.18 (Paranoid) to 0.38 (Antisocial), with median and mean of 0.30 and 0.28, respectively.
Under the most parsimonious models, the genetic covariance was complete between the PID-5 domains and Paranoid, Schizotypal and Borderline PD assessed at wave 1 (Table 2). Over 50% of the genetic variance was shared between the PID-5 domains and Schizoid, Antisocial, Avoidant, and Dependent; <50% was shared with PID-5-NBF domains for Narcissistic, Histrionic and OCPD. For quantitative comparison, these results are shown as a stacked bar-chart in online Supplementary Fig. S1a.
At wave 2, there was 100% genetic covariance between the six PID-5-NBF domains and Paranoid, Schizotypal, Antisocial, Borderline, and Avoidant PDs. For OCPD, 43% of the genetic variance was shared with PID-5-NBF (online Supplementary Fig. S1b).
The pattern of shared v. unique E variance for PD–CC and PID-5-NBF domains was opposite to that found for the genetic effects. At wave 1, the proportion of E variance in the PD–CC not shared with the PID-5 dimensions ranged from 92.4% (Avoidant) to 98.9% (Schizoid), with median 96.20% and mean 96.4%. At wave 2, the proportion of non-shared variance ranged from 79.46% (Avoidant) to 96.8% (Antisocial), with a median of 91.7% and mean 90.6%. The E variance unique to each PD as well as that shared with the PID-5 domains is also given in Table 2.
Genetic correlations
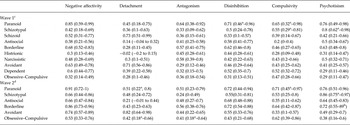
Table 3 display the estimated genetic correlations [with 95% confidence intervals (CI)] between the PID-5 dimensions and the PD–CC. The strongest bivariate relationship between genetic risk for each PD–CC and the PID-5-NBF domains measured at wave 1 was: Paranoid – Negative Affectivity (+0.85), Schizoid – Detachment (+0.73), Schizotypal – Psychoticism (+0.78), Antisocial – Disinhibition (+0.58), Borderline – Negative Affectivity (+0.68), Histrionic – Antagonism (+0.45), Narcissistic – Antagonism (+0.58), Avoidant – Detachment (+0.71), and OCPD – Compulsivity (+0.47). For the PD–CC measured at wave 2, the pattern was the same: Paranoid – Negative Affectivity (+0.91), Schizotypal – Psychoticism (+0.86), Antisocial – Disinhibition (+0.68), Borderline – Negative Affectivity (+0.86), Avoidant – Detachment (+0.82), and OCPD – Compulsivity (+0.62).
Genetic correlations between PID-5-NBF and the DSM PD criteria counts based on the best-fitting models

95% confidence intervals (CI) are given in parentheses.
a,b Lower (/upper) CI limit could not be reliably estimated, but a symmetric interval around the point estimate based on the upper (/lower) limit is given.
c PID-5-NBF domains measured 10 years after the DSM-IV PD criteria counts.
d PID-5-NBF domains and DSM-IV PD criteria counts measured concurrently.
The two PD–CC at wave 1 with the highest median genetic correlations with the six PID-5-NBF domains were Paranoid (+0.69) and Borderline (+0.60), and the two with the lowest were Histrionic (+0.30) and OCPD (+0.32). At wave 2, the two PD–CC with the highest median genetic correlation with the six PID-5 domains were Paranoid (+0.72) and Borderline (+0.68). The lowest was found for OCPD (0.43).
Conversely, at wave 1 the highest median genetic correlation with the PID-5-NBF dimensions was found for Negative Affectivity at 0.50, the lowest for Detachment at 0.33. At wave 2, the median genetic correlations between the six PD–CC and the PID-5-NBF domains range between 0.70 for Negative Affectivity to 0.33 for Antagonism.
Environmental correlations
The correlation between environmental factors influencing PD–CC and PID-5-BNF were generally lower than the genetic correlations (online Supplementary Table S3) ranging from 0 (Avoidant – Antagonism) to +0.22 (Avoidant – Detachment) at wave 1 and from 0 (Antisocial – Compulsivity) to +0.36 (Avoidant – Detachment) at wave 2. For several of the PD–CC the patterns of correlations were similar to those found for the genetic correlations.
Discussion
We found that in aggregate the trait system for classification of PDs in the Alternative Model of DSM-5 Section III appears to tap the same genetic risk factors as the official DSM-5 Section II classification for most of the PD–CC. When assessed concurrently, the aggregated genetic factors influencing the six PID-5-NBF domains account for all of the genetic variance in five of the six PD–CC that were assessed.
Genetic factors influencing the PID-5-NBF domains assessed 10 years later than the PD–CC, also accounted for all the genetic variance in three out of 10 PD–CC and for more than 50% of the genetic variance in four additional PD–CC. This suggests that at least for seven of the 10 DSM-IV/DSM-5 Section II PDs, the alternative trait system for classification captures most of the genetic variance in the PD–CC.
Although we included a sixth domain explicitly targeting compulsivity, more than 50% of the genetic variance for OCPD was unshared with the PID-5-NBF domains at both waves. Our findings suggest that this version, without facets, does not exhaust the variance in OCPD. Previous literature on the whole PID-5 including facets and OCPD shows that facets are adding information (Bastiaens et al. Reference Bastiaens, Smits, De Hert, Vanwalleghem and Claes2016). Future research would therefore benefit from using the entire PID-5. In addition to potential content unique to OCPD, not entirely covered by the PID5-NBF, OCPD was the only PD studied on two occasions that showed a genetic correlation over time of <1.0 (Gjerde et al. Reference Gjerde, Czajkowski, Roysamb, Ystrom, Tambs, Aggen, Orstavik, Kendler, Reichborn-Kjennerud and Knudsen2015). This relatively greater genetic instability of OCPD may also have contributed to a diminished genetic association with the PID5-NBF. Another possible explanation could be that there might be more measurement error associated with OCPD than the other PDs. Our results do not support this as OCPD, like all the other PDs, showed high inter-rater reliability and good internal consistency (Cronbach's alpha).
Also for Narcissistic, and Histrionic PD (measured only 10 years before PID-5-NBF, and thus creating a confound between construct and time of measurement), <50% of the genetic variance was shared with PID-5-NBF. This is nevertheless consistent with results from a clinical population suggesting that PID-5 accounted for less genetic and environmental variance in these three PDs (24–29%) than in the other seven (Few et al. Reference Few, Miller, Rothbaum, Meller, Maples, Terry, Collins and MacKillop2013).
Unlike genetic risks, individual environmental effects in PID-5-NBF domains and PD–CC were mostly distinct at both waves, with shared effects mostly under 10%. One explanation for the low overlap could be that E effects include measurement error which would underestimate associations with ‘true’ environmental factors.
We also investigated the extent to which genetic and environmental liability factors associated with the individual PID-5-NBF domains correlated with each of the PD-CC. Although the Section III domains were not designed to reflect a one-to-one relationship with the 10 PDs, the strengths of some of the genetic correlations, based on concurrent measures, were striking: Paranoid – Negative Affectivity (+0.91), Schizotypal –Psychoticism (+0.86), Borderline – Negative Affectivity (+0.86), Avoidant – Detachment (+0.82) Antisocial – Antagonism, (+0.68). These specific relationships are consistent with the criteria in Section III of the DSM-5 manual for the six proposed PDs (page: 763–770). Interestingly, with a few exceptions (e.g. Antisocial most strongly related to Disinhibition) the pattern of phenotypic correlations was very similar to the pattern found for the genetic correlations. This pattern of overlap between PID-5 constructs and DSM-IV PDs is generally in accordance with results from previous phenotypic studies (e.g. Hopwood et al. Reference Hopwood, Thomas, Markon, Wright and Krueger2012; Few et al. Reference Few, Miller, Rothbaum, Meller, Maples, Terry, Collins and MacKillop2013; Miller et al. Reference Miller, Few, Lynam and MacKillop2015; Bach et al. Reference Bach, Anderson and Simonsen2016; Bastiaens et al. Reference Bastiaens, Smits, De Hert, Vanwalleghem and Claes2016; Morey et al. Reference Morey, Benson and Skodol2016; Wygant et al. Reference Wygant, Sellbom, Sleep, Wall, Applegate, Krueger and Patrick2016).
The pattern of environmental correlations is also similar to the phenotypic (Negative Affectivity – Borderline, Detachment – Avoidant, Compulsive – OCPD, Antisocial – Antagonism) but not as clearly as the genetic. Given that this is the first study to examine genetic and environmental effects shared by DSM IV/DSM-5 Section II PD criteria and the PID-5 domains, there are no other results with which to compare our findings. The phenotypic correlations were, however, largely as expected based on previous findings from studies comparing DSM-IV PDs and the FFM (Samuel & Widiger, Reference Samuel and Widiger2008).
The overall picture was, however, that the specificity of correlations were low, with six genetic correlations >0.50 for Paranoid, five for Borderline, and three for Schizotypal, Antisocial and Avoidant. This was expected given that the PID-5 domains were conceptualized as representing maladaptive extremes of normative personality and not to reflect the 10 PDs. Future multivariate studies are needed to further explore the structure of genetic and environmental risk factors for normative personality, maladaptive personality traits and PDs. Future research should also endeavor to administer the entire PID-5 questionnaire, including measures of the 25 trait facets articulated in the DSM-5 Criterion B, and endeavor to assess the entire DSM-5 Alternative Model, including also the Criterion A indices of levels of personality functioning, to assess genetic and environmental overlap with the DSM-IV PD diagnoses.
From a clinical point of view, practitioners working in the field can begin to use the concepts in the DSM-5 Alternative Model knowing that they, at an aggregate level, largely reflect the same underlying risks factors as in DSM-IV's PDs. They can take advantage of the enhanced case conceptualization features of the Alternative Model, for example, characterizing patients by a profile across the domains we studied here, as opposed to selecting among overlapping and frequently comorbid DSM-IV categories.
Limitations
Four of the 10 PD–CC were only assessed 10 years earlier than the PID-5-NBF domains. Our results indicate that the phenotypic correlations and the overlap in genetic and environmental risk factors are substantially stronger when both conceptualizations of personality are measured at the same time. Although previous studies have shown that the stability of PD–CC is generally relatively low over such a long timespan (Morey & Hopwood, Reference Morey and Hopwood2013), investigations in the same sample as the current study show that the genetic correlation over time was +1.00 for all of the six PD–CC assessed at both waves except OCPD (Gjerde et al. Reference Gjerde, Czajkowski, Roysamb, Ystrom, Tambs, Aggen, Orstavik, Kendler, Reichborn-Kjennerud and Knudsen2015; Kendler et al. Reference Kendler, Aggen, Neale, Knudsen, Krueger, Tambs, Czajkowski, Ystrom, Orstavik and Reichborn-Kjennerud2015; Reichborn-Kjennerud et al. Reference Reichborn-Kjennerud, Czajkowski, Ystrom, Orstavik, Aggen, Tambs, Torgersen, Neale, Roysamb, Krueger, Knudsen and Kendler2015). For the relationship between the DSM-IV and the DSM-5 measures in this paper, the time-specific genetic influences for antisocial and avoidant PD counts and the PID-5-NBF could not be set to zero. This indicates that the combined effect of time and instrument-specific influences is sufficiently large that the genetic correlation between our wave 1 DSM-IV and wave 2 DSM-5 data cannot be set to +1.0. We are, however unable to tease apart the respective contributions of time and instrument, and can therefore not rule out that this could reflect differences in the genetic risk factors underlying the two instruments.
We used a very short form of the PID-5 with only 36 items instead of the original 220 item version. Although this version correlates reasonably well with domain scales from the full instrument, and the reliability measured as Chronbach's alpha was >0.70 for all domains except Antagonism (South et al. Reference South, Krueger, Knudsen, Ystrom, Czajkowski, Aggen, Neale, Gillespie, Kendler and Reichborn-Kjennerud2016), it is likely to have a lower reliability than the long version, which again could lead to underestimation of the associations studied. It also has a more limited phenotypic coverage, measuring only the traits and not the facets. In spite of this limitation, the domains account for much of the variance in the DSM Section II PD constructs. Had the full PID-5 instrument been used, we expect that its domains would have accounted for even more of the genetic and environmental effects on the PD–CC.
There was attrition in this sample from the medical birth registry through two questionnaire and two interview waves (see online Supplementary Material). Although we cannot rule out that some bias due to attrition could have influenced our results it is not likely to be substantial. This is especially the case because the maximum-likelihood estimation used is robust to missingness at wave 2 that is predicted by assessment at wave 1 (Little & Rubin, Reference Little and Rubin1987)
Our statistical power to detect sex-specific differences in genetic and environmental effects was low due to low number of opposite sex twins. Although previous twin studies have failed to find either quantitative or qualitative gender differences for PD–CC (Reichborn-Kjennerud et al. Reference Reichborn-Kjennerud, Czajkowski, Neale, Orstavik, Torgersen, Tambs, Roysamb, Harris and Kendler2007; Kendler et al. Reference Kendler, Aggen, Czajkowski, Roysamb, Tambs, Torgersen, Neale and Reichborn-Kjennerud2008; Torgersen et al. Reference Torgersen, Czajkowski, Jacobson, Reichborn-Kjennerud, Roysamb, Neale and Kendler2008), they may exist. An analysis on the PID-5-NBF domains suggest that they are largely similar in etiology across men and women with no sex effects for 4 of the 6 scales, mixed results for one (Psychoticism) and clear evidence only for Antagonism (South et al. Reference South, Krueger, Knudsen, Ystrom, Czajkowski, Aggen, Neale, Gillespie, Kendler and Reichborn-Kjennerud2016). It is therefore not likely that our results would be substantially biased by not including sex differences in our models.
Twin studies have numerous limitations with regard to inferring genetic effects (Rutter, Reference Rutter2006). Heritability estimates and genetic correlations between traits are for example dependent on the samples on which they are based. The results from this study may therefore not generalize to other cultural, ethnic, and age groups.
Conclusion
The pathological personality trait domains, which are part of the Alternative Model for classification of PDs in DSM-5 Section III, appear to tap, at an aggregate level, the same genetic risk factors as the DSM-IV/DSM-5 Section II classification for most of the PDs. Although these constructs emerged in different ways (DSM-IV PD categories from clinical observation and DSM-5 domains from trait research), they are converging on largely the same etiologic factors.
Supplementary Material
The supplementary material for this article can be found at https://doi.org/10.1017/S0033291717000824
Acknowledgements
This project was supported by Research Council of Norway grant 196148/V50. Previous collection and analysis of twin data from this project was in part supported by grant MH-068643 from the National Institutes of Health and grants from the Norwegian Research Council, the Norwegian Foundation for Health and Rehabilitation, the Norwegian Council for Mental Health, the Borderline Foundation, and the European Commission. These funding agencies played no role in the design and conduct of the study, its collection, management, analysis, and interpretation of the data or in the preparation, review, or approval of the manuscript.
Declaration of Interest
None.