1 Introduction
Representative democracy entails the aggregation of multiple policy issues by political parties into competing programs, or “manifestos,” which are then evaluated holistically by the electorate.Footnote 1 Indeed, one of the key functions of elections in representative democracies is preference aggregation (for useful reviews, see Powell Reference Powell, Boix and Stokes2007; Dewan and Shepsle Reference Dewan and Shepsle2011). In a direct democracy (e.g., a single-issue referendum), each voter is presented with alternative policies for a given issue and then chooses the policy he or she prefers most. As a result, election results directly reveal the distribution of policy preferences among voters for the specific issue. Direct democracy for all policy decisions, however, is infeasible for populations of large sizes. Thus, modern democracy in most cases is representative democracy, and parties serve the important function of aggregating diverse policies and simplifying alternatives for voters (e.g., Schattschneider Reference Schattschneider1942; Downs Reference Downs1957; Dalton, Farrell, and McAllister Reference Dalton, Farrell and McAllister2011).
Importantly, however, the nature of this preference aggregation process means that voters may not support all of the policy positions of the parties or candidates who ultimately get their votes. Voters typically make a single choice (i.e., of a particular party or candidate) that represents multiple policy positions (e.g., Roemer Reference Roemer1998; Benoit and Laver Reference Benoit and Laver2006; Dalton Reference Dalton2017). For example, a voter may choose a party that simultaneously proposes a tax increase, the allocation of a larger budget for education, and a less aggressive foreign policy, without necessarily supporting each of these components of the party’s policy program.
The problem of incomplete congruence between policy preferences and vote choice raises some important normative concerns about the functioning of representative democracy. For example, party leaders may deploy electoral campaign strategies that selectively emphasize policies that voters do not consider salient. Even worse, they may take positions that their most ardent supporters oppose. After observing election outcomes, leaders may claim that winning a majority of votes or seats grants them a mandate to implement all of their policy proposals (e.g., Kramer Reference Kramer1977; Conley Reference Conley2001; Fowler and Smirnov Reference Fowler and Smirnov2007), and this may even be considered a “responsible” course of action (Manin, Przeworski, and Stokes Reference Manin, Przeworski, Stokes, Przeworski, Stokes and Manin1999). Indeed, comparative research indicates a remarkable degree of consistency between what parties promise in pre-election manifestos and what parties do once in office (e.g., Klingemann, Hofferbert, and Budge Reference Klingemann, Hofferbert and Budge1994; Royed Reference Royed1996; Thomson Reference Thomson2001). However, voters may actually have considerably different preferences on some policy issues within a manifesto.
A fundamental challenge for both political scientists and policymakers is, therefore, to understand and identify the multidimensional policy preferences behind vote choices in representative democracies. In this study, we propose the use of conjoint analysis as an effective strategy to address this challenge. Conjoint analysis is a method that has been used in marketing research for many years, but has only recently been refined and adopted for use in political science (Hainmueller, Hopkins, and Yamamoto Reference Hainmueller, Hopkins and Yamamoto2014). By juxtaposing sets of multiple issue positions as hypothetical party manifestos (policy bundles) and asking respondents to choose the one they most prefer, conjoint analysis allows researchers to identify the effects of specific policy positions on the respondents’ overall assessment of manifestos, the degree of heterogeneity in preferences among them, and the popularity ranking of manifestos. Crucially, this approach improves upon standard measurement methods for policy preferences used in public opinion surveys in important ways, which we describe. We illustrate our approach with an experiment conducted during Japan’s 2014 House of Representatives election. To the best of our knowledge, this is the first study to use conjoint analysis to investigate the electorate’s holistic evaluation of parties’ policy manifestos as presented in the context of an actual election.
Our goal is to highlight the utility of conjoint analysis for analyzing voters’ multidimensional policy preferences in an electoral context. We argue that conjoint analysis is a particularly effective approach for this purpose. At the same time, we stress that we are not proposing that conjoint analysis should be used for the purpose of predicting overall election outcomes. Electoral outcomes in representative democracies are not only an incomplete reflection of voters’ multidimensional policy preferences, but are also affected by nonpolicy factors such as candidates’ personal attributes and the electoral institutions in use. The novelty of our proposed approach is in isolating the electorate’s policy preferences from other observable and unobservable factors that could affect actual election outcomes.
In what follows, we first introduce contextual information of our empirical case. In Section 3, we point out the limitations of standard survey questions and propose our alternative research design which addresses them, followed by a discussion of our statistical methodology. Section 4 reports the results of our analysis. The ruling coalition led by Prime Minister Shinzo Abe of the Liberal Democratic Party (LDP) framed the election around his economic policies (collectively dubbed “Abenomics”). After winning a resounding majority, Abe claimed a mandate to continue his economic agenda. However, our results reveal that voters’ support for Abenomics was no higher than for the policy positions of other parties contesting the election. Indeed, our analysis suggests that the LDP’s policy manifesto was actually among the least preferred bundles of policies offered to voters. In Section 5, we conduct several validity checks on our findings. The concluding section summarizes what we can learn from our conjoint analysis about the 2014 election, and discusses how the use of this method can contribute to future studies of electoral politics and representation.
2 Japan’s 2014 House of Representatives Election
Our empirical case comes from the Japanese House of Representatives election held on December 14, 2014. In mid-November, 2014, Prime Minister Abe suddenly signaled his intention to dissolve the House of Representatives. Many commentators questioned why an election was necessary, as the LDP and its coalition partner, Komeito, controlled a two-thirds majority in the chamber, and still had 2 more years left in the legislative term before another election would be constitutionally required. Abe publicly justified the snap election as necessary to seek voter approval for his government’s decision to delay a controversial increase in the consumption tax (VAT), scheduled to jump from 8% to 10% in 2015. More generally, the election was touted as a public referendum on the set of Abe’s economic policies known as “Abenomics,” which include the so-called “three arrows” of aggressive monetary policy, flexible fiscal policy, and structural reforms to Japan’s system of regulation to encourage private investment and growth. The first two arrows were launched in 2013 and met with some success (Ito Reference Ito2013). By the autumn of 2014, however, the third arrow still remained in Abe’s quiver, up against considerable opposition from the LDP’s traditional support base in the overprotected agriculture and health industries (Noble Reference Noble, Pekkanen, Reed and Scheiner2016).
Voters turned out in record-low numbers (53% of eligible voters) and the LDP-led ruling coalition again won a crushing victory over a fragmented opposition, with over 68% of the seats. The mixed-member electoral system combines 295 single-member districts (SMDs) allocated by plurality rule and 180 seats separately allocated to parties using closed-list proportional representation (PR) in eleven regional districts. The LDP won 76% of the SMD seats and 38% of the PR seats, while Komeito won 3% of the SMD seats and 14% of the PR seats. The Democratic Party of Japan (DPJ), the largest of the opposition parties and the governing party from 2009–2012, won just 13% of SMD seats and 19% of PR seats. After the election, Prime Minister Abe publicly stated that the LDP’s victory represented an approval of him and his economic policy agenda by the electorate. The media shared the same view. For example, the Yomiuri Shimbun, the largest daily newspaper in Japan, wrote, “There has now been a clear expression of the people’s will to see the Abenomics economic policy package continue.”Footnote 2
But was the election truly a referendum on Abenomics? Each of the main parties that contested the election took positions on Abe’s economic policies, to be sure, but parties also presented the electorate with different positions on a range of other issues, including nuclear energy, constitutional revision, and whether or not the size of the National Assembly (Diet) should be reduced. How can we know whether the LDP’s victory reflects voters’ preferences for Abenomics or any of the other policy positions taken in the election? Because parties represent multiple policy positions, voters’ evaluations of those parties can be quite complex. For example, since the triple disaster of the earthquake, tsunami, and nuclear crisis on March 11, 2011, some voters may be opposed to restarting nuclear power reactors (contrary to the LDP’s position), but generally in favor of Abenomics. Other voters may care more about the Abe Cabinet’s recent decision to reinterpret Japan’s pacifist constitution to allow for collective self-defense. How did they evaluate parties with conflicting positions on the issues they cared about?
The 2014 Japanese election is thus an ideal case for our purposes. Policy issues were front and center in the campaign, and political elites as well as the media largely portrayed the election as a single-issue referendum. Nevertheless, a range of other issues existed in the background, and even the main issue area of economic policy comprised several different components and alternatives. This context meant that each party actually represented a multidimensional set of relevant policies for voters to consider.
3 Experimental Design and Statistical Methodology
The case of Japan’s 2014 election exemplifies the fundamental problem in analyzing voter preferences in representative democracies, where the process of preference aggregation by parties makes it difficult to understand voters’ multidimensional preferences from the simple observation of election outcomes. In this section, we argue that conjoint analysis provides an effective means to address this problem. We first discuss why standard survey questions may have important limitations as a tool for understanding the multidimensional preferences underlying vote choice. We then describe the survey experiment we conducted in the days leading up to the 2014 election. Finally, we explain the statistical methodology we employ in the analysis of our survey data.Footnote 3
3.1 Limitations of standard survey questions
In addition to analyzing actual election outcomes, researchers commonly rely on surveys administered before and/or after an election to investigate the electorate’s preferences on specific policy issues. In such surveys, respondents are typically asked whether or how much they prefer a position on a particular policy issue over other positions, as well as how they rank policy issues in order of priority. For example, just after the 2014 election, a Nikkei Research poll asked Japanese voting-age adults a number of simple questions about policies, such as “Do you support the Abe administration’s decision to delay the increase of the consumption tax to 10% until 2017?” and gave them four options: “Yes,” “No,” “Can’t say either way,” and “Don’t know.” Later in the survey, respondents were asked “Which policy issue do you think the Abe administration should prioritize?” and allowed respondents to choose as many options as they liked from ten issues ranging from economic policy to foreign relations.Footnote 4 Similar survey questions are common in the American National Election Survey (ANES) and the Comparative Study of Electoral Systems (CSES) surveys, all aimed at understanding voters’ policy preferences and vote choice.
Despite their ubiquitous use in pre- and post-election surveys, such standard survey questions are limited in important ways as a means to analyze the multidimensional policy preferences underlying voters’ decisions. First, standard questions ask for a respondent’s preferences and priority ranking without putting them in the context of a vote choice. A commonly shared concern among survey researchers is that answers to survey questions can fluctuate considerably depending on how the questions are asked (e.g., Kahneman, Slovic, and Tversky Reference Kahneman, Slovic and Tversky1982). In particular, asking about a respondent’s opinions without putting them in a relevant context can drastically change the way he or she mentally processes the questions and provides an answer. Indeed, many researchers, particularly in the field of economics, are generally skeptical of survey-based research on preferences because of various framing effects (e.g., Bertrand and Mullainathan Reference Bertrand and Mullainathan2001). In this regard, standard survey questions are likely to suffer from distortion because they ask about issue preferences and preference rankings independently of voting intentions.Footnote 5
Second, standard questions artificially separate respondents’ implicit utility calculus behind their vote choices (or intentions) into two components: priority ranking of issues and preference ordering between positions on each issue. In actual voting decisions, these two steps are inseparably connected in voters’ minds. For example, a voter may evaluate a particular policy position differently depending on the other policies with which it is bundled in the proposed party platform. This would be plausible if, for example, a voter valued programmatic coherence of party manifestos. Thus, only after making assumptions about the psychology of preference aggregation does it become possible to infer a voter’s overall utility from any given policy bundle based on questions asked and measured separately in two different types of survey questions. In this sense, standard survey questions have no guarantee of uncovering the underlying multidimensional preferences of respondents and how these preferences are related to their vote choices in an election.
To see this more formally under the standard framework of random utility models (McFadden Reference McFadden and Zarembka1973), consider a voter who is casting a vote in an election. At stake in this election are three issues, which we label
 $a$
,
 $b$
, and
 $c$
. On these three issues, suppose that there are
 $P_{a}$
,
 $P_{b}$
, and
 $P_{c}$
policy positions proposed by the parties fielding candidates in the election, respectively, and that the voter gains the utility of
 $U_{ij}$
from position
 $j\in \{1,\ldots ,P_{i}\}$
on issue
 $i\in \{a,b,c\}$
. Assume further that the voter aggregates the three component utilities into his or her overall utility from voting for a party according to parameters attached to those components. We refer to these parameters as “weights” and denote them by
 $\unicode[STIX]{x1D6FD}_{i}$
. Making no further assumptions, we can write the voter’s overall utility from party
 $k\in \{1,\ldots ,K\}$
as,
 $$\begin{eqnarray}U_{k}=f\left(\unicode[STIX]{x1D6FD}_{a},\unicode[STIX]{x1D6FD}_{b},\unicode[STIX]{x1D6FD}_{c},\mathop{\sum }_{j=1}^{P_{a}}A_{kj}U_{aj},\mathop{\sum }_{j=1}^{P_{b}}B_{kj}U_{bj},\mathop{\sum }_{j=1}^{P_{c}}C_{kj}U_{cj},\unicode[STIX]{x1D6FE},\unicode[STIX]{x1D716}_{k}\right),\end{eqnarray}$$
where
 $A_{kj}$
,
 $B_{kj}$
and
 $C_{kj}$
are binary variables indicating whether or not party
 $k$
proposes position
 $j$
on policies
 $a$
,
 $b$
, and
 $c$
such that
 $\sum _{j=1}^{P_{a}}A_{kj}=\sum _{j=1}^{P_{b}}B_{kj}=\sum _{j=1}^{P_{c}}C_{kj}=1$
respectively,
 $\unicode[STIX]{x1D6FE}$
represents a vector of other parameters for the systematic component of the utility function, and
 $\unicode[STIX]{x1D716}_{k}$
is a stochastic component. Note that equation (1) entails no assumption about the form of the (random) utility function, other than the fact that it takes the three component utilities (
 $U_{ij}$
) and weights (
 $\unicode[STIX]{x1D6FD}_{i}$
) as inputs into the systematic component.
The standard survey design amounts to measuring the components of equation (1) separately in the hope that it might help to identify the overall utility
 $U_{k}$
for each voter. For example, a question asking whether respondents support a policy position proposed by the government can be thought of as a measurement on
 $U_{ij}$
which identifies its value up to its ranking relative to
 $U_{ij^{\prime }}$
where
 $j^{\prime }\neq j$
. A question that asks respondents to rank issues in terms of priority can be regarded as measuring
 $\unicode[STIX]{x1D6FD}_{i}$
, again up to their relative ordering. However, it is evident from equation (1) that attempts to make inferences about the overall utility
 $U_{k}$
based on these partial measurements are futile without additional assumptions about the form of
 $f(\cdot )$
.
For example, suppose that the analyst is willing to assume that the overall utility is a linear combination of the component utilities, and the weights on the component utilities are given by their order of priority. Under this assumption, equation (1) can now be written as,
 $$\begin{eqnarray}U_{k}=\unicode[STIX]{x1D6FC}+\unicode[STIX]{x1D6FD}_{a}\mathop{\sum }_{j=1}^{P_{a}}A_{kj}U_{aj}+\unicode[STIX]{x1D6FD}_{b}\mathop{\sum }_{j=1}^{P_{b}}B_{kj}U_{bj}+\unicode[STIX]{x1D6FD}_{c}\mathop{\sum }_{j=1}^{P_{c}}C_{kj}U_{cj}+\unicode[STIX]{x1D716}_{k},\end{eqnarray}$$
where
 $\unicode[STIX]{x1D6FC}=\unicode[STIX]{x1D6FE}$
in equation (1). Note that equation (2) takes the form of the standard random utility model that is often used to study the relationship between vote intentions or reported vote choices and issue opinions (e.g., Alvarez and Nagler Reference Alvarez and Nagler1995; Alvarez, Nagler, and Bowler Reference Alvarez, Nagler and Bowler2000). Therefore, once the overall utility is specified and an additional assumption is made on the distribution of the stochastic component (
 $\unicode[STIX]{x1D716}_{k}$
), it can be mapped onto the observed vote choice as follows,
 $$\begin{eqnarray}\Pr (Y_{k}=1\mid A,B,C)=\Pr (U_{k}\geqslant U_{k^{\prime }}\forall k^{\prime }\in \{1,\ldots ,K\}\mid A,B,C),\end{eqnarray}$$
where
 $Y_{k}$
is a binary indicator of choosing party
 $k$
and
 $A$
,
 $B$
, and
 $C$
represent vectors of the policy position indicators for all
 $K$
parties.
Although this approach affords researchers a straightforward way to analyze voter preferences, it is fraught with risks of misleading inferences. First and foremost, there is typically no theoretical justification for the particular functional form assumed in equation (2). For example, voters who value programmatic coherence of parties may evaluate policy positions in light of positions on other policies in the manifesto. Such contingent effects must be included in the utility model as interaction terms, which equation (2) overlooks. Second, even if the researcher somehow manages to specify the utility model correctly, there is no guarantee that the standard types of survey questions can validly measure its components (
 $U_{ij}$
and
 $\unicode[STIX]{x1D6FD}_{j}$
), particularly when these questions are asked outside the context of vote choice. Indeed, typical questions only measure component preferences and weights in terms of their relative ranking with one another, so the researcher must make another set of strong assumptions to complete the mapping from the measurements to the overall utility function behind the single vote choice.
3.2 Our experimental design
We propose the use of conjoint analysis as a more effective alternative. Conjoint analysis is a survey experiment method in which respondents are presented with multiple hypothetical profiles randomly generated by juxtaposing sets of multiple attributes, each of which has multiple levels, and are then asked to choose the profile they would prefer most. In our experiment, we generated hypothetical summaries of party manifestos, each of which includes positions for various important policy issues. We then asked respondents to choose the one they would prefer most. In recent years, there has been an increasing use of conjoint analysis in several substantive research areas in political science, such as attitudes toward immigrants and political candidates (e.g., Hainmueller and Hopkins Reference Hainmueller and Hopkins2015; Franchino and Zucchini Reference Franchino and Zucchini2015), Eurozone bailout policies (Bechtel, Hainmueller, and Margalit Reference Bechtel, Hainmueller and Margalit2014), and global climate change cooperation (Bechtel and Scheve Reference Bechtel and Scheve2013). As far as we are aware, we are the first to use conjoint analysis in the context of an actual ongoing electoral campaign to study voters’ policy preferences.
We designed and implemented our experiment as follows. In the run-up to the start of the campaign on December 2, we pored through each of the five major national daily newspapers (Asahi, Yomiuri, Mainichi, Sankei, and Nikkei) to determine which issues were being discussed by the media. Upon publication of the official party manifestos, we examined each to decide on the final set of policy issues that we judged to be most prominent in the election.Footnote 6 The major issues of the campaign were (1) the consumption tax increase, (2) employment policy, (3) monetary and fiscal policy, (4) economic growth strategy, (5) nuclear energy (specifically, whether or not to restart nuclear power reactors), (6) Trans-Pacific Partnership (TPP) trade agreement membership, (7) the right to collective self-defense, (8) constitutional revision, and (9) National Assembly seat reduction. Issues 2–4 are the most directly related to Prime Minister Abe’s economic policy agenda, Abenomics.
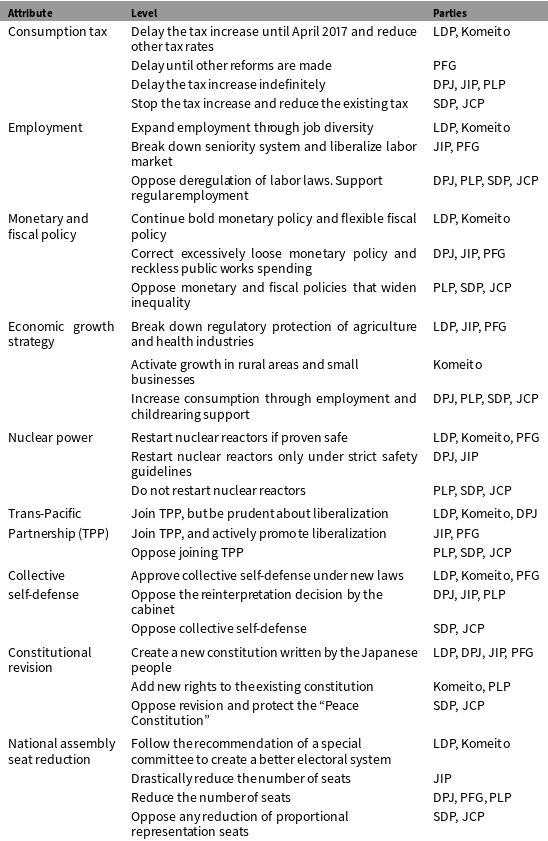
For each of these nine issues, we generated 3–4 distinct positions that succinctly but accurately summarized the actual positions of all nine major parties that contested the election: LDP, Komeito, DPJ, Japan Innovation Party (JIP), Party for Future Generations (PFG), People’s Life Party (PLP), Social Democratic Party (SDP), and Japan Communist Party (JCP). We excluded the policy positions of minor and fringe parties, as well as independents. Some of the parties held the same basic positions on certain issues. For example, the LDP and Komeito campaigned predominantly on a common platform as partners in the coalition government. However, only two parties (SDP and JCP) were coded as having identical positions on all of the nine main issues.Footnote 7 The complete set of policy positions, and their correspondence with the actual party manifestos, is shown in Table 1 (translated into English).
Levels of attributes used in the conjoint experiment. Each level (middle column) represents a concise summary of the position on the corresponding policy issue (left column) proposed by the parties (right column) in election manifestos.

In our experiment, we presented each respondent with a table containing two hypothetical party manifestos with positions on the nine policy issues (randomly ordered for each respondent), and asked “Imagine, hypothetically, that the following two parties were nominating candidates in this general election. Which party would you support? Even if you are not entirely sure, please indicate which of the two you would be most inclined to support.” For each issue, one of the 3–4 policy positions was randomly assigned to each party. Each respondent then registered his or her preference for one of the two hypothetical parties, and this exercise was repeated five times.Footnote 8 After the five conjoint exercises, we asked each respondent a number of questions about their social demographic background, political ideology and partisanship, vote intention in the SMD and PR tiers of the election, and support for the Abe Cabinet.
The advantage of our conjoint analysis over standard survey questions is twofold. First, conjoint analysis jointly measures, based on a response to a single exercise, how much each issue is relevant for voters in choosing a hypothetical party and which position on each issue is more preferable compared to other positions.Footnote 9 As discussed in Section 3.1, an important drawback of the standard approach is that the analyst must make an untestable assumption about how the preferences on different policy dimensions and their relative weights are aggregated into a single utility value leading to a vote choice. Conjoint analysis, on the other hand, makes such potentially arbitrary assumptions unnecessary by using each respondent’s observed response (i.e., the selection of the most preferred policy bundle) as the basis for making inferences about his or her multidimensional policy preferences.
More formally, Hainmueller, Hopkins, and Yamamoto (Reference Hainmueller, Hopkins and Yamamoto2014) show that the fully randomized conjoint analysis nonparametrically identifies the average marginal component effect (AMCE) for each of the attribute levels on the probability of choosing a profile. What this means is that conjoint analysis allows researchers to estimate how much a policy position, on average, increases or decreases a respondent’s utility for choosing a bundle containing that policy position.Footnote
10
In the random utility framework we introduced above, the AMCE for position 1 as opposed to position 2 on issue
 $A$
is equal to the following quantity,
 $$\begin{eqnarray}\Pr (Y_{k}=1\mid A_{1k}=1)-\Pr (Y_{k}=1\mid A_{2k}=1),\end{eqnarray}$$
or equivalently,
 $$\begin{eqnarray}\Pr (U_{k}\geqslant U_{k^{\prime }}\forall k^{\prime }\in \{1,\ldots ,K\}\mid A_{1k}=1)-\Pr (U_{k}\geqslant U_{k^{\prime }}\forall k^{\prime }\in \{1,\ldots ,K\}\mid A_{2k}=1).\end{eqnarray}$$
Thus, conjoint analysis allows us to identify the effect of a policy position on the relative magnitude of the overall utility behind a respondent’s party preference. Moreover, since the AMCE is estimated on the same scale for each issue, analysts can easily compare the effect sizes across different issues and make inferences about the relative weights of the issues when a respondent chooses his or her most preferred party. It is crucial to note that this identification is achieved without any assumption about the underlying form of a voter’s utility calculus, in contrast to the approach based on standard survey questions discussed in Section 3.1.
Second, our conjoint approach forces respondents to evaluate policy packages as a whole and to make a choice, just as they would do in the real election. Conjoint-like tables of parties’ actual policy positions are often found in pre-election newspaper coverage of party manifestos, particularly in multiparty parliamentary democracies where voters must compare and choose from among many alternatives. Indeed, some of the newspapers we used to identify the major issues of the campaign had already presented the contrasting positions of the parties on major issues in a simple summary table for readers. Such pre-election newspaper reports, and even party campaign materials, condense information about policy positions for voters to evaluate. The fact that Japanese voters were probably exposed to similar tables with the same kind of condensed information in the real world enhances the external validity of our analysis. Moreover, due to strict campaign regulations, official party manifestos with detailed information about policy positions are not readily available to most voters; the typical Japanese voter learns about parties’ policy positions from conjoint-like tables presented in the news media during the campaign.
Our survey was implemented by Research Now, which recruited respondents online during the period between December 4 (two days into the campaign) and the morning of December 14 (when polls opened). Our sample of 1,951 respondents is not a probability sample, but is roughly representative of the general population in terms of observed demographic characteristics of age, gender, prefecture of residence, income, and educational background. In our main empirical analysis, we correct for the observed imbalance between our online sample of respondents and the target population of Japanese voting-age adults in terms of these key demographic covariates using poststratification weights obtained via entropy balancing (Hainmueller Reference Hainmueller2012). The results are qualitatively identical with or without the use of these weights.Footnote 11
3.3 Statistical methodology
We employ three different types of techniques for analyzing the data from our conjoint survey experiment in order to extract quantities that speak to our interests.Footnote 12 First, we are interested in identifying the relative salience of the nine policy issues, and respondents’ preferences for positions on these issues. In other words, we ask: Which policy issues are more relevant in respondents’ choice over manifestos, and which specific positions on those issues are most positively or negatively evaluated by the respondents?
To answer these questions, we follow the approach proposed by Hainmueller, Hopkins, and Yamamoto (Reference Hainmueller, Hopkins and Yamamoto2014) and estimate the AMCEs of the policy positions using their regression-based estimator. Hainmueller, Hopkins, and Yamamoto (Reference Hainmueller, Hopkins and Yamamoto2014) show that, when attribute levels are randomized independently from one another, the ordinary least squares (OLS) estimates of the coefficients from the linear regression of the choice indicator on the set of dummy variables for the levels of the attributes provide unbiased and consistent estimates of the AMCEs. We follow this procedure and report confidence intervals that are robust to the correlation of preferences within each respondent.
Second, although the AMCEs provide meaningful information about the overall average effects of the policy positions on respondents’ preferences over manifestos, they may mask important heterogeneity in these effects across different types of respondents. For example, a policy position may have zero average effect on choice probability either because every respondent is indifferent about the policy or because there are two equally sized groups of respondents who each strongly like and dislike the position. The identification of effect heterogeneity is indeed crucial for understanding the preferences behind vote choices in multiparty elections, since parties’ policy programs are often targeted toward particular segments of the electorate. Our next question is therefore: How does the effect of each policy position vary systematically across groups of respondents?
To answer this question, we use a hierarchical Bayes approach to model the variability in the AMCEs of the policy positions as functions of respondents’ partisanship.Footnote 13 Our quantities of interest, therefore, are the means of respondent-varying AMCEs for the party groups. The variation in these quantities will be small and centered around the overall AMCE estimate from the first analysis if there is little heterogeneity in preferences across the party groups about the policy position. On the contrary, the variation will be large if the party groups have more heterogeneous policy preferences.
Third, a crucial step in identifying the multidimensional preferences behind vote choice via conjoint analysis is to map the estimated AMCEs back onto preferences among bundled policy options. It is of particular interest to estimate the popularity of the policy bundles actually proposed by the parties fielding candidates in the concurrent real election and see how they fare against one another. That is, we ask: What is the relative popularity of the actual policy bundles proposed by parties?
To answer this question, we first estimate the choice probability of each unique policy bundle by modeling the choice indicator as a function of the policy positions that occurred in the data. An important consideration here is that the specification for our model should be flexible enough to accommodate nonadditive effects of policy positions. To this end, we model respondents’ party choice as a linear function of all policy position indicators and their pairwise interaction terms.Footnote 14 This model, however, requires a careful estimation strategy because it contains a large number of regressors.Footnote 15 Fitting the model simply via OLS would run the risk of overfitting and poor predictive performance. To address the issue of potential overfitting, we employ the regularization technique called ridge regression (Hoerl and Kennard Reference Hoerl and Kennard1970).Footnote 16 After obtaining the coefficient estimates, we estimate the ranking of each unique policy bundle by enumerating all possible combinations of policy positions and calculating their predicted choice probabilities. We also obtain the confidence intervals for these ranks via the block bootstrap at the respondent level, again to allow for the possibility of intra-respondent correlation of preferences. Based on these estimated rankings, we evaluate how the bundles that correspond to the actual party manifestos fare against one another.
4 Results
We now present the key findings from our empirical analysis. As discussed in Section 3.3, we evaluate (1) the average effects of a range of policy positions on respondents’ choice of policy manifesto, (2) the potential underlying heterogeneity across groups, and (3) the relative ranking of actual party manifestos.
4.1 Average effects of policy positions on overall preferences
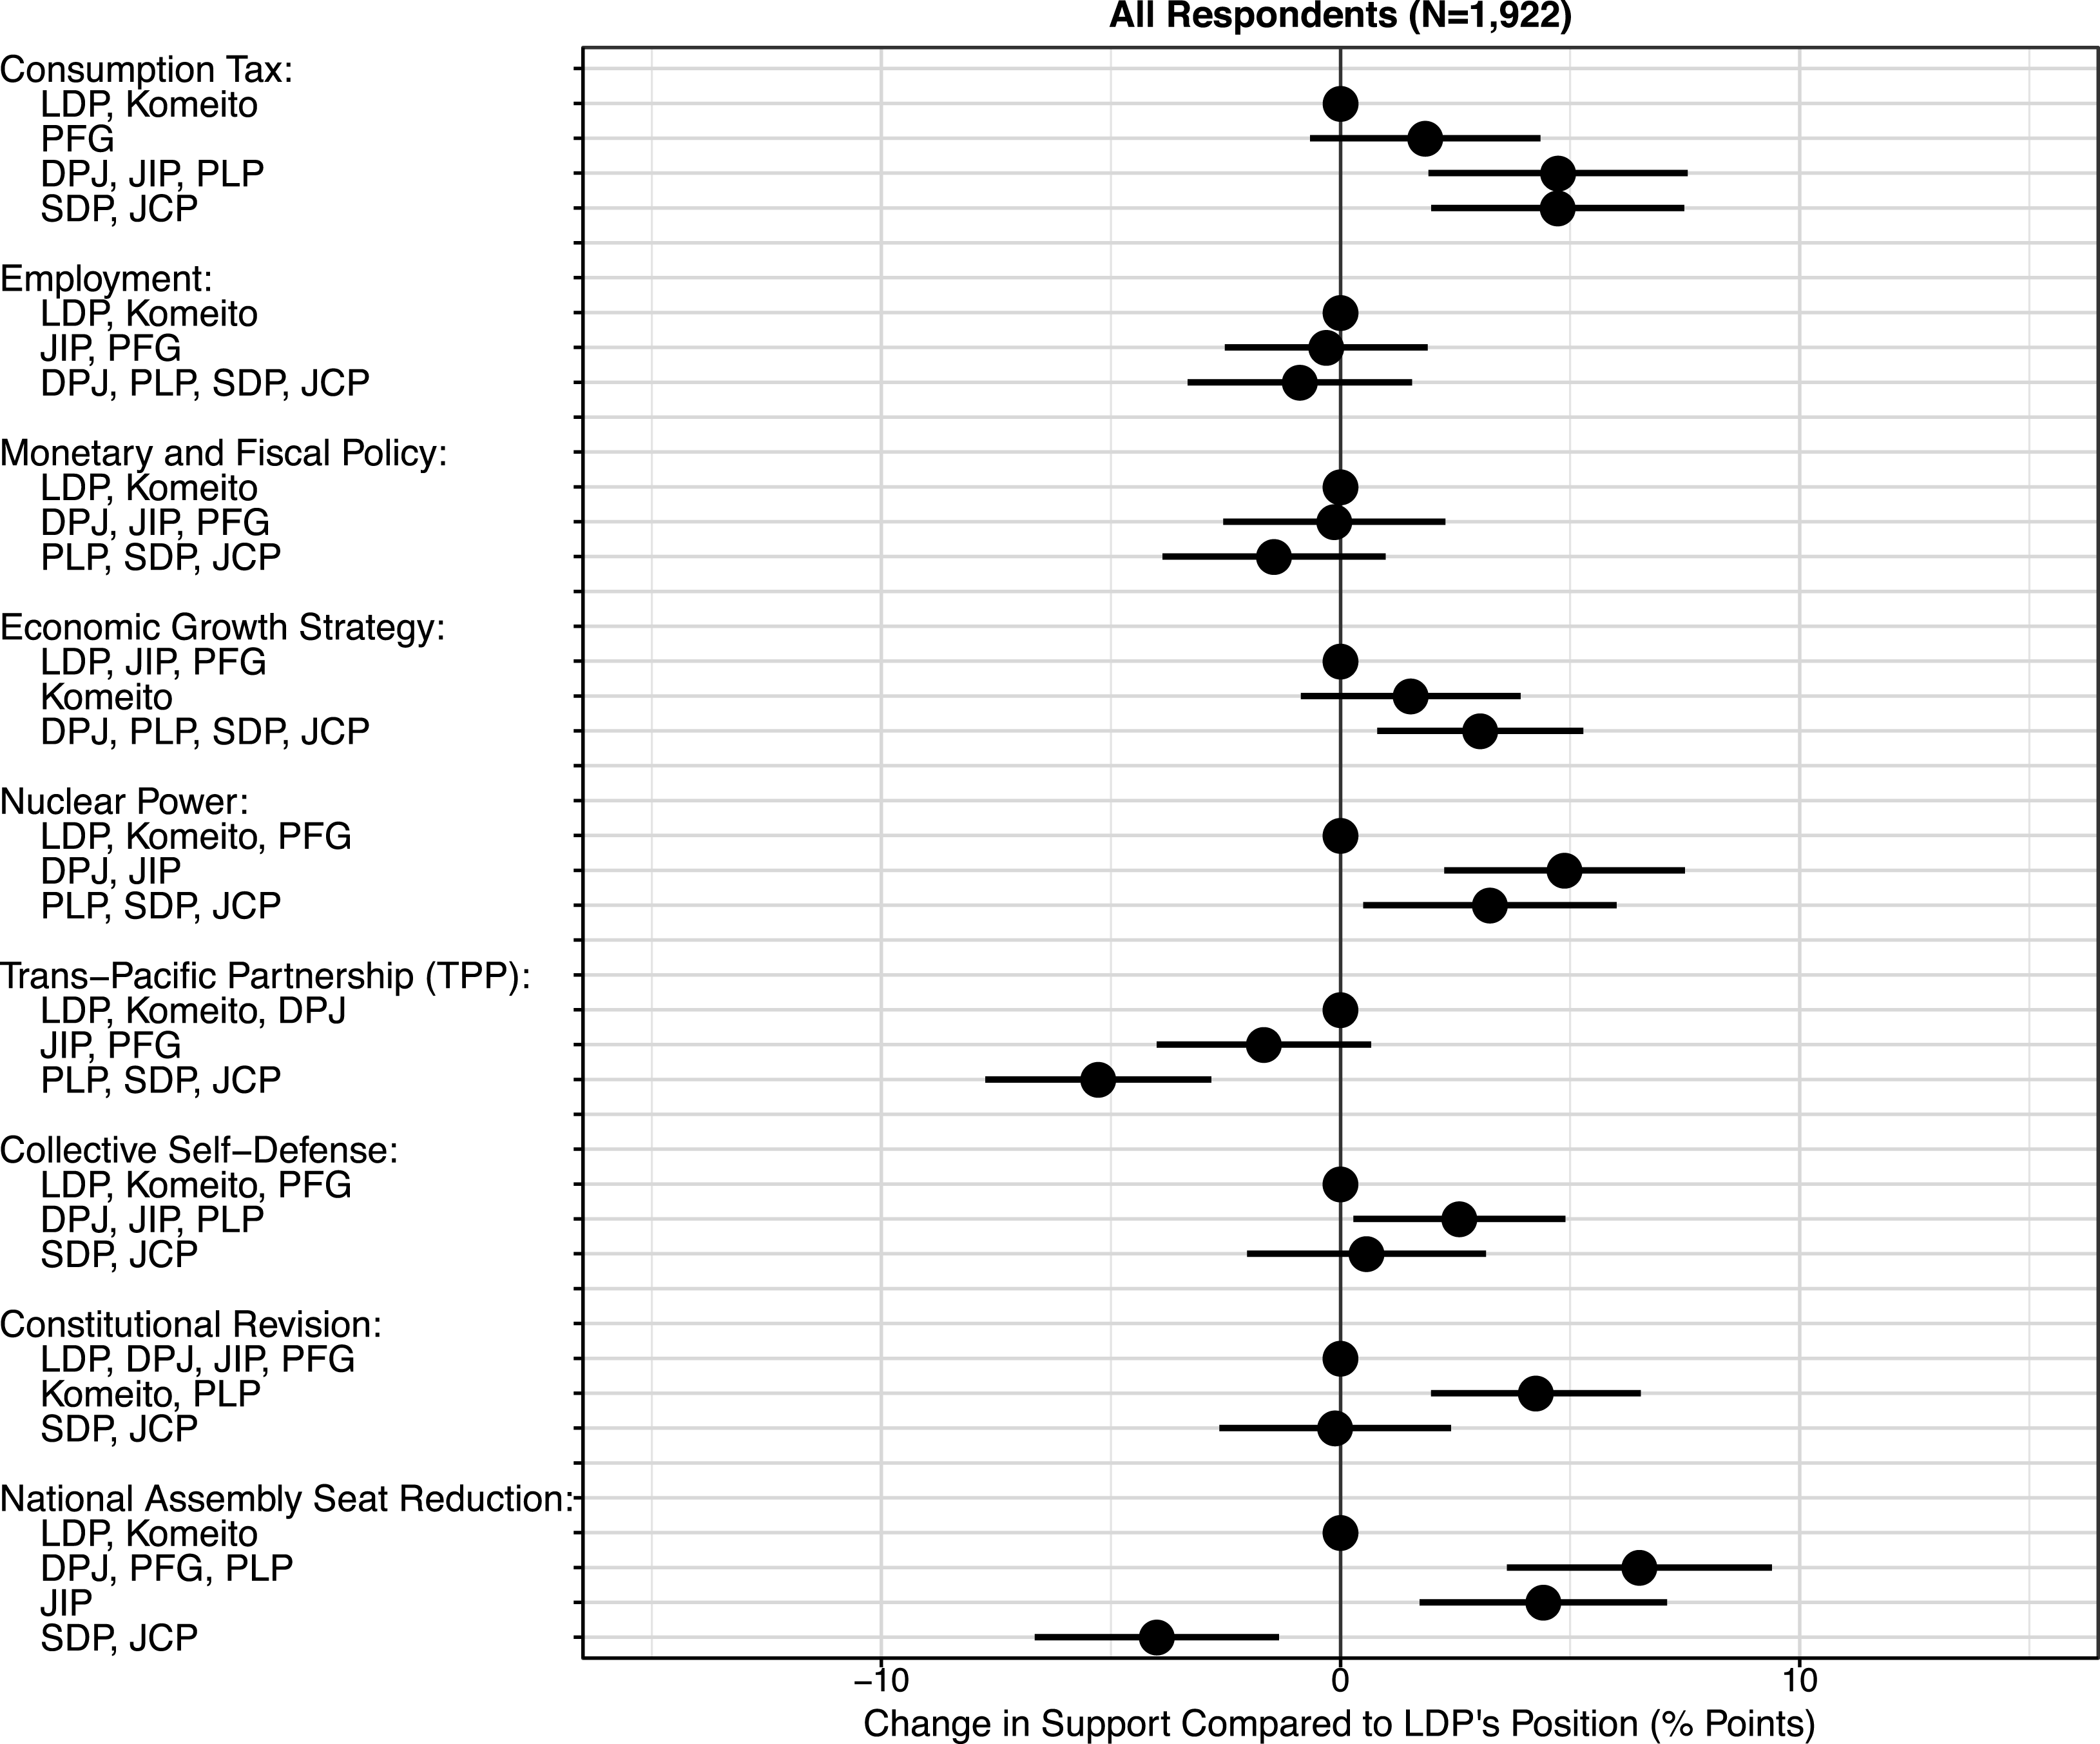
We start with the analysis of average preferences between hypothetical manifestos for the respondents in our sample as a whole. The results are shown in Figure 1. The figure presents the estimated AMCEs for non-LDP policy positions (solid circles) along with cluster-robust 95% confidence intervals (horizontal bars). The estimates are grouped into the nine policy issues we included in our conjoint experiment. The correspondence between the policy positions and actual party manifestos is indicated by the party acronyms on the left. On each policy issue, the LDP’s position is indicated by a solid circle on the zero line without an interval estimate. The actual policy positions are provided in Table 1.
For example, on the Consumption Tax issue, the actual policy position of the PFG (“Delay until other reforms are made”) is estimated to increase the choice probability for a manifesto by about 1.8 percentage points, compared to the baseline position of “Delay the tax increase until April 2017 and reduce other tax rates” which was proposed by the LDP and Komeito in the actual election manifestos. The 95% confidence interval for this estimate, however, is
 $[-0.7,4.4]$
and contains zero. On the other hand, the other two positions (“Delay the tax increase indefinitely” proposed by the DPJ, JIP, and PLP and “Stop the tax increase and reduce the existing tax” by the SDP and JCP) are found to be even more popular on average, with both AMCEs estimated to be about 4.7 percentage points with 95% confidence intervals of
 $[1.9,7.6]$
and
 $[2.0,7.5]$
, respectively.
Average effects of policy positions on respondents’ preference for a hypothetical party manifesto. Each solid circle in the plot represents the estimated average marginal component effect (AMCE) of a policy position on a respondent’s probability of choosing a hypothetical manifesto containing that position, compared against a manifesto with the baseline (i.e., LDP’s) position on that policy. The horizontal bars represent 95% confidence intervals robust to clustering at the respondent level. See Table 1 for the actual policy position labels.

A striking pattern in the estimates shown in Figure 1 is that the estimated AMCEs tend to be more often positive than negative on many policy dimensions, indicating that the LDP’s policy positions were not as popular as one might have expected from the actual election results. Indeed, of the eleven policy positions where support is estimated to be significantly different (at the 0.05 level) from support for the LDP’s position, nine turn out to be more popular than the LDP’s position on the corresponding policy dimension. For example, on the issue of Nuclear Power, the position of “Restart[ing] nuclear reactors if proven safe” proposed by both parties in the government coalition is decidedly less popular than the other two positions taken by the opposition parties (“Restart nuclear reactors only under strict safety guidelines” proposed by the DPJ and JIP and “Do not restart nuclear reactors” by the PLP, SDP, and JCP), which have the estimated AMCEs of 4.9 and 3.3 percentage points with 95% confidence intervals of
 $[2.3,7.5]$
and
 $[0.5,6.0]$
, respectively. Moreover, the only two positions that are estimated to be significantly less popular than the LDP’s (“Oppose joining TPP” and “Oppose any reduction of proportional representation seats”) were proposed by opposition parties on the extreme left, rather than the LDP’s main competitors in the election, the DPJ and JIP.
Another remarkable finding is that the three policy issues that constitute Abenomics—Employment, Monetary and Fiscal Policy, and Economic Growth Strategy—are found to have only small effects on the choice probability, if any, while other, noneconomic issues such as Constitutional Revision and National Assembly Seat Reduction are estimated to have large impacts on respondents’ preferences over manifestos. Indeed, all but one of the policy positions that either explicitly support or oppose Abe’s three arrows are estimated to have effects that are statistically indistinguishable from zero. The only exception is the Economic Growth Strategy position of “Increase consumption through employment and childrearing support” proposed by opposition parties such as the DPJ, PLP, JCP and SDP, which is estimated to have a small but significantly positive effect (3.0 percentage points, 95% CI
 $[0.8,5.3]$
). This finding runs directly counter to the popular belief that the election was a single-issue election that amounted to a referendum on Abenomics.
4.2 Underlying heterogeneity
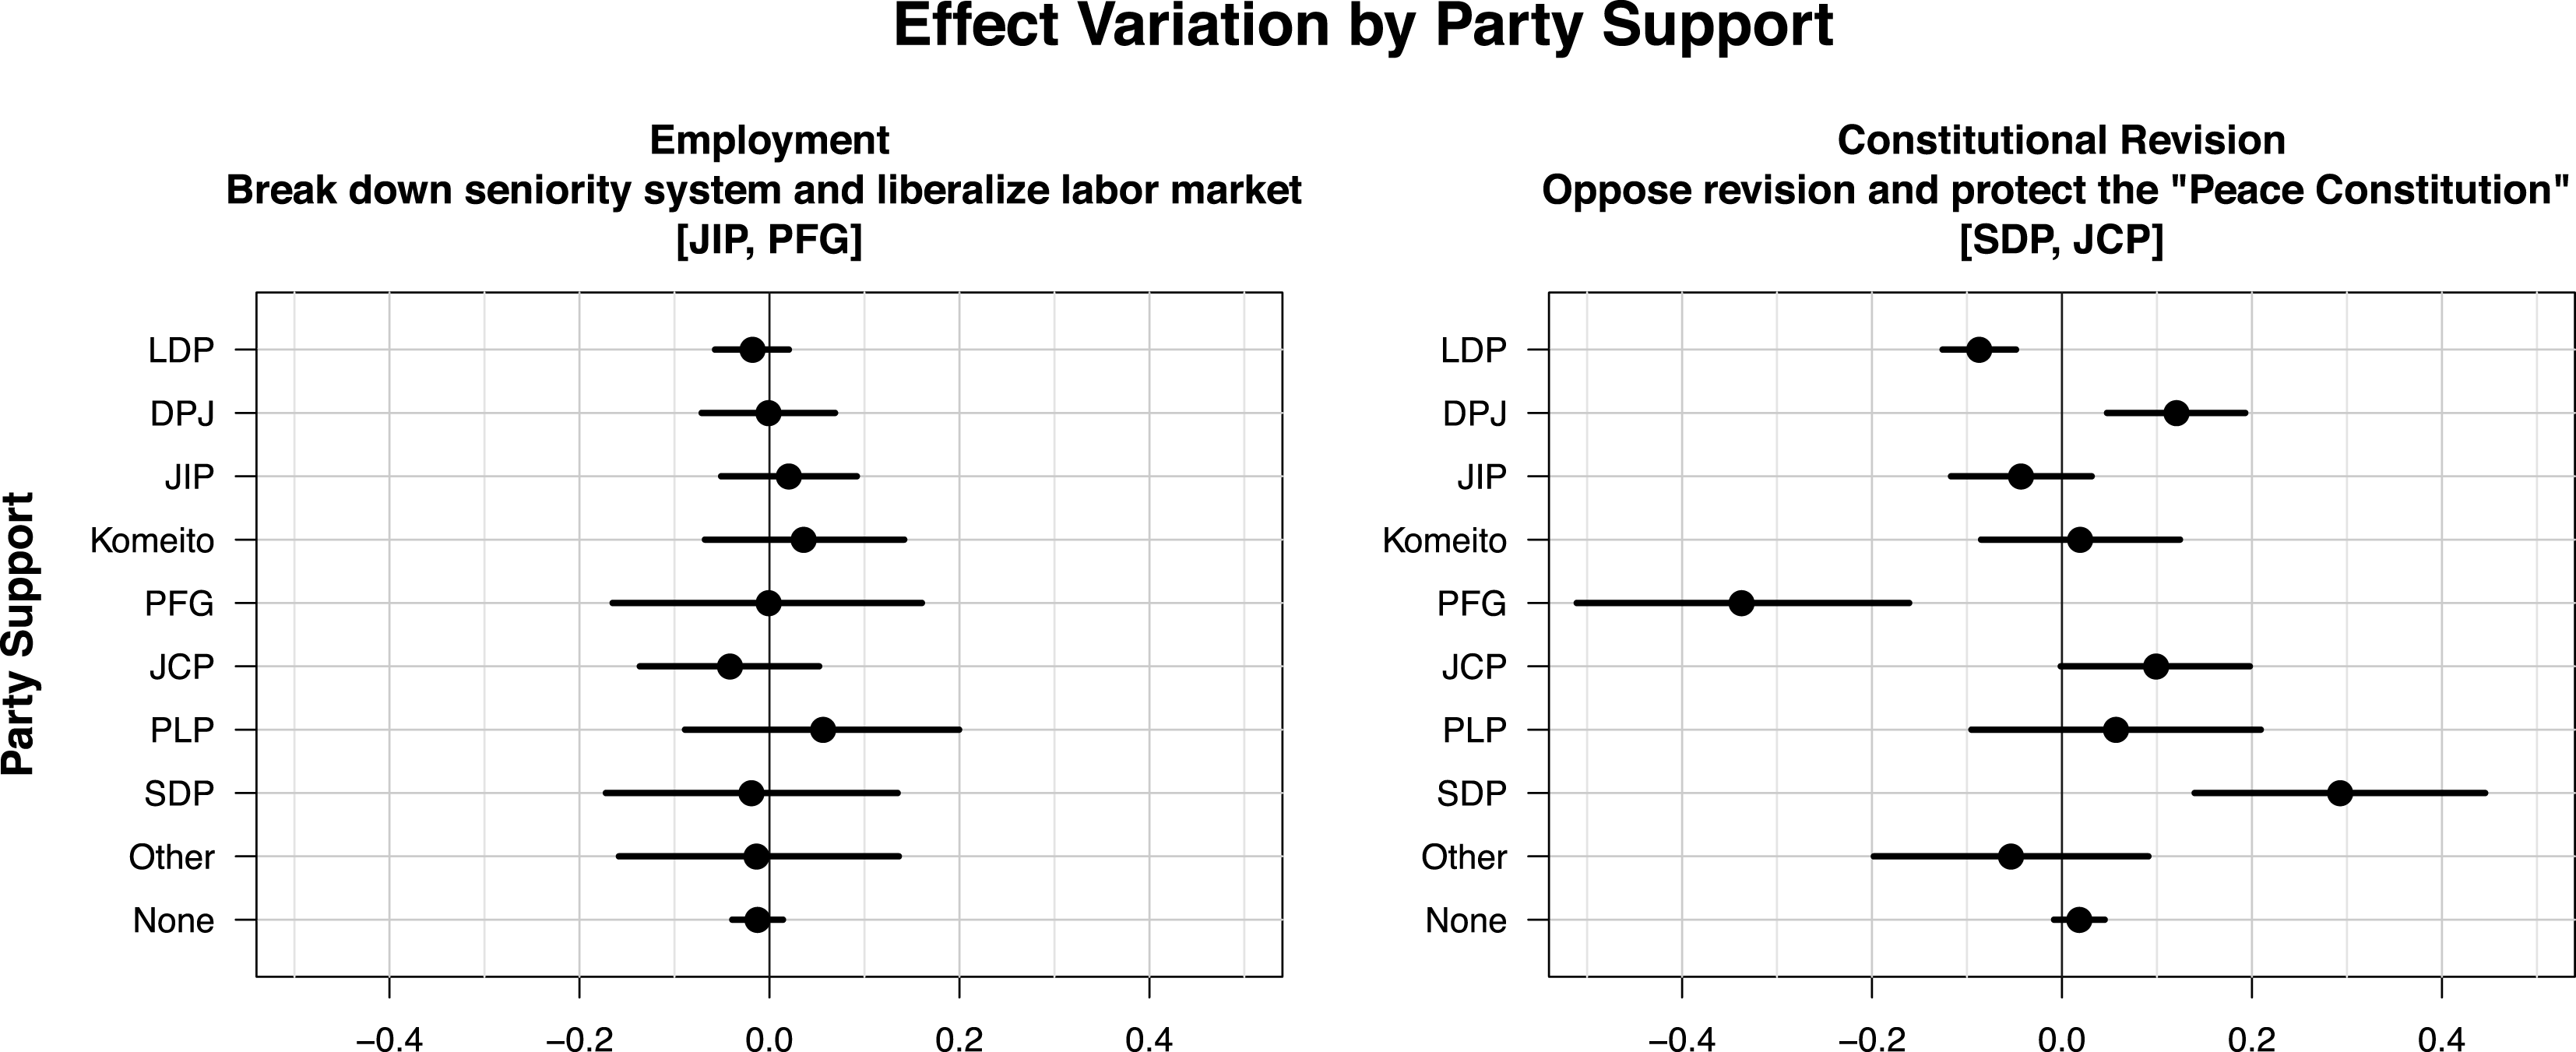
Next, we analyze the degree of heterogeneity in respondents’ preferences with respect to the policy positions in our survey. As discussed in Section 3.3, the overall AMCEs reported in Figure 1 represent the effects of the policy positions averaged across all respondents and may, therefore, hide important variation in their preferences. Figure 2 shows that this is indeed the case for some of the policy issues in our experiment. As an illustration, we present the results for two of the twenty policy positions (see Online Appendix D for the full set of results). On the left, we show the estimated AMCE for one of the Employment positions (“Break down seniority system and liberalize labor market”) compared against the LDP’s baseline position (“Expand employment through job diversity”) for each of the ten respondent groups based on their partisanship, along with the 95% posterior credible intervals. On the right, we show similar estimates for one of the Constitutional Revision positions (“Oppose revision and protect the ‘Peace Constitution”’ compared against “Create a new constitution written by the Japanese people”). Even though the overall AMCEs for these two policy positions are both very close to zero (see Figure 1), our estimates in Figure 2 reveal a striking contrast in terms of heterogeneity underlying those null average effects.
Heterogeneity in effects of policy positions by party support. The figures summarize the posterior distributions of effects of two policy positions (indicated at the top of each plot), modeled as functions of party respondents usually support (indicated on the vertical axis). The solid circles represent the posterior means of the group-specific AMCEs and the horizontal bars represent 95% credible intervals.

Specifically, for the employment policy, the estimated group-specific average effects are distributed tightly around the overall AMCE with little variability across party groups. Indeed, all ten estimated average effects are indistinguishable from zero at the conventional 0.05 significance level, as indicated by their posterior intervals overlapping with the zero line. This implies that respondents were uniformly indifferent between the employment policy position put forth by the government (LDP and Komeito) and that proposed by the opposition (JIP and PFG) regardless of their own partisanship.
In contrast, the respondents were sharply divided on their preferences about the protectionist position on the Constitution put forth by the SDP and JCP compared to the revisionist position proposed by the LDP, DPJ, JIP, and PFG. The estimated average effects for the position are found to be highly variable depending on respondents’ partisanship. Two respondent groups supporting conservative parties (LDP and PFG) exhibit large and statistically significant preferences against the protectionist position, while supporters of the more liberal opposition parties (DPJ and SDP) indicate equally large, significant preferences in favor of the position. Note that on this issue, the DPJ’s core supporters appear to disagree with the party’s actual position. On the whole, the respondents are estimated to be indifferent between revising and protecting the current constitution on average, as indicated by the estimated AMCE of zero in Figure 1. However, our analysis of the underlying heterogeneity reveals the sharp divergence in preferences with respect to these positions across respondents with different partisanship. Other issues with considerable heterogeneity across groups include nuclear power and collective self-defense (see Online Appendix D). The large heterogeneity across groups for the issues of constitutional revision and collective self-defense are in line with the conventional wisdom that security policy is the most salient cleavage in Japanese politics (e.g., Otake Reference Otake1999).
4.3 Ranking of party manifestos
The final crucial step in analyzing respondents’ multidimensional policy preferences based on a conjoint experiment is to estimate the relative popularity of the policy bundles as a whole against one another. In the actual election, the LDP received 33% of the vote in the PR tier of the electoral system, which is fully contested by all parties and lacks the pressure to vote strategically that exists in the SMD tier, making it a better expression of voters’ party preferences. The other major parties’ PR vote shares were as follows: DPJ (18%), JIP (16%), Komeito (14%), JCP (11%), PFG (3%), SDP (2%), PLP (2%).Footnote 17 How do these actual vote shares compare to the estimated preferences for the parties’ manifestos?
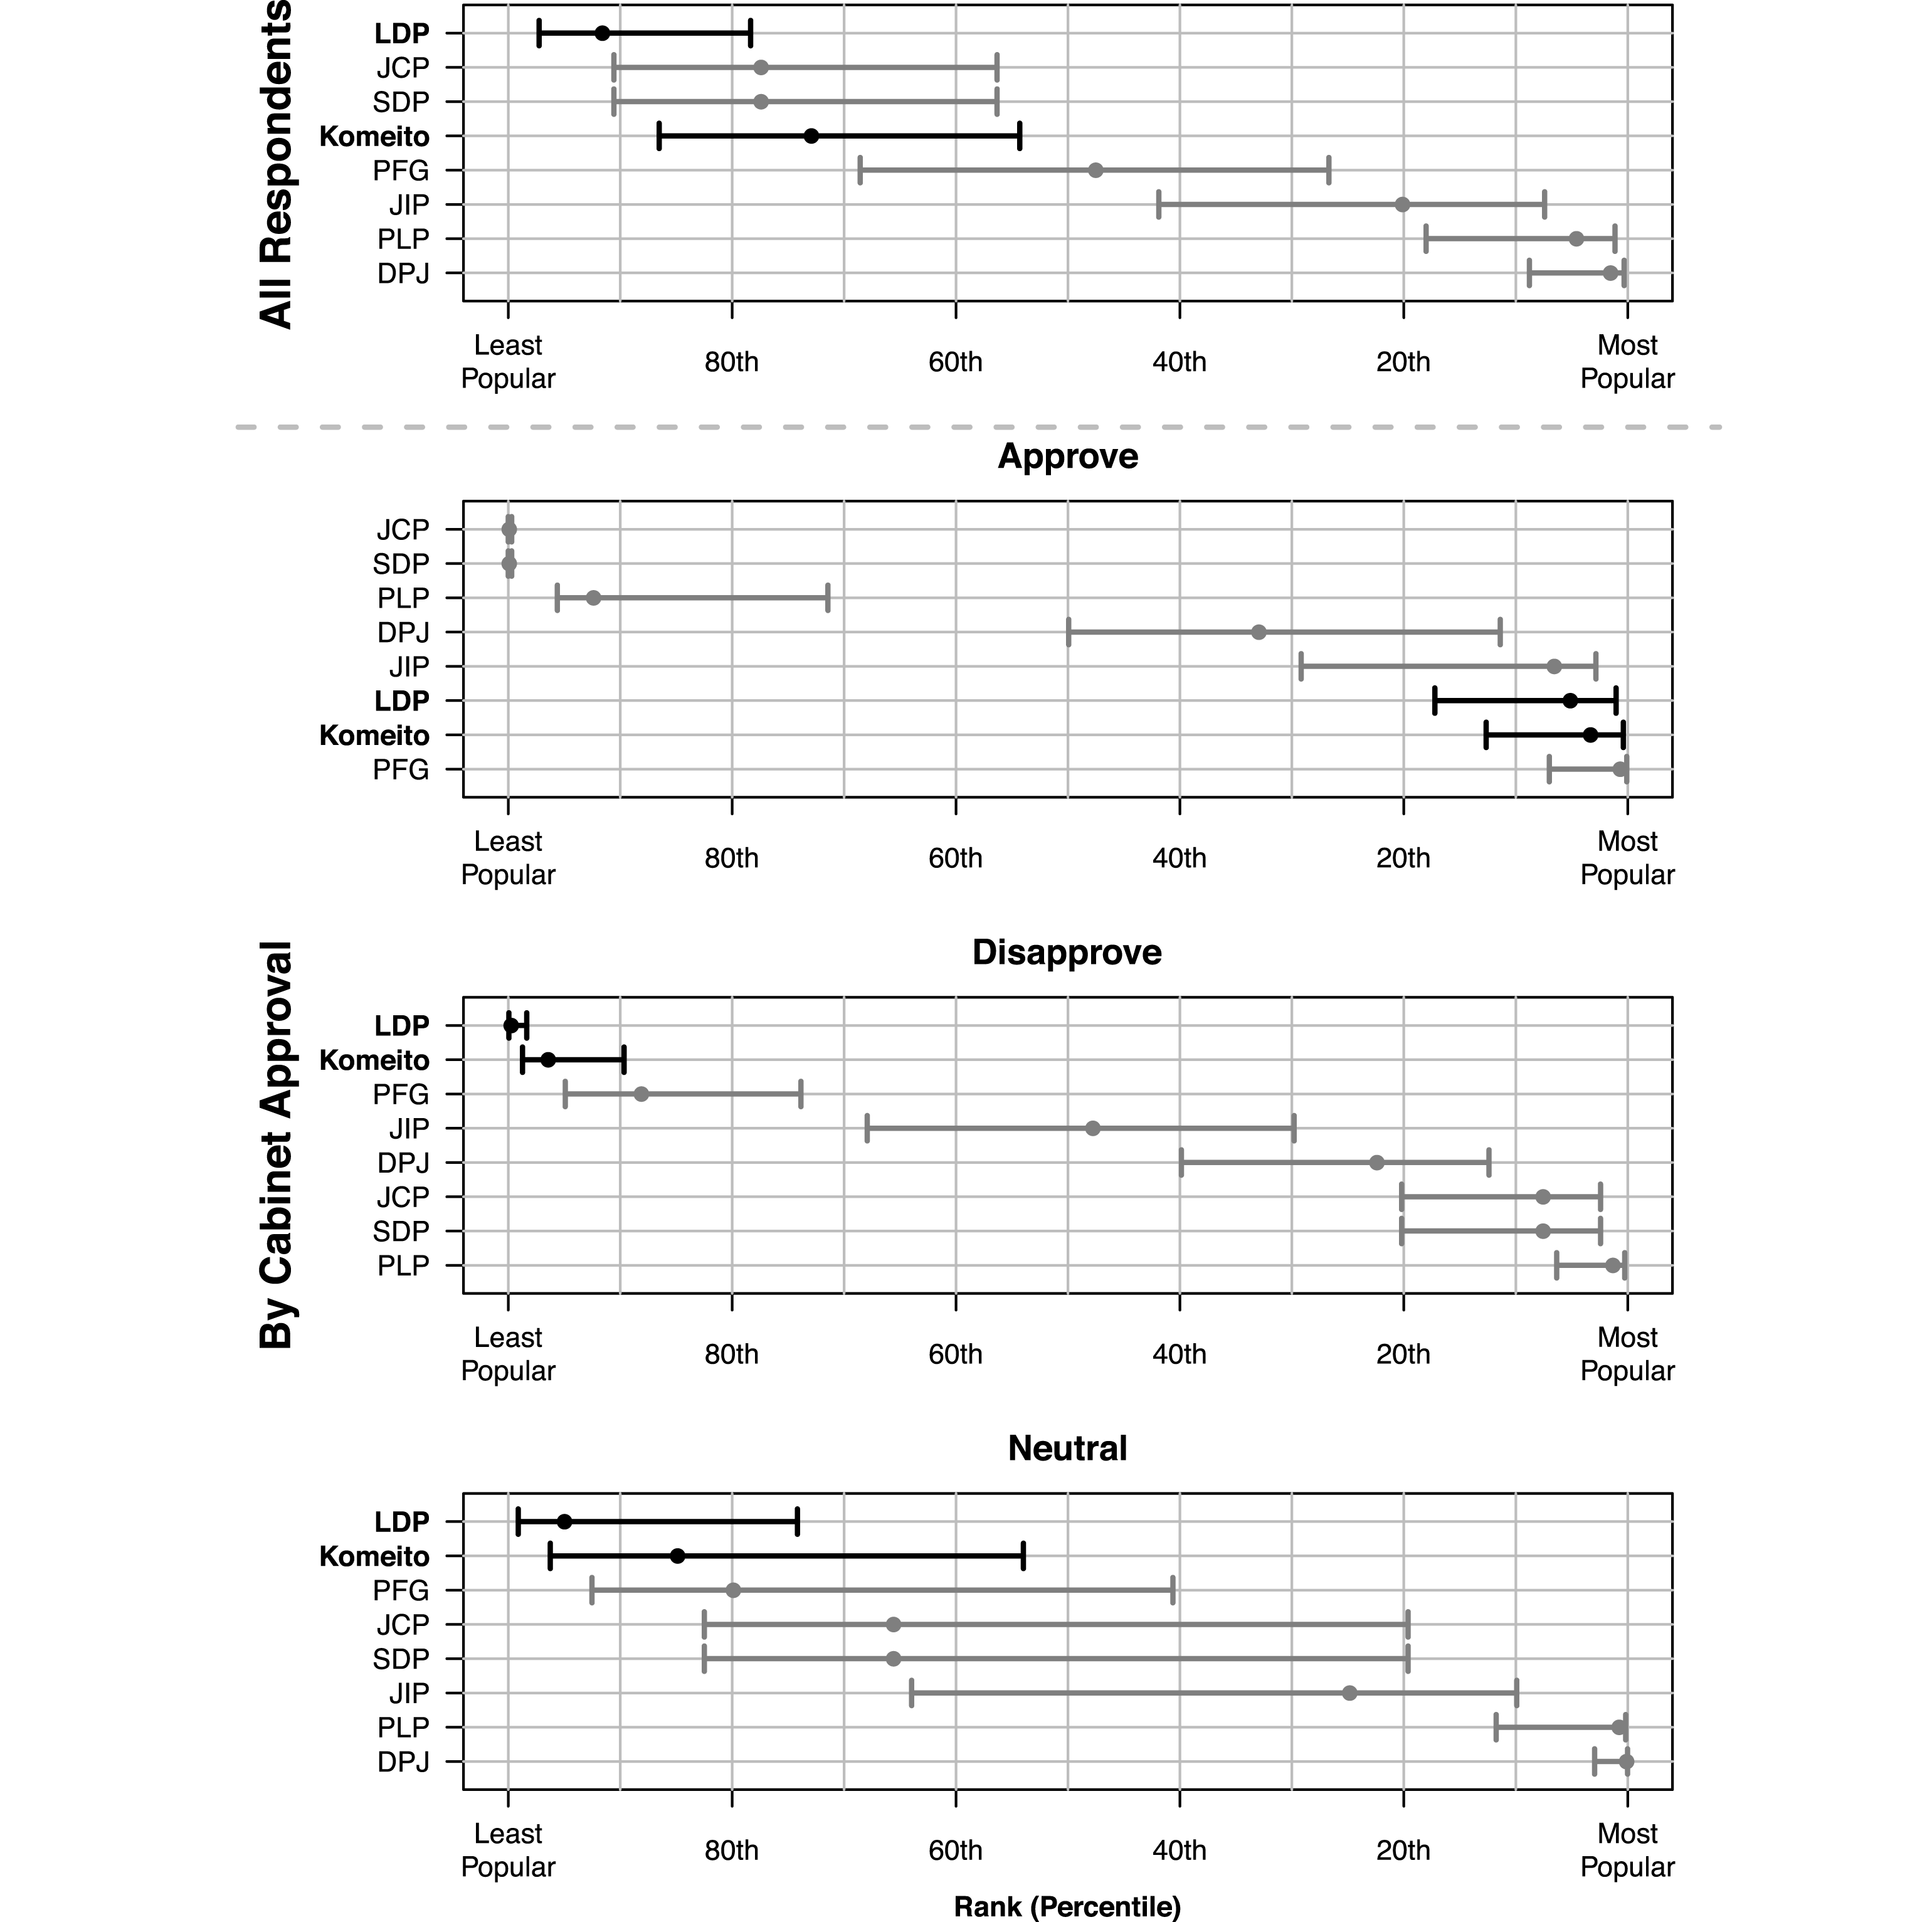
Ranking of actual manifestos by popularity. In each plot, the solid circles represent the estimated ranks of the policy bundles (in percentiles) that correspond to the actual party manifestos in the election, as indicated on the horizontal axis, among all of the 34,992 possible combinations of the policy positions. The horizontal bars represent the 95% confidence intervals based on the block bootstrap at the respondent level. The parties in the government coalition are indicated by bold labels on the vertical axis. The top plot shows the estimates for all respondents. The three remaining plots show results for the respondents who approved of, disapproved of, and were neutral about the performance the Abe Cabinet.

Figure 3 shows the results of this analysis for our survey respondents. In each plot, we estimate the ranks of the seven actual party manifestos among the
 $4^{2}\times 3^{7}=34,\!992$
possible policy bundles and show their percentiles along with the 95% block bootstrapped confidence intervals.Footnote
18
The top plot presents estimated ranks for the sample of all respondents. The estimates indicate that the LDP’s manifesto was highly unpopular; indeed, it is estimated to be the least popular bundle among the seven actual manifestos, with the estimated percentile rank of 91.6 and 95% confidence interval of
 $[78.3,97.2]$
. On the other hand, the DPJ’s manifesto is found to be the most popular among the bundles corresponding to the actual party manifestos, with the estimated percentile rank of 1.5 and 95% confidence interval of
 $[0.3,8.8]$
. This finding would seem to cast strong doubt on any interpretation of the election outcome as giving a popular mandate to the LDP–Komeito coalition government to carry out their proposed policy platform.
The remaining three plots in Figure 3 show the results for the respondents stratified by their approval of the Abe Cabinet’s performance. This categorization is based on a question we included in the survey after the conjoint exercises, in which respondents were asked “Do you approve or disapprove of the performance of the Abe Cabinet?” Respondents were asked to choose between “Approve,” “Disapprove,” and “Can’t say either way.” The respondents in our survey are roughly equally divided into these three strata. Among the 620 respondents who approve of the Abe Cabinet’s performance, the Komeito and LDP manifestos are estimated to be the second and third most popular, respectively, behind the more right-wing PFG.Footnote
19
The percentile ranks of the Komeito and LDP manifestos are estimated to be 3.3 and 5.1, with 95% confidence intervals of
 $[0.4,12.6]$
and
 $[1.0,17.2]$
, respectively. In contrast, the 634 respondents who disapprove of Abe’s performance are found to strongly dislike both of the government parties’ manifestos, with the estimated percentile ranks of 99.7 and 96.4 (with 95% confidence intervals of
 $[98.3,99.9]$
and
 $[89.7,98.7]$
) for the LDP and Komeito, respectively. Finally, but importantly, the results for the remaining 664 respondents who neither approve nor disapprove of the cabinet’s performance most closely replicated the preferences of the entire sample, in that the DPJ’s manifesto was preferred the most while the LDP’s was disliked the most.
These latter results suggest a possible clue to an interesting puzzle—how the LDP and its coalition partner won the election despite a lack of voter approval for the coalition’s policies. We find that those 664 respondents who are neutral about Abe’s performance are more likely to be either undecided about their vote choice or not intending to vote in the upcoming election than the rest of the sample (57.7% versus 35.8%, with the
 $p$
value of
 ${<}0.000$
for a two-sided
 $t$
-test). Our data also indicate a strong association between partisanship and vote intention (or lack thereof): those who usually support no particular party are much more likely to be either undecided or not intending to vote (67.3% versus 19.5%, with the two-sided
 $p$
value of
 ${<}0.000$
). These findings are noteworthy because there is ample evidence in the political science literature that those who are ambivalent about candidates or parties in an election are less likely to turn out than those with clear partisan preferences (for a review, see Smets and van Ham Reference Smets and van Ham2013). Given the historically low turnout (53%), it is likely that many of these undecided and unlikely voters stayed home. Had turnout been higher, our results suggest that the DPJ and other opposition parties might have won more votes and seats. In other words, low turnout likely helped the LDP win the election despite the unpopularity of its policies among the broader electorate.Footnote
20
Ultimately, explaining all of the institutional and contextual factors that contributed to the actual outcome of the election is beyond the scope of this study, since the goal of our conjoint analysis is not to explain the overall election outcome. Rather, our primary objective is to isolate the multidimensional policy preferences of voters from other determinants of their actual vote choices, such as candidates’ personal characteristics and the reputation of party leaders. An advantage of conjoint analysis is that it can help to reveal such discrepancies between voters’ policy preferences and the actual election results.
5 Validity Checks
Evidence from standard public opinion surveys can be distorted due to various sources of response bias. Although our study obviates some of these concerns by design, there are still several possible ways through which our results may not reflect the true preferences of Japanese voters. In this section, we conduct a series of validity checks to address such possible vulnerabilities.
5.1 Respondent fatigue and satisficing
An important concern about the validity of conjoint experiments is respondent fatigue. Any survey can yield invalid results if respondents answer questions without paying close attention. It may be argued that conjoint experiments are particularly prone to this type of bias due to the difficulty of the tasks involved. To complete the choice tasks, respondents must process information presented in the conjoint tables and synthesize it in their minds before making a decision. Of course, voters in the real world are also tasked with processing information provided by parties, and may rely on simple heuristic shortcuts (e.g., Popkin Reference Popkin1991; Lupia and McCubbins Reference Lupia and McCubbins1998). Nevertheless, since more cognitively demanding tasks in survey experiments are more likely to induce fatigue and cause effort-saving strategies among respondents than simple questions (Krosnick Reference Krosnick1999; Mutz Reference Mutz2011), it is important to check for any sign of satisficing behavior in the data.
We take two approaches to address this concern. First, following the suggestion of Hainmueller, Hopkins, and Yamamoto (Reference Hainmueller, Hopkins and Yamamoto2014), we test whether policy positions have different effects on preferences depending on where in the conjoint table they are shown to each respondent. If the respondents are cognitively overloaded with the information provided in the conjoint tasks, they might only pay attention to the part of each task that is easiest to process (e.g., the top of the table). If this occurs, then the policy positions should exhibit “order effects.” We test for this possibility by estimating conditional AMCEs for each policy position given its row position and checking whether they differ from one another via a series of
 $t$
-tests. Figure E.3 in Appendix E plots the resulting
 $p$
values against the quantiles of the uniform distribution on the unit interval, indicating the two distributions align very closely. This means that variation in the AMCEs across row positions is no greater than what might occur by chance. Indeed, only 5.6% of the
 $p$
values (9 out of 160) are smaller than the standard threshold of 0.05, almost exactly what is expected when the null hypothesis of “no order effect” is true.
Second, we investigate whether the effects of policy positions vary across the five sequential tasks performed by the respondents. The goal here is to detect whether respondents experience fatigue over the course of completing the tasks. If respondents feel that the conjoint tasks are overly demanding, the quality of their responses may degrade as they start paying less attention to the tasks and mechanically clicking on response options. Figure E.4 in Appendix E presents the results of an analysis that is similar to our order effect analysis, except that we look at the effect variation over task counts. Again, we find no evidence of effect heterogeneity across the conditions: the distribution of the
 $p$
values is almost indistinguishable from a uniform distribution, and only 6.3% (5 out of 80) of the
 $p$
values are smaller than the 0.05 threshold.Footnote
21
Thus, we find no evidence that our results suffer from response bias due to cognitive overload or fatigue among the respondents.
5.2 Contamination with party identification
An additional validity concern specific to the context of our study is that respondents might suspect a connection between the policy bundles presented to them and the actual parties in the election. In other words, a respondent may react to a particular policy position (such as restarting nuclear reactors) not because he or she supports the policy per se, but because he or she supports the party (in this case, LDP, Komeito, or PFG) with which the policy is associated in the respondent’s mind. Such a possibility poses a challenge to our identification strategy because our goal is to isolate voters’ policy preferences from other determinants of vote choice in the actual election, such as feelings of attachment to parties that derive from nonpolicy sources.
Although this remains a possibility, it is worth noting that some aspects of our study design make it unlikely that respondents will attach specific party labels to the policy bundles presented to them. First, we deliberately emphasized the hypothetical nature of the manifestos on the introductory screen presented to respondents before they saw the five conjoint tables, as well as in a sentence added above each table (see Section 3.2 for the exact question wording). Coupled with our evidence (in Section 5.1) that the respondents likely paid sufficient attention to the questions, we expect that most, if not all, of them clearly understood that the parties represented in the tables were hypothetical.
Second, due to the full randomization of policy positions, only a minuscule fraction of the bundles exactly corresponded to the actual party manifestos. Indeed, more than 96% of the bundles that were generated for the conjoint tasks were “unrealistic hybrids” in the sense that they contained at least one position from both the conservative governing party (LDP) and the most left-wing opposition parties (JCP, SDP, and PLP). Estimating the AMCEs of the policy positions on the subsample of tasks that we consider to be highly unlikely to be associated with real-world parties produces results that are nearly identical to the estimates using the entire sample reported in Figure 1.Footnote 22 That is, respondents appear to evaluate policy bundles in the same manner whether or not the bundles plausibly correspond to actual party manifestos. This suggests that our experiment captures voters’ policy preferences that are not contaminated by extraneous considerations such as nonpolicy party identification.
6 Conclusion
The aggregation of multiple policies into alternative and competing programs for voters to evaluate in elections is a key function of political parties in representative democracies. However, because of this process of preference aggregation into manifestos, election outcomes alone do not provide complete information on the underlying distribution of voter’s multidimensional preferences, or how preferences for specific policies influence voters’ choices between alternative parties. Moreover, standard survey methods employed in most pre- and post-election surveys are inadequate at approximating the type of decision-making process that voters actually undertake in evaluating alternative party choices.
We have argued that conjoint analysis is a useful tool for revealing voters’ multidimensional policy preferences, particularly when coupled with information from the actual party manifestos presented to voters in elections. We have illustrated this approach with an experiment conducted during the 2014 House of Representatives election in Japan. In sum, the results of our three sets of analysis suggest important implications for how the LDP’s victory in the election should be interpreted. First, our findings indicate that for many of the nine major policy issues in the election, the LDP’s policy positions were less popular than those of the opposition. Second, the economic policies of Prime Minister Abe (“Abenomics”) were less relevant than other noneconomic policies for respondents in choosing their preferred policy bundles. This is surprising given that Abe and the media framed the election as a referendum on Abenomics. Our analysis of the degree of heterogeneity in preferences confirmed this result; namely, respondents’ preferences with respect to economic policies were similar regardless of which party they usually support. In contrast, some of the noneconomic issues, such as constitutional revision and the approval of collective self-defense, showed substantial heterogeneity among respondents depending on their partisanship. Finally, the LDP’s policy bundle was one of the least popular bundles. The policy bundle proposed by the largest opposition party, the DPJ, was actually the most popular.
By identifying voters’ multidimensional policy preferences via a conjoint experiment, our study reveals an important shortcoming in the existing ways of analyzing elections in representative democracies. Indeed, there is substantial evidence that many scholars and the media misinterpreted Japanese voters’ policy preferences in the election. Our analysis reveals that voters neither thought that Abenomics was an important issue at stake, nor preferred the LDP’s other policy proposals. Instead, our results suggest that the LDP’s victory was arguably due to various factors other than the party’s policy proposals. Based on these results, it may be problematic that after the election, the LDP continued to pursue the same (unpopular) policies on which it campaigned. An advantage of using conjoint analysis in the context of an actual election campaign is that it can help to better illuminate this type of discrepancy between voters’ multidimensional policy preferences and the parties that ultimately get their votes. This discrepancy between the distribution of voters’ multidimensional preferences for policies and the distribution of votes (and then seats) among parties is an important, yet underinvestigated, problem—not only in Japan, but in all representative democracies.
We believe that conjoint analysis based on actual party manifestos is a better approach to understanding the multidimensional policy preferences of voters in representative democracies, and argue that our approach should be built into future election surveys. To estimate the gap between each voter’s multidimensional policy preferences and his or her actual vote choice, it would be ideal to design a two-wave panel study, in which each voter is asked to do conjoint exercises during the campaign period and then to report his or her vote choice. How this gap varies under diverse electoral settings (such as pure SMD and PR systems) in other democracies is an important question for future researchers to investigate. It would be interesting to explore, for example, whether the gap might be smaller in elections held under closed-list PR, given that factors other than policy positions such as candidates’ attributes are likely to play a diminished role in vote choice under such party-centric systems.
Another fruitful avenue for future research is to investigate how the ways policy proposals are bundled together might affect voter turnout and vote choice. The approach we propose in this paper opens up possibilities for answering many questions that have not been empirically analyzed in the literature. For example, are voters more likely to turn out when policy bundles are more ideologically coherent? Do more voters turn out when the number of attributes (i.e., issues at stake in the election) is smaller? We hope our study will pave the way for further studies investigating how voters’ policy preferences affect their electoral behavior, and whether or how these preferences are reflected in the policy outcomes of representative democracies.
Supplementary material
For supplementary material accompanying this paper, please visit https://doi.org/10.1017/pan.2018.2.