


Introduction
Geosynthetic clay liners (GCLs) are used widely in waste-containment systems because of their low hydraulic conductivity (k) and large swelling capacity. The barrier performance of GCLs is governed primarily by the osmotic swelling of Na bentonite (NaB), which constrains pore connectivity and enables k values as low as 1×10–12 m s–1 under hydrated conditions (Jo et al., Reference Jo, Benson and Edil2004). However, exposure to chemically aggressive leachates containing high ionic concentrations and multivalent cations substantially deteriorates their hydraulic performance. Cation exchange reactions contract the diffuse double layer (DDL), suppress swelling, and increase k beyond the regulatory limit of 1×10⁻⁹ m s–1, thereby compromising long-term containment efficiency (Chen et al., Reference Chen, Salihoglu, Benson, Likos and Edil2019). To overcome these limitations, extensive research has focused on polymer-modified bentonites, commonly referred to as bentonite polymer composites (BPCs), prepared using various monomers and synthesis techniques (Kajita, Reference Kajita1997; Ling et al., Reference Ling, Lu, Wang, Li, Chen, Zhou and Wang2011).
Previous studies demonstrated that polymer incorporation improves the chemical compatibility and hydraulic resistance of NaB under aggressive permeation conditions compared with untreated NaB (Ashmawy et al., Reference Ashmawy, El-Hajji, Sotelo and Muhammad2002; Bohnhoff and Shackelford, Reference Bohnhoff and Shackelford2015). The enhanced hydraulic performance of BPCs was attributed to polymer intercalation into clay interlayers (Trauger and Darlington, Reference Trauger and Darlington2000), hydrogel-induced pore clogging (Scalia et al., Reference Scalia, Benson, Bohnhoff, Edil and Shackelford2014; Tian et al., Reference Tian, Likos and Benson2019), polymer coatings shielding clay particles from cation exchange (Prongmanee et al., Reference Prongmanee, Chai and Shen2018a), and ion scavenging (Wireko and Abichou, Reference Wireko and Abichou2021). Despite these advances, the governing mechanisms remain inconsistent and inconclusive. Some studies have reported substantial increases in basal spacing (d 001 spacing) of clay (Fig. S1, Supplementary material), indicating polymer intercalation (Trauger and Darlington, Reference Trauger and Darlington2000; Mazzieri et al., Reference Mazzieri, Di Emidio and Van Impe2010), whereas others observed negligible change in clay interlattice spacing (Scalia et al., Reference Scalia, Benson, Bohnhoff, Edil and Shackelford2014; Prongmanee et al., Reference Prongmanee, Chai and Shen2018a). These inconsistencies arose from variations in polymer type, synthesis method, and clay mineralogy, which collectively govern clay-polymer interactions and the resulting hydraulic behavior (Theng, Reference Theng1970; Kim and Palomino, Reference Kim and Palomino2011; Halder et al., Reference Halder, Palomino and Hicks2018).
More importantly, mechanistic interpretations reported in the literature were developed for BPCs synthesized via dry blending approaches, in which water-soluble linear polymers are mixed with NaB. Such systems were prone to polymer elution, a process in which polymers migrated from BPCs during permeation (Zhao and Tian, Reference Zhao and Tian2023). Polymer elution progressively reopened hydrogel-blocked pores, restored hydraulic flow paths, and ultimately increased k. Polymer loss not only diminished barrier performance but also increased the risk of contaminant migration and secondary environmental impacts. Consequently, maintaining hydraulic stability while preventing polymer elution under chemically aggressive conditions remains a major challenge for developing durable and sustainable barrier materials. To address this, Keerthana (Reference Keerthana2025) developed a novel in situ polymerized bentonite (IPB) synthesized using an optimized crosslinker-based polymer formulation. Unlike BPCs, the proposed IPBs maintained low k and averted polymer elution. However, the mechanisms responsible for their enhanced chemical resilience and non-eluting behavior are not well understood. In particular, the role of crosslinker-induced alterations in pore structure and clay–polymer interactions in governing the long-term hydraulic behavior has not yet been established. Consequently, a multiscale analysis corroborating microstructural evidence with macroscopic hydraulic behavior is absent in the literature, leaving fundamental gaps in understanding the mechanistic basis of low k, especially for crosslinker-based IPBs.
Given this, the objective of the present study was to investigate the mechanisms governing the low k of IPBs through an integrated macro- and micro-scale characterization framework. Comprehensive physicochemical, mineralogical, molecular, thermal, morphological, and pore-structure analyses were performed and correlated with long-term hydraulic behavior across varied chemical environments. Based on experimental evidence, a multiscale mechanistic framework was established to explain the sustained low k and non-eluting behavior of IPBs. These findings provide new scientific insights into the hydraulic performance of IPBs and advance the mechanistic understanding required for designing chemically resilient, sustainable barrier materials for long-term environmental protection.
Materials and methods
The materials used in the present study were identical to those used by Keerthana (Reference Keerthana2025). Commercially available Na bentonite procured from the Versatile Speciality Mine Chem, Bhuj, India, was used. The polymer used to augment NaB was a superabsorbent polymer (SAP), Na polyacrylate. Keerthana (Reference Keerthana2025) developed an optimized polymer composition to address the persistent concern of polymer elution in polymer-modified bentonites. The optimization of polymer composition was carried out using response surface methodology (RSM) to maximize the polymer’s water absorption capacity (WAC). The polymer formulation incorporated a bifunctional covalent crosslinker, which was crucial for achieving hydraulic endurance and chemical resilience. The functional role of a crosslinker was to transform the linear polymer chains into a three‑dimensional network, thereby enhancing water absorption capacity, promoting swelling without solubilization, while suppressing polymer elution during long‑term permeation. The optimized conditions for the polymer formulation were established as 1.0 wt.% initiator, 0.11 wt.% crosslinker, and 16.33 wt.% neutralizer, relative to the mass of acrylic acid monomer. At this optimized composition, the polymer achieved a maximum WAC of 305 g/g, as verified using Design Expert software (Keerthana, Reference Keerthana2025).
The IPBs evaluated in this study were prepared using this optimized crosslinker-based polymer formulation. Chemical constituents for hydrogel synthesis include ammonium persulfate as the initiator, N,N′‑methylenebisacrylamide (MBA) as the crosslinker, and Na hydroxide as the neutralizer (Laftah and Hashim, Reference Laftah and Hashim2012). For IPB synthesis, the monomer solution was first prepared by neutralizing acrylic acid with sodium hydroxide. The NaB was then added to the monomer solution containing the crosslinker and initiator, which was prepared under the optimized conditions, resulting in a pH of 5.5. The mixture was agitated vigorously under a nitrogen gas environment to enhance polymer adsorption onto the clay surfaces. Polymerization was conducted at 70°C for 3 h (Prongmanee et al., Reference Prongmanee, Chai and Shen2018a) using a hot plate equipped with a temperature controller and a magnetic stirrer. After polymerization, the resulting IPB was washed thoroughly with distilled water (DW) to remove unreacted monomer, dried in a hot-air oven at 105±5°C for 24 h, and ground to pass through a 425 μm sieve, similar to powdered NaB-based GCLs.
Trial experiments were conducted to obtain different polymer doses in IPB by varying the NaB content as a fraction of monomer weight. Based on this approach, IPBs with three different polymer doses were prepared: IPB5, IPB15, and IPB28, where the numeric subscript indicates the polymer dosage as a percentage of dry mass. The lowest polymer dose of 5% was selected, as it represents one of the minimum values reported in the literature for NaB modification (Chen et al., Reference Chen, Salihoglu, Benson, Likos and Edil2019; Zainab et al., Reference Zainab, Wireko, Li, Tian and Abichou2021). The highest polymer dose of 28% was chosen to coincide with the study by Scalia et al. (Reference Scalia, Benson, Bohnhoff, Edil and Shackelford2014), with an intermediate value of 15% enabling comparative analysis (Chen et al., Reference Chen, Tan, Copeland, Chen, Peng and Huang2023; Li et al., Reference Li, Zhao and Tian2024). This dosage range was selected to encompass the broad spectrum of values required to assess the influence of polymer dose on mechanistic thresholds across varying physicochemical environments. Given the practical relevance, it provided a basis for informed decision-making on design margin for site-specific requirements. The polymer dose in the IPBs prepared was quantified in terms of loss on ignition, as outlined in ASTM D7348 (2021). For this purpose, the oven-dried specimens were ignited at 550±5°C for 4 h in a muffle furnace. The polymer dose was then determined from the relative mass loss, accounting for the LOI of both NaB and the polymer.
Long-term chemical compatibility tests were performed to evaluate the equilibrium k value using the constant-flow rate method, as described in ASTM D6766 (2020) and ASTM D7100 (2020). Keerthana (Reference Keerthana2025) evaluated the k value of NaB and IPBs using DW and solutions of NaCl and CaCl2 at concentrations ranging from 5 mM to 1000 mM. To further augment the findings of that study, the present research selected an AlCl3 solution with concentrations of 5, 20, 50, 200, 500, and 1000 mM. Chemical compatibility testing was conducted using a constant flow permeameter (Fig. S2, Supplementary material) (Keerthana, Reference Keerthana2025). The GCL specimens containing either NaB or IPBs were prepared following the procedure suggested by Chen et al. (Reference Chen, Tan, Copeland, Chen, Peng and Huang2023). To replicate commercial GCLs, 19.88 g of either NaB or IPBs was spread uniformly between two non-woven geotextiles having a mass per unit area of 0.25 kg m–2, resulting in a GCL specimen with a 75 mm diameter and a mass per unit area of 4.5 kg m–2. The GCL specimen was placed inside the sample cell, sandwiched between porous stones and filter papers. The specimen was saturated for 48 h using the desired permeant under a constant overburden pressure of 20 kPa (Zainab et al., Reference Zainab, Wireko, Li, Tian and Abichou2021). Subsequently, permeation was initiated by maintaining a constant flow rate of 9 mL day–1 (Fernandez and Quigley, Reference Fernandez and Quigley1985). Effluent was collected throughout the test until both hydraulic and chemical equilibrium conditions were satisfied before terminating the k tests: (1) k remained stable without systematic variation over time; (2) at least four successive k measurements fell within 25% of their mean; (3) a minimum of four consecutive outflow-to-inflow ratios remained within the range of 0.75–1.25; (4) the pH and electrical conductivity of the effluent did not differ by >10% from those of the influent. Accordingly, the duration of the long-term k tests ranged from 1 year to nearly 3 years.
The selected materials were characterized for their geotechnical, physico-chemical, mineralogical, molecular, thermal, and morphological properties. The specific gravity (G), water content, consistency limits, free swell index (FSI), and soil classification were determined in accordance with ASTM standards (ASTM D5550, 2023; ASTM D2216, 2019; ASTM D4318, 2018; ASTM D5890, 2025; ASTM D2487, 2025). Cation exchange capacity (CEC), mole fraction of bound cations, and specific surface area (SSA) were evaluated as per the methodologies outlined in ASTM D7503 (2018) and Arnepalli et al. (Reference Arnepalli, Shanthakumar, Rao and Singh2008), respectively. X-ray fluorescence (XRF) was employed to assess the chemical composition of NaB and IPBs using a micro-XRF analyzer (Rigaku, Japan). The zeta potential was measured using a Horiba SZ-100 particle size analyzer (Horiba Limited, Japan), as described by Kaya et al. (Reference Kaya, Ören and Yükselen2006). The X-ray diffraction (XRD) analysis was performed using an X-ray diffractometer (Rigaku, Japan), scanned from 2 to 70°2θ with a scan resolution of 0.0025°2θ. The molecular peculiarities of specimens were analyzed using a Nicolet IS-50 Fourier transform infrared (FTIR) spectrophotometer (Thermo Fisher, USA) in attenuated total reflectance (ATR) mode. Thermal analysis was conducted using a thermogravimetric analyzer (TGA), Discovery SDT650 (TA Instruments, USA).
The surface morphology and elemental distribution of the specimens were obtained using a scanning electron microscope (SEM) (Philips FEI, Quanta 200, USA) coupled with energy dispersive X-ray spectroscopy (EDS) (EDAX, AMETEK Inc., USA). Mercury intrusion porosimetry (MIP) (PoreMaster 60, Anton Paar, USA) was used to assess the pore-size distribution (PSD) of the specimens, following the guidelines of ASTM D4404 (2018). The SEM and PSD analyses were performed on undisturbed freeze-dried specimens collected after permeation with DW, NaCl, CaCl2, and AlCl3 solutions across a wide concentration range. Additional information regarding the test protocols is provided in Section S1 of the Supplementary material.
Results and Discussion
Characterization of materials
The characterization results for the selected materials are summarized in Table 1. The specific gravity (G) of the materials followed the order NaB>IPB5>IPB15>IPB28, indicating a decreasing trend in G with increasing polymer dosage. This trend suggested that the addition of a polymer with a lower specific gravity (~1.3) than NaB reduced the G of the composite materials. A slight increase in water content was observed with increasing polymer dosage, attributable to SAP’s inherent water-absorbing capacity. Unlike NaB, which exhibited plastic behavior, IPBs did not form a 3 mm diameter thread due to their soft, spongy texture. This behavior became more pronounced at higher polymer dosages, preventing IPBs from crumbling and imparting characteristics similar to those of the polymer.
The liquid limit of IPBs decreased significantly with increasing polymer dosage up to 15%, which was attributed to several factors: (1) polymer modification of NaB altered clay–water interaction, reducing water-absorption capacity (Halder et al., Reference Halder, Palomino and Hicks2018); (2) polymer addition affected clay fabric structure and reduced micropore water retention (Prongmanee et al., Reference Prongmanee, Chai and Shrestha2018b); and (3) polymer adsorption on NaB induced structural changes, impacting its water-absorption capacity. The decrease in liquid limit with increasing polymer dosage up to 15% indicated a clay-dominated regime, where polymer adsorption modified the clay fabric and limited water uptake. Interestingly, further polymer addition from 15 to 28% increased the liquid limit by 8%. At higher polymer dosages, the IPBs transitioned toward a polymer-dominated regime in which enhanced clay-polymer bonding and the inherent swelling capacity of SAP enabled IPBs to retain more water before transitioning to a liquid state.
A similar trend was observed in the FSI, which initially decreased as polymer-induced flocculation reduced hydration sites and restricted swelling (Razakamanantsoa et al., Reference Razakamanantsoa, Barast and Djeran-Maigre2012). However, the FSI increased at 28% polymer dosage as polymer interactions became predominant and facilitated additional water retention. This behavioral change suggested the presence of a threshold polymer dosage of 15%, beyond which the mechanism governing IPB microstructure shifted from clay fabric control to polymer interaction. Polymer addition beyond this threshold progressively altered clay–polymer interactions, transforming the IPBs from clay-dominated to polymer-dominated behavior. The findings from FTIR, SEM, and MIP analyses, discussed in subsequent sections, substantiated these observations.
The reduced SSA (Table 1) with increasing polymer dosage was attributed to polymer adsorption, in which the polymer adhered to NaB and formed a thin film on the surface of the clay platelets. This reduction further supported the previously discussed liquid limit and FSI trends, indicating that as polymer adsorbed onto NaB, the surface area available for hydration decreased, thereby limiting clay–water interactions and reducing the swell and water-absorption capacity of IPBs. The FTIR results also corroborated this interpretation, showing a decrease in the 3420 cm–1 peak intensity corresponding to adsorbed water with increasing polymer dosage.
Polymer incorporation increased the CEC of NaB, indicating an improved ability to exchange cations with the surrounding medium. The polymer used in this study was an anionic polyelectrolyte. Its inclusion introduced additional negative charge into IPBs, arising from the polymer functional groups that adsorbed and exchanged positively charged cations. Higher polymer dosages introduced more negatively charged sites, thereby enhancing the clay’s negative surface-charge density, which is useful for barrier applications. The mole fraction of sodium cations increased with increasing polymer dosage, where the excess Na+ ions stemmed primarily from SAP. The surface-charge alterations induced by polymerization were also reflected in the zeta potential of IPBs. Polymer addition increased the zeta potential negativity, indicating an increase in the clay’s surface charge. This enhancement resulted from the addition of an anionic polymer, which introduced additional negatively charged sites onto the clay surface. The greater the polymer dosage, the higher the zeta potential, indicating a stronger negative surface charge and potentially a higher CEC.
Hydraulic conductivity
The variation in k of NaB and IPBs permeated with inorganic solutions of varying concentrations is shown in Fig. 1. For NaB, k increased drastically with increasing concentration for all permeants, and at 1000 mM, k rose by four to six orders of magnitude (Fig. 1a). This pronounced increase was attributed to a reduction in diffuse double layer thickness (Jo et al., Reference Jo, Benson and Edil2004). In contrast, IPBs consistently exhibited k values several orders of magnitude lower than those of NaB and remained below the regulatory limit of 1×10⁻⁹ m s–1 (Fig. 1b–d). Compared with NaB, IPBs demonstrated enhanced chemical compatibility and sustained barrier performance, underscoring their potential for long-term environmental protection. Intriguingly, the k of IPBs increased with increasing pore-fluid concentration, and at any given concentration, k followed the order AlCl3>CaCl2>NaCl (Fig. 1b–d). This systematic variation reflected the pronounced sensitivity of IPBs to pore-fluid chemistry and was interpreted using the measured CEC and zeta potential values. Polymer incorporation increased the CEC from 143.5 cmol+ kg–1 in NaB to 168.5 cmol+ kg–1 in IPB5, while zeta potential shifted from –58.15 mV to –64.9 mV (Table 1). These changes indicated enhanced exchange capacity and greater surface charge density arising from grafted polymer functional groups. Multivalent cations interacted more strongly with these sites: trivalent Al3+ ions exhibited the greatest affinity, followed by divalent Ca2+ ions, whereas monovalent Na+ ions interacted weakly. This quantitative linkage explained the observed k behavior of IPBs towards cation valence (AlCl3>CaCl2>NaCl), confirming specific clay-polymer-permeant interactions that modulated pore connectivity. Importantly, this behavior was similar to the k trend observed for NaB and therefore indicated that at lower polymer dosages, the hydraulic response of IPBs remained fundamentally clay‑dominated.
Variation of hydraulic conductivity with the concentration of permeant: (a) NaB; (b) IPB5; (c) IPB15; (d) IPB28. The dashed line indicates k of DW; data for the AlCl3 solution were obtained experimentally in this study, while the remaining datasets were adapted from Keerthana (Reference Keerthana2025) and other literature.

Figure 1. Long description
A multi-panel figure with four logarithmic line graphs labeled a through d. All panels share an x-axis for Concentration in m M ranging from 5 to 1000 and a y-axis for Hydraulic conductivity in meters per second (m / s).
* Panel a (N a B): Hydraulic conductivity increases with concentration. The Al Cl sub 3 data (orange triangles) shows the highest values, rising from 10 super minus 9 to 10 super minus 5 m / s. Ca Cl sub 2 (pink circles) and N a Cl (blue squares) remain near the D W baseline until 50 m M, then increase to 10 super minus 6 m / s.
* Panel b (I P B 5): Al Cl sub 3 (orange triangles) shows a steady increase from 10 super minus 10 to 10 super minus 9 m / s. Comparative data from other studies (green pentagons and diamonds) show much higher conductivity, reaching 10 super minus 7 m / s at high concentrations.
* Panel c (I P B 15): All datasets show a gradual upward trend. Al Cl sub 3 (orange triangles) remains the highest, starting at 3 times 10 super minus 11 and reaching 2 times 10 super minus 10 m / s. N a Cl (blue squares) shows a sharp rise after 20 m M.
* Panel d (I P B 28): The curves for Al Cl sub 3 (orange triangles) and Ca Cl sub 2 (pink circles) are nearly identical, plateauing around 10 super minus 10 m / s. N a Cl (blue squares) remains lower, between 10 super minus 12 and 3 times 10 super minus 11 m / s.
In all panels, a horizontal dashed line labeled D W indicates the hydraulic conductivity of distilled water, serving as a baseline at approximately 10 super minus 11 to 10 super minus 12 m / s depending on the panel scale.
Properties of Na bentonite and in situ polymerized bentonites

Table 1. Long description
The table consists of five columns: Property, Na B, I P B sub 5, I P B sub 15, and I P B sub 28.
Key physical properties include:
* Polymer dose: 0 percent for Na B, 5 percent for I P B sub 5, 15 percent for I P B sub 15, and 28 percent for I P B sub 28.
* Specific gravity: Decreases from 2.73 for Na B to 2.27 for I P B sub 28.
* Liquid limit: Decreases from 732 percent for Na B to 254 percent for I P B sub 28.
* Specific surface area: Decreases from 614.4 to 240.4 square meters per gram.
* Zeta potential: Becomes more negative, moving from minus 58.15 to minus 90.65 m V.
* Cation exchange capacity: Increases from 143.5 to 178 c mol super plus k g sub minus 1.
Bound cations (mole fraction):
* Na super plus: Increases from 0.69 to 0.93.
* Ca super plus: Decreases from 0.17 to 0.05.
* Mg super plus: Decreases from 0.13 to 0.02.
Oxide constituents (percent):
* Al sub 2 O sub 3: Decreases from 21.55 to 19.5.
* Si O sub 2: Decreases from 57.8 to 55.5.
* Na sub 2 O: Increases from 2.95 to 7.48.
* Fe sub 2 O sub 3: Increases from 12.08 to 13.4.
Notes indicate that N P stands for non-plastic and L D L indicates values less than the detectable limit.
‘—’ denotes property was not determined or not applicable, NP refers to non-plastic, and LDL indicates that the value is less than the detectable limit of the instrument.
However, with increasing polymer dosage, the CEC continued to increase, reaching 178 cmol+ kg–1 at 28% dosage, while the zeta potential became progressively more negative, i.e. –90.65 mV. At these higher dosages, the three‑dimensional crosslinked polymer network increasingly governed pore connectivity. As a result, although the k order AlCl3>CaCl2>NaCl persisted, the differences in the magnitudes of the k values among cation valences diminished (Fig. 1b–d), indicating a mechanistic transition from clay-dominated hydraulic response at lower polymer dosages to polymer‑driven stability at higher dosages. As this mechanistic transition became more pronounced, all IPBs exhibited a decrease in k with increasing polymer dosage (Fig. 1), confirming that the crosslinked polymer network progressively masked valence-dependent variability. Furthermore, the equilibrium duration during permeation was governed primarily by the crosslinked polymer network rather than by permeant type, with higher polymer dosages further prolonging equilibration, reinforcing the dominance of polymer‑driven stabilization. Consistent with the threshold polymer dosage (15%) identified for liquid limit and FSI, the k results also exhibited a mechanistic shift beyond this dosage, where k remained relatively stable, particularly for divalent- and trivalent-cation-based solutions (Fig. 1c,d). This result was consistent with Li et al. (Reference Li, Zhao and Tian2024), who reported that bentonite-polymer (BP) GCLs with polymer dosages >15% maintained low k values of 1×10–11 m s–1 when permeated with coal combustion product leachate. The threshold polymer dosage in IPBs required to achieve chemically resilient hydraulic performance can therefore be tailored based on site-specific chemical environment requirements.
Compared with k results reported in the literature for BPC GCLs, IPBs demonstrated superior hydraulic performance. For instance, Tian et al. (Reference Tian, Likos and Benson2019) observed a dramatic increase in k during CaCl2 permeation for BP GCLs prepared by the dry blending process with a 5.1% polymer dosage (Fig. 1b). This sharp increase in k was attributed to polymer elution, wherein as much as 31% of the initial polymer was lost. Similarly, Wireko and Abichou (Reference Wireko and Abichou2021) reported polymer elution of 35% in linear polymer-bentonite (LPB) GCLs permeated with 500 mM CaCl2, which resulted in k increasing to 5.8×10⁻⁸ m s–1 (Fig. 1b). Scalia et al. (Reference Scalia, Benson, Bohnhoff, Edil and Shackelford2014) observed even greater polymer loss, with 64% of the initial polymer eluted from BPC GCLs containing 28.5% polymer dosage prepared by in situ polymerization without a crosslinker after permeation with 50 mM CaCl2. Other studies have likewise reported that polymer elution caused significant increases in long-term k (>1×10⁻⁹ m s–1) when permeated with aggressive leachates such as bauxite liquor, coal combustion product leachate, and incineration ash leachate (Chen et al., Reference Chen, Salihoglu, Benson, Likos and Edil2019; Zainab et al., Reference Zainab, Wireko, Li, Tian and Abichou2021; Chen et al., Reference Chen, Tan, Copeland, Chen, Peng and Huang2023; Li et al., Reference Li, Zhao and Tian2024).
In contrast, none of the IPBs tested in this study experienced polymer elution. During long-term permeation, the effluent consistently appeared clear and non‑viscous, with no precipitates or discoloration, and exhibited properties comparable to the inflow permeant. Effluent density measurements also matched those of the inflow, with no evidence of increasing viscosity or syrup‑like behavior. Loss on ignition analyses further confirmed that the residual polymer dosages in the IPB5, IPB15, and IPB28 specimens after permeation were 4.5±0.3%, 14.4±0.5%, and 27.5±0.2%, respectively. This minor variation was attributed primarily to heterogeneity in polymer distribution within the specimens or slight sampling inconsistencies. The non-eluting behavior, coupled with the enduring low k and enhanced chemical resilience of IPBs, was attributed to the crosslinker-based polymer formulation used in the in situ polymerization of NaB (Keerthana, Reference Keerthana2025).
In conventional BPCs without a crosslinker, the linear polymers hydrolyzed to form viscous water‑soluble gels that were susceptible to elution during permeation (Chen et al., Reference Chen, Salihoglu, Benson, Likos and Edil2019). In contrast, the crosslinker‑based formulation proposed for IPB synthesis in this study facilitated the formation of a stable three-dimensional crosslinked polymer network within the clay matrix. This interconnected network reduced polymer mobility, strengthened clay–polymer interactions, and effectively suppressed elution. Additionally, the crosslinked polymers were not soluble in water; instead, their hydrophilic functional groups imbibed large amounts of water. These absorbed water molecules, together with the crosslinked network, transformed the pore structure into narrow and tortuous flow paths, thereby effectively restricting hydraulic flow, as corroborated by microstructural analysis discussed in subsequent sections (Zainab et al., Reference Zainab, Wireko, Li, Tian and Abichou2021). Consequently, IPBs maintained low k values even under aggressive chemical conditions, highlighting the decisive role of the crosslinker in achieving non-eluting behavior and long‑term barrier performance. To elucidate the mechanisms underlying the enhanced hydraulic performance, integrated microstructural investigations were conducted, and the results are described below.
Notably, the formation of a three‑dimensional crosslinked polymer network was evidenced by non‑eluting behavior and microstructural investigations. While direct measurement of crosslinking density was not performed in the present study, the effect of the crosslinker on the polymer chain structure was evaluated systematically and described in terms of swelling behavior, which is widely recognized as a reliable indicator of crosslinking density (Roslan et al., Reference Roslan, Aziz, Deraman and Dzulkarnain2024). For this purpose, the WAC of the polymer was measured for crosslinker contents ranging from 0.05 wt.% to 0.3 wt.% (Laftah and Hashim, Reference Laftah and Hashim2012). WAC increased with increasing crosslinker content up to an optimum value of 0.14 wt.%, reaching a maximum of 229 g/g. However, further increase in crosslinker content to 0.3 wt.% lowered WAC to 170 g/g. This variation was attributed to changes in polymer-chain structure arising from different degrees of crosslinking and is consistent with classical polymer network theory (Jin et al., Reference Jin, Chen, Mao, Yue, Han and Yu2017). At low crosslinker content, the limited number of crosslinking points yielded a weak polymer network that dissolved readily in water, resulting in low WAC. As the crosslinker content increased to the optimal value, the polymer formed a stable three‑dimensional network, thereby maximizing the osmotic driving force for water uptake and enhancing WAC. When the crosslinker content exceeded the optimum, a dense polymer network formed, restricting water ingress and polymer chain mobility and leading to reduced WAC (Laftah and Hashim, Reference Laftah and Hashim2012). The observed variations in swelling behavior reflected corresponding changes in crosslinking density within the polymer network. The WAC trends provided evidence that crosslinking modified the polymer network structure, thereby substantiating its role beyond inference from non-eluting behavior. Given this, direct quantification of crosslinking density was not performed, which constitutes a limitation of the present study.
Mineralogical peculiarities
The XRD pattern of NaB indicated the dominant presence of montmorillonite with minor amounts of quartz (Fig. 2a). Comparing the XRD patterns of selected materials showed that polymer addition did not alter the clay mineralogy, and no new mineral phases were detected. Despite the increasing polymer dose, the mineral composition of IPBs remained unchanged, with diffraction peaks consistent with those of virgin NaB (Fig. 2a). This suggested that clay–polymer interactions occurred through adsorption rather than through the formation of new minerals. To substantiate this observation, FTIR analysis was conducted, and the results are discussed below.
XRD patterns of virgin NaB and IPBs with varied polymer doses: (a) comparison of XRD traces presented in a stacked plot; (b) expanded scale showing the variation in d 001 spacing with increased polymer dose.

Figure 2. Long description
The multi-panel figure consists of two stacked line graphs, labeled a and b.
Panel a: The X-axis represents 2 theta in degrees ranging from 0 to 70. The Y-axis represents Relative intensity in a dot u dot. Four traces are stacked vertically. From bottom to top, they are labeled Na B in black, I P B sub 5 in red, I P B sub 15 in blue, and I P B sub 28 in pink. Vertical dashed lines align peaks across the traces. Symbols at the top identify peaks: open circles for montmorillonite and open squares for quartz. Montmorillonite peaks are located near 7, 20, 27, 35, and 54 degrees. Quartz peaks are located near 28, 55, and 62 degrees. An orange dashed box highlights the first peak area between 3 and 12 degrees.
Panel b: This is an expanded scale of the region highlighted in panel a. The X-axis represents 2 theta in degrees from 3 to 12. The Y-axis is Relative intensity. The four traces are stacked in the same order. Each trace has a vertical tick mark on its primary peak with a corresponding d sub 0 0 1 spacing value.
* Na B: peak at 11.97 Angstroms.
* I P B sub 5: peak at 12.49 Angstroms.
* I P B sub 15: peak at 12.51 Angstroms.
* I P B sub 28: peak at 12.69 Angstroms.
The peaks show a progressive shift toward lower 2 theta values as the polymer dose increases.
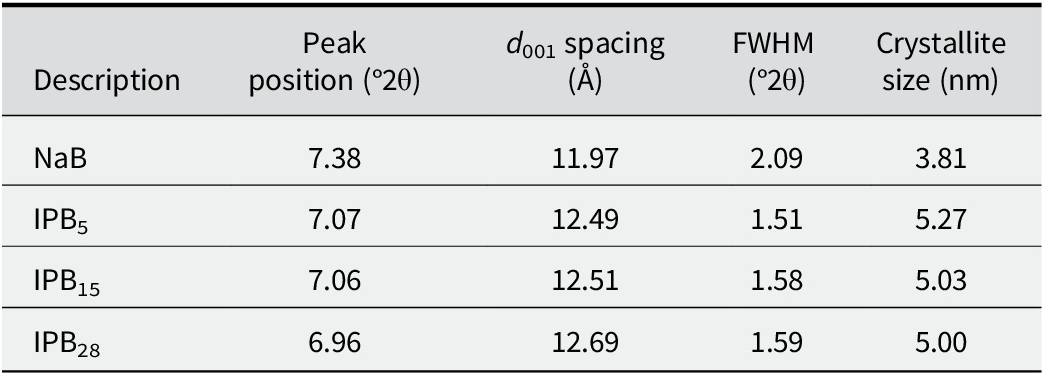
Compared with NaB, a reduction in the intensity of XRD peaks was observed in all IPBs, indicating crystallinity loss due to clay-lattice distortion caused by polymer adsorption. To examine polymer intercalation, the montmorillonite (001) peak shift was analyzed (Fig. 2b). In virgin NaB, the peak observed at 7.38°2θ corresponded to the (001) facial orientation. Despite variations in polymer dose, this peak remained consistent across all IPBs, indicating a stacked clay layer arrangement without exfoliated basal planes. The d 001 spacing showed a slight increase with increasing polymer dose (Fig. 2b); however, this was insignificant in promoting polymer intercalation, suggesting only minor modifications to the lattice structure due to polymer addition.
Interestingly, the (001) peak in IPB28 broadened and split, forming a shoulder peak at 7.91°2θ, indicating the presence of multiple crystallographic domains or structural disorders (Fig. 2b). The appearance of this shoulder peak revealed that polymer adsorption onto the clay surface induced lattice strain, disrupting the crystal arrangement (Vinila et al., Reference Vinila, Jacob, Mony, Nair, Issac, Rajan, Nair and Isac2014). This effect was distinct in IPB28, reinforcing the role of higher polymer dosage in modifying the structural alignment of NaB. A deeper understanding of nanoscale phenomena in IPBs requires knowledge of crystallite size (D). The crystallite size was calculated using the Debye-Scherrer equation, as shown below.

where 0.9 is the Scherrer constant, λ = 0.154 nm represents the X-ray wavelength, β is the full width at half maximum (FWHM) of the (001) peak, and θ is half the diffraction angle, 2θ.
It was evident that the most significant increase in d 001 spacing occurred with the initial polymer addition to NaB, while a further increase in polymer dose led to a comparatively insignificant change in d 001 spacing (Table 2). The observed increase in d 001 spacing aligned with the trend of increasing crystallite size, which was attributed to perturbations in crystallographic orientation, edge effects, and alterations in the crystal-lattice arrangement induced by polymer adsorption (Vinila et al., Reference Vinila, Jacob, Mony, Nair, Issac, Rajan, Nair and Isac2014). These subtle changes increased the crystal domain size of NaB without affecting its long-range clay structure. However, at higher polymer doses, the crystallite size decreased because excess polymer disrupted the regular, repeating layered structure of NaB. Notably, while the individual layers within the crystal domains of IPBs exhibited imperfections, their overall lattice structure maintained long-range order and a well-defined crystalline arrangement, as observed in the XRD pattern (Fig. 2a).
Summary of XRD analysis

Table 2. Long description
The table consists of five columns and five rows including the header.
Column headers from left to right are:
1. Description
2. Peak position (degrees 2 theta)
3. d sub 0 0 1 spacing (Angstroms)
4. F W H M (degrees 2 theta)
5. Crystallite size (n m)
Data rows from top to bottom:
* Row 1: NaB; Peak position 7.38; d spacing 11.97; F W H M 2.09; Crystallite size 3.81.
* Row 2: I P B sub 5; Peak position 7.07; d spacing 12.49; F W H M 1.51; Crystallite size 5.27.
* Row 3: I P B sub 1 5; Peak position 7.06; d spacing 12.51; F W H M 1.58; Crystallite size 5.03.
* Row 4: I P B sub 2 8; Peak position 6.96; d spacing 12.69; F W H M 1.59; Crystallite size 5.00.
Molecular alterations
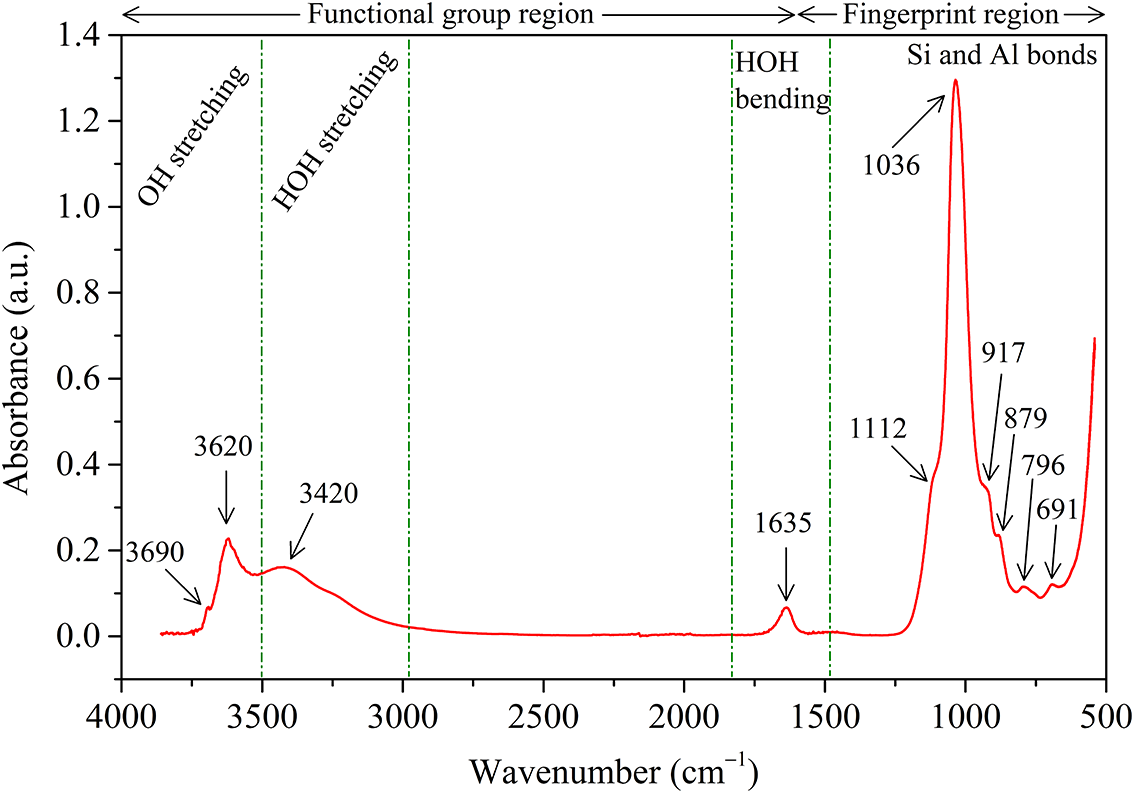
To interpret the clay–polymer interactions within IPBs, specific FTIR spectral regions were examined in detail (Fig. 3) with NaB serving as the reference baseline (Fig. 4). For comparison, the FTIR spectrum of SAP was also included, and the corresponding band assignments are summarized in Table 3. The distinct absorption peaks at 3690 cm–1 and 3620 cm–1 corresponding to the stretching vibrations of structural hydroxyl groups (-OH) associated with the octahedral sheet, decreased consistently in intensity with increasing polymer dosage (Fig. 3a). This reduction indicated displacement of bound water molecules from the clay surface during polymer adsorption, driven by a negative change in Gibbs free energy (Theng, Reference Theng1970). Similarly, the broad band at 3420 cm–1, assigned to HOH stretching vibrations of interlayer water, decreased with increasing polymer dosage (Fig. 3a), indicating reduced water adsorption capacity as the polymer progressively occupied hydration sites. This interpretation was corroborated by the measured decrease in SSA with increasing polymer dosage (Table 1), confirming that polymer addition restricted hydration and thereby reduced the clay’s water-adsorption capacity.
FTIR spectra of virgin NaB, SAP, and IPBs with varied polymer doses in the wavenumber range: (a) 3800 cm–1 to 2800 cm–1, (b) 1800 cm–1 to 1200 cm–1, (c) 1200 cm–1 to 800 cm–1.

Figure 3. Long description
Panel a shows the wavenumber range from 3800 to 2800 cm super minus 1 on the x-axis and Absorbance in a.u. from 0.0 to 0.4 on the y-axis. S A P (green line) shows a broad peak at 3420 and a smaller peak at 2945. N a B (black line) and I P B variants show sharp peaks at 3690 and 3620. Absorbance decreases as polymer dose increases from I P B sub 5 to I P B sub 28.
Panel b covers 1800 to 1200 cm super minus 1. S A P shows prominent peaks at 1556-1570 (shaded region), 1454, 1415, 1367, and 1304. N a B has a single peak at 1635. I P B samples show a combination of these features, including a peak at 1715.
Panel c covers 1200 to 800 cm super minus 1 with a higher y-axis scale up to 1.5. N a B (black) has the highest intensity peak at 1036, followed by I P B sub 5 (red), I P B sub 15 (blue), and I P B sub 28 (magenta) in descending order of intensity. Additional smaller peaks are noted at 1112, 917, and 879. S A P (green) remains relatively flat in this region.
FTIR spectrum of virgin sodium bentonite.

Figure 4. Long description
A line graph with the y-axis labeled Absorbance in a.u. ranging from 0.0 to 1.4 and the x-axis labeled Wavenumber in centimeters super minus 1 ranging from 4000 down to 500. The graph is divided into two main top-level sections: Functional group region from 4000 to approximately 1300 and Fingerprint region from 1300 to 500.
Moving from left to right:
* In the O H stretching zone, two small peaks are labeled at 3690 and 3620.
* In the H O H stretching zone, a broad low peak is labeled at 3420.
* In the H O H bending zone, a small sharp peak is labeled at 1635.
* In the Fingerprint region, labeled as Si and Al bonds, a very high sharp peak reaches approximately 1.3 absorbance at 1036.
* On the right shoulder of this main peak, smaller peaks and inflections are labeled at 1112, 917, 879, 796, and 691.
Band assignment for FTIR spectra of Na bentonite and in situ polymerized bentonites

Table 3. Long description
The table consists of two columns: Wavenumber in cm super -1 and Functional group and fingerprint regions.
* 3690, 3620: Al-O H sub str (stretching of structural hydroxyl groups in the octahedral sheet).
* 3420: H-O H sub str (stretching of hydroxyl groups of adsorbed water).
* 2945: C-H sub str (C-H stretching of methyl, methylene groups of acrylate).
* 1715: C=O sub str of the ester group.
* 1635: H-O H sub bnd (bending vibration of hydroxyl groups of water).
* 1556-1570: C O O super - sub asymmetric str (carboxylate group stretching of sodium acrylate).
* 1454: C-H sub bnd (in-plane bending vibration of methylene groups).
* 1415: C O O super - sub symmetric str (carboxylate group stretching of sodium acrylate).
* 1367: C-H sub bnd (bending vibration of methyl groups).
* 1304: C-C sub str.
* 1112: Si-O-Si sub str out-of-plane vibration.
* 1036: Si-O-Si sub str in-plane vibration.
* 917: Al-Al-O H sub bnd.
* 879: Al-Fe-O H sub bnd.
Footnote indicates str equals stretching and bnd equals bending.
Band designation based on Tran et al. (Reference Tran, Dennis, Milev, Kannangara, Wilson and Lamb2005); Konan et al. (Reference Konan, Peyratout, Smith, Bonnet, Rossignol and Oyetola2009); Magalhães et al. (Reference Magalhães, Almeida Neto, Bezerra, Ricardo and Feitosa2012); Natkański et al. (Reference Natkański, Kuśtrowski, Białas, Piwowarska and Michalik2012); Jin et al. (Reference Jin, Chen, Mao, Yue, Han and Yu2017); str = stretching; bnd = bending.
The FTIR spectra of IPBs (Fig. 3b) exhibited all characteristic absorption bands of SAP, indicating successful grafting of the polymer into the clay matrix (Tran et al., Reference Tran, Dennis, Milev, Kannangara, Wilson and Lamb2005). The band at 1635 cm–1, attributed to OH bending vibrations of physisorbed water, was observed in both NaB and IPBs, with comparable or greater intensity in IPBs (Fig. 3b). This behavior reflected the inherent WAC of SAP and indicated retention of absorbed water within IPBs (Magalhães et al., Reference Magalhães, Almeida Neto, Bezerra, Ricardo and Feitosa2012). In addition, the characteristic NaB peaks within the 800 cm–1 to 1200 cm–1 region decreased progressively in intensity with increasing polymer dosage (Fig. 3c). This attenuation suggested structural modifications in the clay lattice arising from polymer incorporation, consistent with the XRD results. Polymer adsorption onto the clay surface restricted bond vibrations under IR excitation, resulting in diminished peak intensities across this spectral region.
Beyond these spectral variations, the emergence of a distinct absorption band at 1715 cm–1 (Fig. 3b) in IPBs corresponded to C=O stretching vibrations associated with acrylate and ester groups (Konan et al., Reference Konan, Peyratout, Smith, Bonnet, Rossignol and Oyetola2009; Jin et al., Reference Jin, Chen, Mao, Yue, Han and Yu2017). As IPBs were washed thoroughly during synthesis to remove unreacted monomer, this peak was attributed to esterification reactions between clay and polymer, wherein carboxyl/carbonyl groups of the acrylate monomer reacted with hydroxyl groups of clay to form ester (-COOR) bonds (Liu et al., Reference Liu, Li, Zhou, Zhang, Wei and Shen2006). The progressive intensification of this peak with increasing polymer dosage confirmed the formation of a covalent ester bond, which, in turn, strengthened clay–polymer interactions at higher dosages. In addition, hydrogen bonding interactions were evidenced by the red shift in Si–O stretching vibrations and the emergence of polymer‑related functional groups (Fig. 3c). These spectral changes indicated that carboxyl groups of the polymer formed hydrogen bonds with basal oxygen atoms on siloxane clay surfaces (Gates et al., Reference Gates, Shaheen, Turney and Patti2016).
Accordingly, the clay–polymer interactions in IPBs were interpreted as a dual binding mechanism involving both esterification and hydrogen bonding, with their relative contributions varying with polymer dosage. At lower polymer dosages, hydrogen bonding dominated, governing the polymer interactions with siloxane surfaces. With increasing polymer addition, the 1715 cm–1 peak intensity increased, indicating an increasing contribution from esterification. Although precise quantification of the relative contributions was not feasible using FTIR alone, the spectral evolution indicated stronger and more stable clay–polymer interactions at polymer dosages >15%. When integrated with k results and microstructural observations, these findings confirmed a mechanistic transition from clay-dominated behavior at lower polymer dosages to polymer-controlled interactions at higher polymer dosages.
Thermal analysis
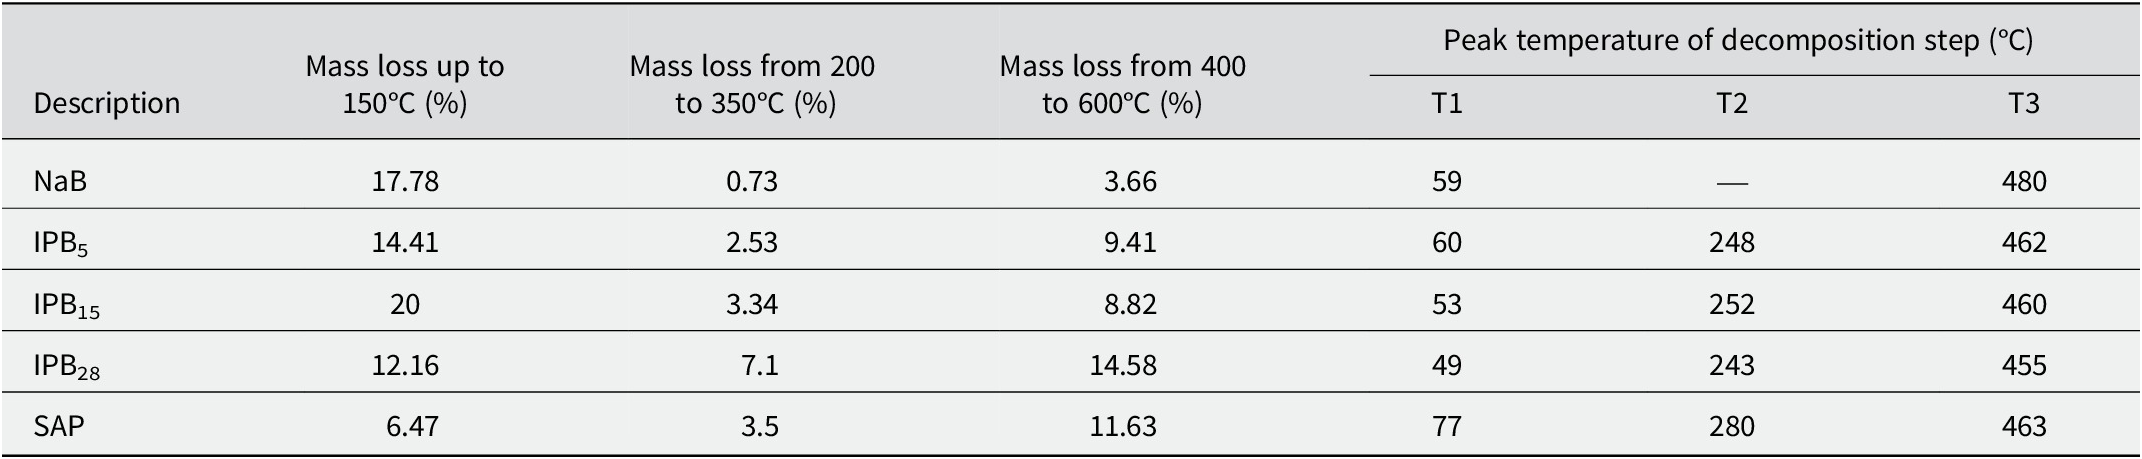
The thermograms of NaB and IPBs are shown in Fig. 5a. The thermogram of NaB exhibited two distinct thermal degradation regions (Fig. 5b): the loss of physisorbed water (at the edges, external and internal clay surfaces) and the hydration water of exchangeable cations between 30 and 150°C, followed by clay mineral dehydroxylation between 400 and 600°C (Fardi et al., Reference Fardi, Aalaie and Sepehri2023). The addition of a polymer to clay resulted in new peaks in the derivative weight loss curve, indicating changes in its thermal decomposition behavior. The thermogram of IPBs showed three distinct regions, indicated by gray shaded areas (Fig. 5b). The first region, below 150°C, corresponded to desorption of physisorbed and interlayer water. The second region, from 200 to 350°C, involved the decomposition of organic species, during which short, non-crosslinked linear SAP chains were degraded. The third region, spanning 400–600°C, was characterized by the dehydroxylation of structural water in the clay, the breakdown of crosslinked polymer chains, and decarboxylation, resulting in the release of CO2 (Fu et al., Reference Fu, Cao, Lei, Chen, Shi and Xu2016). These thermal degradation regions exhibited distinct peaks, denoted as T1, T2, and T3, respectively (Fig. 5b).
Thermogravimetric response of virgin NaB and IPBs with varied polymer doses: (a) weight loss curve; (b) derivative of weight-loss curve.

Figure 5. Long description
A two-panel line graph with a shared legend at the top for N a B (black), I P B sub 5 (red), I P B sub 15 (blue), I P B sub 28 (magenta), and S A P (green).
Panel a: Weight loss curve. The x-axis is Temperature in degrees Celsius from 0 to 800. The y-axis is Weight percentage from 60 to 100. All curves show a sharp initial drop between 0 and 100 degrees Celsius. N a B stabilizes at 80 percent weight. The I P B and S A P samples show secondary and tertiary degradation steps. I P B sub 28 shows the greatest total weight loss, ending near 58 percent at 800 degrees Celsius.
Panel b: Derivative of weight loss curve. The x-axis is Temperature in degrees Celsius from 0 to 800. The y-axis is Derivative of weight in percent per degree Celsius from negative 0.4 to 0.0. Three shaded vertical regions highlight thermal events.
- T 1: A sharp downward peak near 60 degrees Celsius for all samples.
- T 2: A broad, shallow trough between 200 and 320 degrees Celsius.
- T 3: A significant downward peak between 400 and 600 degrees Celsius.
An inset zoom-in focuses on the T 3 region, showing that I P B sub 28 has the deepest peak in this range, followed by I P B sub 15, I P B sub 5, and S A P, while N a B remains nearly flat.
While NaB exhibited only T1 and T3 peaks, the inclusion of polymer introduced an additional T2 peak in IPBs. Within the 400–600°C region, IPBs exhibited multi-phase decomposition, as evidenced by discrete depressions in the derivative curve that indicated diverse bonding environments. The nature of clay–polymer interactions was reflected in the observed variations in the thermal signatures in the T2 and T3 temperature regions (Natkański et al., Reference Natkański, Kuśtrowski, Białas, Piwowarska and Michalik2012). In IPBs, both peaks shifted progressively to slightly lower temperatures with increasing polymer dosage. The fraction decomposed at or near T2 and T3 temperatures corresponded to polymer chemically bonded with NaB. Beyond the chemically bonded fraction, higher polymer dosages led to peak shifts, reflecting excess polymer adsorbed onto the clay surface via physical interactions once the active sites were occupied. Thus, the coexistence of chemical bonding and physical adsorption mechanisms in IPBs was evidenced by the peak shifts. The quantified mass loss showed a greater total weight loss in IPBs than in NaB, due to thermal decomposition of the grafted polymer (Table 4). These thermal degradation insights and the inferred interactions were consistent with XRD and FTIR findings.
Summary of thermogravimetric analysis

Table 4. Long description
The table is organized into seven columns. The first column, Description, lists the samples: NaB, I P B sub 5, I P B sub 15, I P B sub 28, and S A P.
Columns 2 through 4 list Mass loss percentages in specific temperature ranges:
- Up to 150 degrees Celsius: NaB 17.78, I P B sub 5 14.41, I P B sub 15 20, I P B sub 28 12.16, S A P 6.47.
- 200 to 350 degrees Celsius: NaB 0.73, I P B sub 5 2.53, I P B sub 15 3.34, I P B sub 28 7.1, S A P 3.5.
- 400 to 600 degrees Celsius: NaB 3.66, I P B sub 5 9.41, I P B sub 15 8.82, I P B sub 28 14.58, S A P 11.63.
Columns 5 through 7 list Peak temperature of decomposition steps in degrees Celsius:
- T 1: NaB 59, I P B sub 5 60, I P B sub 15 53, I P B sub 28 49, S A P 77.
- T 2: NaB is not applicable, I P B sub 5 248, I P B sub 15 252, I P B sub 28 243, S A P 280.
- T 3: NaB 480, I P B sub 5 462, I P B sub 15 460, I P B sub 28 455, S A P 463.
‘—’ denotes not applicable or not present.
Morphological evolution
Upon polymer augmentation, the fabric and morphology of the clay are expected to be altered due to physical and chemical interactions between the clay and the polymer, as indicated by XRD and FTIR analyses. Accordingly, SEM analysis was performed to capture the microstructural evolution during permeation, to evaluate morphological changes induced by polymerization, and to visually interpret clay-polymer interactions under the given permeant conditions. Microstructure images of specimens permeated with DW were examined (Fig. 6). The NaB specimen exhibited a 2:1 layered clay arrangement with a gel-like morphology, a random face-to-face arrangement, and a uniform matrix (Fig. 6a). These attributes resulted from osmotic swelling, which rendered a dispersed clay fabric and lamellar structure. As a result, the permeant traced a narrow, tortuous flow path, leading to a low k value. Significant changes in clay fabric and morphology were observed upon polymer addition, with distinctive SAP hydrogel characteristics evident (Fig. 6b). The hydrogel filled the void spaces and formed bridges linking NaB clusters. In IPB15, the layered clay sheets showed signs of strain due to polymer addition, displaying a face-to-face configuration with a tightly packed structure oriented perpendicular to the flow direction (Fig. 6c). The polymer did not intercalate clay interlayers but induced structural disorder in the crystal lattice, as confirmed by XRD analysis. At higher polymer dosage, SAP formed a rough polymeric sheath that completely enveloped the NaB surface, producing a composite of a polymer matrix embedding clay particles (Fig. 6d). This sheath was more evident in IPBs with high polymer dosage, as observed clearly in IPB28.
SEM images of soil specimens permeated with DW: (a) NaB, (b) IPB5, (c) IPB15, and (d) IPB28.

Figure 6. Long description
A four-panel S E M micrograph set.
Panel a, top-left, labeled a, shows a dense, crumpled, and flaky texture with fine ridges. The status bar indicates a magnification of 5,000 times and a 10 micrometer scale bar.
Panel b, top-right, labeled b, displays a more porous and fibrous network with interconnected structural elements. The status bar indicates a magnification of 1,000 times and a 50 micrometer scale bar.
Panel c, bottom-left, labeled c, reveals a highly oriented, lamellar structure with large, elongated parallel voids or pores. The status bar indicates a magnification of 1,000 times and a 50 micrometer scale bar.
Panel d, bottom-right, labeled d, shows a smoother, more consolidated surface with scattered white particulate matter and occasional circular pore openings. The status bar indicates a magnification of 500 times and a 100 micrometer scale bar.
All panels include technical metadata at the bottom, including H V at 20.00 or 30.00 k V, W D ranging from 10.4 to 14.3 mm, and the equipment name QUANTA 200 F S A I F minus I I T M.
The SEM images of NaB and IPB specimens permeated with NaCl solutions were analyzed (Fig. 7). At lower concentrations, NaB exhibited a gel structure, which disappeared as concentration increased, transitioning into a flocculated structure (Fig. 7a–c). This fabric alteration caused clay particles to aggregate, creating inter-aggregate pores that facilitated preferential flow, leading to high k in NaB. The MIP test results further corroborated this observation. In contrast, the addition of polymer to NaB modified the clay fabric significantly, leading to the complete disappearance of the stacked clay arrangement. When permeated with 20 mM NaCl, IPB5 and IPB15 exhibited numerous polymer bridges linking clay particles (Fig. 7d,g). These interparticle bridges reinforced the clay particles, while the polymer hydrogel effectively filled the void space. As concentration increased, the surfaces became dense and elastic, with no voids or aggregate formation (Fig. 7e–i). The polymer encapsulating clay particles acted as a protective shield, preventing fabric alterations and aggregate formation in IPBs, which could otherwise induce high k as in pristine NaB without the polymer. For all pore fluids, IPB28 displayed a surface morphology similar to that of DW-permeated samples (Fig. 7j–l). Its persistent low k, even at higher NaCl concentrations, was attributed to the polymer blanket covering the clay surface.
SEM images of soil specimens permeated with NaCl solution: (a,b,c) NaB, (d,e,f) IPB5, (g,h,i) IPB15, and (j,k,l) IPB28.

Figure 7. Long description
The grid consists of four columns and three rows of S E M micrographs.
Column 1 (Na B):
- Panel a (20 m M): Shows a highly porous, flaky, and open honeycomb-like structure.
- Panel b (200 m M): Displays a more aggregated and granular texture with smaller pores.
- Panel c (1000 m M): Shows large, dense, and cracked soil aggregates with minimal visible porosity.
Column 2 (I P B sub 5):
- Panel d (20 m M): Features fibrous strands connecting irregular soil masses.
- Panel e (200 m M): Shows a denser, layered sheet-like morphology with elongated voids.
- Panel f (1000 m M): Displays a smooth, continuous surface with large, deep circular depressions.
Column 3 (I P B sub 15):
- Panel g (20 m M): Shows thick, bridge-like structures connecting rounded soil particles.
- Panel h (200 m M): Features a folded, skin-like texture covering the underlying soil matrix.
- Panel i (1000 m M): Shows a very dense, consolidated surface with few visible pores.
Column 4 (I P B sub 28):
- Panel j (20 m M): Displays a smooth, film-like coating over the soil grains with small perforations.
- Panel k (200 m M): Shows a rougher surface with numerous small, sharp-edged pits.
- Panel l (1000 m M): Features a highly porous, sponge-like network with interconnected voids.
Each panel includes a black data bar at the bottom containing technical metadata such as H V (30.00 k V), mag (ranging from 100 times to 10,000 times), and a scale bar (ranging from 5 micrometers to 500 micrometers).
The SEM images of NaB and IPB specimens permeated with CaCl2 solutions were examined (Fig. 8). When NaB interacted with CaCl2 solutions, cation exchange reactions occurred, suppressing osmotic swelling and leading to the formation of inter-aggregate pores. Consequently, the resulting NaB aggregates appeared larger than those in NaCl solution, highlighting the influence of the divalent cation (Fig. 8a–c). This observation supported the increasing trend in k of NaB (Fig. 1). Features observed in IPB5 and IPB15 permeated with NaCl solutions (Fig. 7) at concentrations ≥200 mM were similarly noted at much lower CaCl2 concentrations (Fig. 8d,g), emphasizing the effect of pore-fluid chemistry on polymer conformational changes. The interparticle bridges and pore-clogging by the polymer were evident in IPB5 and IPB15, contributing to their low k values (Fig. 8e,h). A fabric similar to NaB but denser with no voids was observed (Fig. 8f), while a polymer film was evident (Fig. 8i). Unlike NaCl permeation, IPB28 exposed to CaCl2 solution exhibited slightly different morphology, with numerous interparticle polymer bridges at low concentrations that transformed into a rough polymeric surface encompassing clay clusters at higher concentrations (Fig. 8j–l). The observed microstructural features were responsible for the low k in IPBs and supported their macroscale hydraulic performance.
SEM images of soil specimens permeated with CaCl2 solution: (a,b,c) NaB, (d,e,f) IPB5, (g,h,i) IPB15, and (j,k,l) IPB28.

Figure 8. Long description
A grid of 12 S E M micrographs labeled a through l.
Column 1 (N a B):
Panel a (20 m M) shows a dense, wavy, and continuous clay fabric.
Panel b (200 m M) displays more granular, aggregated clusters.
Panel c (1000 m M) reveals a highly fractured and porous surface with distinct vertical cracks.
Column 2 (I P B sub 5):
Panel d (20 m M) shows thin, film-like sheets.
Panel e (200 m M) exhibits a sponge-like porous network.
Panel f (1000 m M) shows a rough, jagged texture with small, sharp protrusions.
Column 3 (I P B sub 15):
Panel g (20 m M) shows a smooth surface with small embedded particles.
Panel h (200 m M) reveals large, deep circular voids or macropores.
Panel i (1000 m M) displays a complex web of interconnected fibrous strands.
Column 4 (I P B sub 28):
Panel j (20 m M) shows a network of thick bridges between soil masses.
Panel k (200 m M) exhibits a highly porous, honeycomb-like structure.
Panel l (1000 m M) shows sharp, plate-like crystalline structures overlapping each other.
Each panel includes a black data bar at the bottom with technical parameters including high voltage (30.00 k V), magnification ranging from 250 times to 2500 times, and scale bars ranging from 20 micrometers to 200 micrometers.
The SEM images of NaB and IPB specimens permeated with AlCl3 solutions were analyzed (Fig. 9). The high k of NaB in AlCl3 solutions was attributed to the large open pore space formed by flocculation of clay particles. Permeation of AlCl3 solutions significantly reduced the DDL thickness, causing the clay particles to shrink and form an aggregated structure, leading to high k in NaB (Fig. 9a–c). Due to the higher cation valence and concentration, the aggregates formed were larger than those observed in monovalent and divalent solutions. The IPB5 and IPB15 exhibited features, including polymer-filled void spaces, crosslinked polymer bridges, and the polymer surface cover on NaB (Fig. 9d–i). Pore-clogging by the hydrogel was observed in IPB28 (Fig. 9j). At higher concentrations, the polymeric blanket became more compact and dense in IPB28 due to the higher polymer dose (Fig. 9k,l).
SEM images of soil specimens permeated with AlCl3 solution: (a,b,c) NaB, (d,e,f) IPB5, (g,h,i) IPB15, and (j,k,l) IPB28.

Figure 9. Long description
The grid consists of 12 S E M micrographs labeled a through l.
Column 1 (Na B soil):
* Panel a (20 m M): Shows a dense, wavy, and foliated clay fabric.
* Panel b (200 m M): Displays a transition to more granular, flocculated clusters.
* Panel c (1000 m M): Features highly aggregated, popcorn-like clusters with visible inter-cluster pores.
Column 2 (I P B sub 5 soil):
* Panel d (20 m M): Shows large, smooth plate-like structures.
* Panel e (200 m M): Reveals a complex network of interconnected thin sheets and filaments.
* Panel f (1000 m M): Displays a more compact but porous matrix with vertical structural orientations.
Column 3 (I P B sub 15 soil):
* Panel g (20 m M): Shows a fibrous, web-like texture.
* Panel h (200 m M): Features large, rounded macropores within a dense clay matrix.
* Panel i (1000 m M): Shows distinct circular or ring-like mineral formations on a rough surface.
Column 4 (I P B sub 28 soil):
* Panel j (20 m M): A lower magnification view showing a cracked, crust-like surface with a large smooth inclusion.
* Panel k (200 m M): Shows a highly irregular, jagged surface with deep recesses.
* Panel l (1000 m M): Displays a fragmented, granular surface with numerous small voids and crystalline precipitates.
Each panel includes a black data bar at the bottom with technical parameters including high voltage (30.00 k V), magnification (ranging from 150 times to 5000 times), and scale bars (ranging from 10 micrometers to 400 micrometers).
To distinguish the polymer phase from NaB and to characterize pore-clogging regions, IPB28 permeated with 20 mM AlCl3 was analyzed by EDS analysis. Elemental mapping showed Si-Al clay-rich regions associated with oxygen and sodium elements (Fig. 10). Due to ion exchange reactions, aluminum was dominant in IPB28, while magnesium and iron were scarce because of their lower abundance. Carbon mapping exclusively represented the polymer, appearing as red dots (Fig. 11). A high concentration of carbon was observed in regions where the polymer clogged the inter-aggregate pores of NaB, appearing as a less dense matrix in the SEM image (Fig. 9j). This provided compelling evidence of hydrogel-induced pore clogging. In contrast, the sparse distribution of carbon elsewhere indicated localized polymer adsorption onto the clay surface as discrete patches. To provide a comprehensive visual interpretation, the overlay of SEM-EDS elemental mapping was presented, illustrating the spatial correspondence between the carbon-enriched region and the pore-clogging feature observed in the SEM image (Fig. 12).
SEM–EDS overlay image of IPB28 specimen permeated with 20 mM AlCl3 solution. The enlarged view highlights the spatial correspondence between the hydrogel-filled pore in the SEM image and elemental mapping.

Figure 10. Long description
A legend at the top identifies seven elements by color: Silicon in cyan, Aluminum in magenta, Oxygen in green, Sodium in blue, Carbon in red, Magnesium in yellow, and Iron in lime green. The main field is a dark microscopic view densely populated with colored pixels. Cyan pixels representing Silicon and green pixels for Oxygen are the most dominant, forming a continuous matrix across the entire area. Several large, irregular black voids or pores are scattered throughout the field, most notably a large central pore and several smaller ones in the bottom-left and top-right quadrants. Within these pores, there is a higher concentration of magenta pixels for Aluminum and blue pixels for Sodium, indicating the presence of the A l C l sub 3 solution and hydrogel. Red Carbon and yellow Magnesium pixels are sparsely distributed as fine specks across the matrix.
Carbon element mapping of the IPB28 specimen permeated using 20 mM AlCl3 solution.

Figure 11. Long description
The elemental map displays Carbon distribution across the I P B 28 specimen. The highest density of red pixels is concentrated in a large, irregular polygonal cluster located in the center-right quadrant. A secondary, smaller cluster of moderate density is visible in the upper-left quadrant. The remainder of the field of view contains a sparse, uniform distribution of red stippling, representing background levels of Carbon. There are distinct black voids where no Carbon is detected, most notably in the lower-left and far-right regions of the map.
Overlay of SEM micrograph with elemental mapping for the IPB28 specimen permeated using 20 mM AlCl3 solution.

Figure 12. Long description
The figure consists of two side-by-side panels.
Left panel: A wide-field S E M micrograph at 150 times magnification. The surface shows a highly textured, cracked, and porous morphology with a grey-scale appearance. A yellow square frame in the center-right of this panel highlights a specific region of interest containing a smoother, darker depression surrounded by rough, elevated material. A scale bar at the bottom right indicates 300 micrometers. Data at the bottom includes a date of 9 forward slash 8 forward slash 2023, H V at 30.00 k V, W D at 10.7 mm, and the detector set to B S E D.
Right panel: A magnified view of the area within the yellow square. This panel overlays elemental mapping data onto the S E M image. The smooth central depression is populated with a dense distribution of multicolored pixels, primarily green, red, and blue, representing the presence of specific elements from the 20 m M Al Cl sub 3 solution. The surrounding rough material shows a lower density of these colored markers. The transition between the smooth central basin and the jagged perimeter is clearly defined by the change in both texture and elemental signal concentration.
Overall, IPBs exhibited diverse morphologies characterized by various forms of pore-structure modifications and clay–polymer associations, which contributed to enhanced flow tortuosity and low k. Observations from SEM images further indicated that clay–polymer interactions and the resulting microstructural evolution of IPBs varied with pore-fluid chemistry and polymer dose. Accordingly, SEM images were captured at varying magnifications to highlight distinct microstructural features that emerged under different polymer dosages and pore-fluid concentrations (Figs 6–9). Lower magnifications emphasized fabric alterations, pore connectivity, gel formation, and polymer strands, while higher magnifications illustrated polymer bridging, pore-clogging, and polymer surface cover. While the present study focused primarily on the hydraulic and microstructural behavior of IPBs, the polymer-induced modifications observed are anticipated to influence their mechanical performance in barrier applications. However, comprehensive mechanical characterization that considers the effects of polymer type, dosage, and synthesis method was beyond the scope of the present study.
Pore-size distribution characteristics
The PSD curves of NaB and IPBs permeated with DW were examined (Fig. 13), revealing two distinct pore-size regions: inter-aggregate pores (>175 nm) and intra-aggregate pores (<175 nm). Polymer addition significantly altered the PSD characteristics of NaB. The cumulative pore volume and inter-aggregate pore volume were greater for IPBs than for NaB, and both increased with polymer dose. This behavior arose because the polymer imbibed water to form hydrogels; the greater the polymer dose, the more extensive the hydrogel formation, thereby generating additional pore spaces accessible to mercury intrusion. Consequently, the size of inter‑aggregate pores increased with the polymer dose, while the intra‑aggregate pores remained unchanged.
(a) Specific pore volume and (b) its derivative curves for NaB and IPBs permeated using DW.

Figure 13. Long description
A two-panel line graph with a shared legend at the top for four materials: Na B (black), I P B sub 5 (blue), I P B sub 15 (red), and I P B sub 28 (magenta). Both panels use a logarithmic X-axis for Pore size in micrometers, ranging from 100 down to 0.01.
Panel a, titled Cumulative intrusion in cubic centimeters per gram, shows four sigmoidal curves. As pore size decreases from 100 to 10 micrometers, the intrusion values for all materials rise sharply. I P B sub 28 reaches the highest plateau at approximately 2.0, followed by I P B sub 15 at 1.6, I P B sub 5 at 1.2, and Na B at the lowest plateau of 0.5.
Panel b, titled d V forward slash d log D in cubic centimeters per gram, shows the derivative pore size distribution. The graph is divided into two shaded regions by a vertical dashed line at approximately 0.15 micrometers.
* The left region, shaded with blue diagonal lines, is labeled Inter-aggregate pores. It contains major peaks for all materials between 100 and 5 micrometers. I P B sub 28 shows a prominent sharp peak at 15 micrometers, while Na B shows a much lower, broader bimodal distribution.
* The right region, shaded with yellow diagonal lines, is labeled Intra-aggregate pores. It shows very low activity for all materials, with minor fluctuations near 0.01 micrometers.
The effect of pore-fluid chemistry on pore-structure evolution was examined (Fig. 14), with the volume fraction of different pore sizes quantified (Table 5). For NaB, the total pore volume increased with increasing cation valence and pore-fluid concentration (Fig. 14a–c). This trend was attributed to fabric modifications driven by physicochemical interactions, in which flocculation of clay particles enlarged pore volume, created additional flow paths, and consequently increased k. Similarly, IPBs exhibited an increase in total pore volume with increasing pore-fluid concentration; however, the magnitude of the increase decreased with increasing cation valence. Furthermore, with increasing pore-fluid concentration, the inter-aggregate pore volume increased for IPBs while the intra-aggregate pore volume decreased. In contrast, the inter-aggregate pore volume decreased with increasing cation valence. This phenomenon could be explained using SEM images, which showed that the polymer hydrogel clogged pore spaces, bridged adjacent clay clusters, and encapsulated clay particles. As these pore spaces became occupied by different polymer morphologies, they remained accessible to mercury intrusion, thereby increasing the measured inter-aggregate pore volume while restricting the intra-aggregate pore volume (Fig. 14d–l).
Pore-structure evolution in: (a,b,c) NaB, (d,e,f) IPB5, (g,h,i) IPB15, and (j,k,l) IPB28 permeated with: (a,d,g,j) NaCl, (b,e,h,k) CaCl2, and (c,f,i,l) AlCl3 solution.

Figure 14. Long description
A multi-panel plot with 12 panels labeled a through l. The x-axis for all panels is Pore size in micrometers on a logarithmic scale from 100 down to 0.01. The y-axis is d V forward slash d log D in cubic centimeters per gram. Each panel contains three colored lines: green for 20 m M, orange for 200 m M, and pink for 1000 m M.
Background shading divides each graph into two zones: a blue hatched Inter-aggregate pore size region from 100 to 0.15 micrometers, and a yellow hatched Intra-aggregate pore size region from 0.15 to 0.01 micrometers.
* Row 1 (panels a, d, g, j) shows N a C l solution. Peaks generally shift toward larger pore sizes as concentration increases, particularly in N a B and I P B sub 28.
* Row 2 (panels b, e, h, k) shows C a C l sub 2 solution. I P B sub 5 and I P B sub 15 show complex multi-modal peaks between 10 and 100 micrometers.
* Row 3 (panels c, f, i, l) shows A l C l sub 3 solution. N a B shows a massive peak near 5 micrometers at 1000 m M, while I P B sub 28 shows much lower intensity peaks compared to the N a C l row.
Across all panels, the 1000 m M pink line typically shows the highest intensity peaks in the inter-aggregate region, while the 20 m M green line remains lowest. The intra-aggregate region (yellow) shows minimal activity except for small spikes in the I P B sub 28 samples.
Comparison of variation in pore-volume characteristics of Na bentonite and in situ polymerized bentonites

Table 5. Long description
The table lists pore volume metrics (V sub inter, V sub intra, and V sub total) for four materials: Na B, I P B sub 5, I P B sub 15, and I P B sub 28.
Key data points include:
* For D W (Distilled Water): V sub total increases from 0.46 for Na B to 2.04 for I P B sub 28.
* For N a C l (Sodium Chloride): At 1000 m M, V sub total is 1.71 for Na B, 0.93 for I P B sub 5, 0.81 for I P B sub 15, and 2.7 for I P B sub 28.
* For C a C l sub 2 (Calcium Chloride): At 1000 m M, V sub total decreases from 2.0 for Na B to 0.37 for I P B sub 28.
* For A l C l sub 3 (Aluminum Chloride): At 1000 m M, V sub total decreases significantly from 3.94 for Na B to 0.15 for I P B sub 28.
Across all samples, V sub inter (inter-aggregate pore volume) constitutes the vast majority of V sub total, while V sub intra (intra-aggregate pore volume) remains consistently low, typically between 0.01 and 0.11.
V inter = inter-aggregate pore volume, V intra = intra-aggregate pore volume, V total = total pore volume.
Comparatively, the total pore volume of IPBs was lowest in AlCl3 solutions and highest in NaCl solutions, a trend that contrasted with the k-test results. The reduced pore volume in AlCl3 solutions was attributed to distinct changes in the pore structure, as evidenced by SEM images that showed the polymer forming a membrane adsorbed onto the clay surface. This membrane restricted pore development and simultaneously limited mercury intrusion, thereby contributing to the lowest measured pore volume fraction. In contrast, the high pore volume observed in NaCl solutions was attributed to polymer hydrogel clogging, which created additional pore spaces and thereby increased the overall pore volume.
In contrast to DW permeation, no clear trend in total pore volume was observed with respect to polymer dose. With increasing polymer dose, the total pore volume increased in NaCl solutions and decreased in AlCl3 solutions. In CaCl2 solutions, the pore volume initially decreased and then increased. Overall, the pore-volume results did not align with the k trends observed in IPBs, either with varied polymer dose or pore-fluid chemistry. Although MIP results exhibited greater pore volumes for IPBs, the corresponding k values remained consistently low. This indicated that PSD characteristics derived from MIP do not represent the actual hydraulic flow paths in IPBs. The pore volume measured by MIP included pores occupied by polymer films, hydrogels, and associated bound water. These features, although accounted for in MIP results, did not contribute to hydraulic flow; instead, they increased tortuosity and effectively sustained low k. Furthermore, the water molecules associated with polymer hydrogels remained immobile and therefore did not contribute to hydraulic flow (Tian et al., Reference Tian, Likos and Benson2019; Zainab et al., Reference Zainab, Wireko, Li, Tian and Abichou2021). Consequently, pores occupied by polymer hydrogels could not be considered effective flow paths, which reconciles the apparent mismatch between MIP‑derived pore volumes and measured k values. Moreover, the polymer hydrogels in their freeze-dried state were structurally unstable, and mercury intrusion at high pressures disrupted the network and reopened pores, thereby leading to over-estimation of pore volume (Chen et al., Reference Chen, Tan, Chen, Peng, Huang and Meng2024).
Mechanisms responsible for the low hydraulic conductivity of in situ polymerized bentonites
Based on the integrated microstructural analysis, a multiscale mechanistic framework was proposed to explain the low k observed in IPBs (Fig. 15).
-
(1) Pore-clogging: the formation of polymer hydrogel clogged pore spaces, creating tortuous flow paths. The immobile water phase associated with both NaB and the hydrogel further altered the pore geometry, significantly narrowing the effective hydraulic flow channels.
-
(2) Bridging: polymer films bridged adjacent clay particles, thereby reducing inter-aggregate pores and increasing flow tortuosity.
-
(3) Encapsulation: at higher polymer dosages, the clay surface became completely coated by the polymer, forming an elastic membrane or blanket that further sealed pore spaces. This framework relied on specific clay-polymer-permeant interactions, combined with polymer dosage, which drove the evolution of distinct pore structures, thereby ensuring low k across diverse chemical environments.
Conceptual framework for multiscale mechanisms contributing to low k in IPBs.

Figure 15. Long description
The diagram consists of three panels arranged horizontally, each showing cyan circular aggregates containing dark red parallel lines representing intra-aggregate pores.
1. Filling panel on the left. The cyan aggregates are packed together with white spaces between them labeled as interaggregate pores. Small grey irregular shapes labeled as polymer hydrogel occupy these interaggregate spaces.
2. Bridging panel in the center. The cyan aggregates are spaced further apart. Thin grey lines labeled as polymer strands connect the surfaces of adjacent aggregates across the white interaggregate pores.
3. Encapsulation panel on the right. The cyan aggregates are completely embedded within a solid grey background labeled as a polymer blanket, which fills all space between the aggregates.
The material characterization and microstructural analysis revealed that the polymer interacted with the clay via both physical adsorption and chemical bonding. These strong clay–polymer interactions enhanced polymer retention within IPBs during permeation. Furthermore, incorporating a crosslinker during IPB synthesis led to significant changes in polymer properties. The addition of crosslinker promoted the formation of a stable three-dimensional crosslinked polymer network within IPBs. This structural configuration restricted polymer mobility during permeation, making elution unlikely and explaining why IPBs did not exhibit polymer elution. Furthermore, polymer adsorption onto the clay surface created additional physical crosslinking points, complementing the inherent crosslinking of polymer chains. These enhanced physical and chemical interactions significantly restricted detrimental physicochemical effects and the associated microstructural alterations in IPBs that were typically observed in virgin NaB when exposed to incompatible permeants. The low k of IPBs stemmed primarily from the synergistic clay-polymer interaction, wherein changes in clay microstructure and polymer conformation were mutually interdependent. The presence of the polymer constrained morphological and microstructural changes in the clay, while the clay within the IPB matrix influenced the conformational changes in the polymer. Overall, the enhanced synergistic clay-polymer interactions imparted by these multiscale mechanisms (Fig. 15), acting either individually or in combination, contributed to the sustained low k of IPBs under aggressive chemical environments.
This study established that IPBs function as chemically resilient barrier materials in waste-containment systems, thereby preventing leachate migration and protecting groundwater resources. Their ability to maintain low k values below regulatory thresholds (1×10⁻⁹ m s–1) even in chemically aggressive environments ensures long-term barrier integrity and provides enduring protection against environmental contamination. By mitigating polymer elution and enhancing durability, IPBs minimize the risk of secondary contamination and extend the service life of landfill liners, while their performance aligns with sustainable waste containment and infrastructure principles. Furthermore, the findings reinforced the importance of tailoring polymer properties in IPBs, thereby ensuring long‑term hydraulic compatibility and enabling the design of sustainable, chemically resilient barrier materials using the proposed mechanistic‑based approaches.
Conclusions
Microstructural insights into IPBs are imperative for understanding their hydraulic behavior and advancing the design of sustainable barrier materials for waste-containment systems. This study investigated the mechanisms governing the low k of IPBs synthesized using an optimized crosslinker‑based polymer formulation through integrated macro- and micro-scale analyses. Key conclusions are as follows:
-
• IPBs consistently exhibited non‑eluting behavior and maintained k values below 1×10⁻⁹ m s–1 during long-term permeation in chemically aggressive environments, confirming their improved chemical compatibility and enhanced barrier resilience.
-
• Incorporating a crosslinker altered polymer properties by forming a stable three-dimensional crosslinked polymer network within the clay matrix. This network immobilized absorbed water, strengthened clay-polymer bonding, restricted polymer mobility, and constituted narrow tortuous flow paths, thereby eliminating elution and ensuring long‑term hydraulic performance.
-
• A mechanistic transition from clay-dominated to polymer-dominated hydraulic behavior was identified at a threshold polymer dosage of ~15%. Beyond this dosage, the crosslinked polymer network progressively governed pore connectivity and masked valence-dependent variability, resulting in chemically resilient hydraulic performance.
-
• Integrated microstructural analyses confirmed that clay–polymer interactions occurred predominantly through surface-level adsorption rather than intercalation and were governed by a dual binding mechanism involving esterification and hydrogen bonding.
-
• Crosslinker-induced synergistic clay–polymer interactions, evidenced by pore-clogging, polymer bridging, and clay surface encapsulation, established a multiscale mechanistic framework responsible for sustained low k in IPBs.
The mechanistic insights provide a scientific basis for engineering barrier materials by tailoring polymer properties, thereby ensuring long-term environmental protection against contamination migration.
Supplementary material
The supplementary material for this article can be found at http://doi.org/10.1017/cmn.2026.10050.
Acknowledgments
None.
Data availability statement
All data generated or analyzed during this study have been included in this article.
Author contributions
S. Keerthana: Conceptualization, Data curation, Formal analysis, Investigation, Methodology, Validation, Visualization, Writing – original draft. Dali Naidu Arnepalli: Supervision, Project administration, Writing – review and editing.
Financial support
This research was supported by the Ministry of Education, Government of India, through the Prime Minister’s Research Fellowship program (no. SB22230194CEPMRF008347). The first author gratefully acknowledges the funding support provided by the Women Leading IITM, IIT Madras, Chennai, India (no. SB24250023CEIITM008347).
Competing interests
The authors declare none.