


Ranching is of great economic importance in Florida, a state ranked 10th nationally in beef cattle production and 18th in total cattle production (USDA NASS 2016). There are approximately 3 million hectares of rangeland in Florida (Nair et al. Reference Nair, Nair, Kalmbacher and Ezenwa2007), and these sites are commonly characterized as acidic, nutrient-poor, and comprised of C4 bunchgrasses (Swain et al. Reference Swain, Boughton, Bohlen and Lollis2013). Improved pastures commonly contain bahiagrass, the most widely utilized forage species in Florida, which covers an estimated 1 million hectares in the state (Chambliss Reference Chambliss1996).
Bahiagrass has a deep, fibrous root system that allows it to persist in dry and infertile soils, requiring little to no irrigation or fertilization (Beard Reference Beard1980; Chambliss Reference Chambliss1996). This perennial C4 species is commonly established via seed, although its seedlings are slow to establish in shaded conditions and can be weak competitors with other species (Beard Reference Beard1980; Busey and Myers Reference Busey and Myers1979). Florida soils are naturally acidic, and nonlimed pastures in the state have been reported to exhibit soil pH as low as 4.3 (Silveira et al. Reference Silveira, Vendramini and Rechcigl2007). The optimum soil pH for bahiagrass is 5.5, although it is able to grow on soils as acidic as pH 4.5 (Newman et al. Reference Newman, Vendramini and Blount2010). Liming to maintain soil pH between 5.5 and 6.5 is recommended for bahiagrass pastures, and low soil pH has been suggested as a mechanism that encourages an increase in weed populations in bahiagrass pastures (Mackowiak et al. Reference Mackowiak, Blount, Myer, Hanlon and Silveira2008; Stephenson and Rechcigl Reference Stephenson and Rechcigl1991). Soil pH can impact competitive ability by altering nutrient availability and affecting soil microflora, and different weed species have shown varied growth responses to pH (Buchanan et al. Reference Buchanan, Hoveland and Harris1975; Magidow et al. Reference Magidow, DiTommaso, Ketterings, Mohler and Milbrath2013; Pierce et al. Reference Pierce, Warren, Mikkelsen and Linker1999). Increasing soil pH has been shown to reduce weed density and increase forage growth in Florida pastures (Stephenson and Rechcigl Reference Stephenson and Rechcigl1991).
Cogongrass has become an increasingly important pest species in Florida’s pastures and rangelands. This perennial, warm-season grass has an extensive rhizome system, which allows it to preclude the establishment of other desirable species (MacDonald Reference MacDonald2004). It thrives in areas of anthropogenic disturbance, where it quickly establishes and spreads via airborne seeds and rhizome segments (Brook Reference Brook1989). Cogongrass is highly competitive, often forming monotypic stands. These stands interfere with growth and yield of desirable species through competition, allelopathy, and physical injury (Eussen Reference Eussen1979).
Cogongrass is common throughout Florida, where it infests several thousand hectares of reclaimed phosphate mines, pine forests, and roadsides (Shilling Reference Shilling1997). It is regularly found in rangeland settings along fence lines and other areas of anthropogenic activity, but until recently it has not been observed within bahiagrass pastures. The absence of cogongrass invasions in pastures may be attributed to one of several causes: 1) limited site disturbance, 2) lack of propagule pressure, or 3) competitive ability of forage species. Studies have demonstrated that bermudagrass [Cynodon dactylon (L.) Pers.] and bahiagrass have shown promise as forage species capable of suppressing cogongrass reinfestation (Gaffney Reference Gaffney1996). Willard and Shilling (Reference Willard and Shilling1990) showed that established bahiagrass has greater competitive ability against cogongrass, particularly when integrated with mowing. Conversely, bahiagrass seedlings were found to be less competitive than cogongrass ramets; however, the effect of soil pH was not reported. Cogongrass is commonly found on soils with pH as low as 4.7, and although both species are able to survive on low-fertility soils, it appears that low soil pH may have a greater impact on bahiagrass than cogongrass (Shilling Reference Shilling1997; Wilcut et al. Reference Wilcut, Dute, Truelove and Davis1988).
Due to cost restrictions, land managers are often forced to forego improvements to soil fertility. Native Florida soils have low pH, and without amendments such as lime they are likely to become progressively more acidic in bahiagrass pastures due to nitrogen fertilizers and untreated manure (Mackowiak et al. Reference Mackowiak, Blount, Myer, Hanlon and Silveira2008; Silveira et al. Reference Silveira, Vendramini and Rechcigl2007). Therefore, the objective of this study was to evaluate competition between bahiagrass seedlings and cogongrass emerging from rhizomes under two levels of soil pH (4.5 and 6.8). We hypothesized that the relative competitiveness of these two species will be altered by soil pH, with cogongrass having greater competitive ability under conditions of lowered pH. If cogongrass is found to have enhanced competitiveness at a particular pH level, it would inform cultural management strategies; soil amendments to raise pH may limit the ability of cogongrass to invade into bahiagrass pastures.
Materials and Methods
A greenhouse experiment was conducted at the University of Florida in Gainesville, FL. Single-node cogongrass rhizome fragments (10 cm in length) were harvested from a population in Gainesville, placed in plastic flats filled with commercial potting mix (Fafard® Super-Fine Germination Mix, Sun Gro© Horticulture Canada Ltd., Agawam, MA), and watered daily. Fertility was maintained at 45.4 kg ha−1 N (Osmocote® 14-14-14, The Scotts Company LLC, Marysville, OH). After 2 wk, plants with two leaves attached to a single node were selected for use in the competition experiment. Bahiagrass seeds (var. saurae Parodi.) (B&G Seed Processors, Inc., Williston, FL) were planted under similar conditions; after 3 wk, two-leaf seedlings of approximately equal size were selected for further use.
Selected plants of both species were transplanted together into 4-liter pots at desired densities and maintained in a greenhouse under a 16-h photoperiod with day/night temperatures of 30/20 C. Soil was a Chandler fine sand, gathered from the University of Florida Plant Science Research and Education Center in Citra, FL. Soil was obtained from adjacent locations, one from an agricultural field that was currently in production, the other from an undisturbed area that had never been in production. This resulted in soils with two pH levels: pH 6.8 from the production field and pH 4.5 from the undisturbed area. Prior to planting the replacement mixtures, the soils were amended with slow-release fertilizer at 45.4 kg ha−1 N (Osmocote 14-14-14) for consistent growth and to negate any differences in base fertility between the two soils. This did not impact soil pH levels.
For each pH treatment, a replacement series model was established to evaluate competition between the two species. Initial cogongrass densities were 0, 1, 2, 4, and 8 shoots per pot, with corresponding bahiagrass densities of 40, 20, 10, 1, and 0 plants per pot, respectively. The resulting proportions were 0:40, 1:20, 2:10, 4:1, and 8:0 for a single pot; these proportions were based on findings by Shilling (Reference Shilling1997). The experiment was a two by five factorial in a completely randomized design, with four replications per treatment (one pot was considered to be one replication). The study was conducted in August and repeated in October of the same year. New soil was obtained for the second experimental run.
Eight weeks after transplanting, aboveground biomass of each species was harvested and oven-dried at 75 C for 72 h to determine dry weight. Competitive indices were based on aboveground biomass per pot. Relative yield (RY) (Equation 1) describes the relative biomass of each species in mixture as a percentage of its monoculture biomass under the same growing conditions (de Wit Reference de Wit1960):
 $$RY_{x} \,{\equals}\,X_{{mix}} /X_{{mono}} ,$$
where RY x is the relative yield of species x, X mix is the biomass of species x in mixture, and X mono is the biomass of species x in monoculture. In contrast, relative yield total (RYT) (Equation 2) expresses the relative biomass of each species within a given proportion (de Wit Reference de Wit1960; de Wit and Van den Bergh Reference de Wit and Van den Bergh1965):
 $$RYT\,{\equals}\,RY_{x} {\plus}RY_{y} ,$$
where RYT is the relative yield total, RY x is the relative yield of species x, and RY y is the relative yield of species y.
Relative crowding coefficient (RCC) (Equation 3) measures the relative competitive ability of one species over another (Cousens and O’Neill Reference Cousens and O’Neill1993; de Wit Reference de Wit1960):
 $$RCC_{x} \,{\equals}\,{\rm }{{(X_{{mix}} /Y_{{mix}} )} \over {(X_{{mono}} /Y_{{mono}} )}}{\rm ,}$$
where X mix and Y mix refer to the respective biomass of species x and y at a particular proportion, while X mono and Y mono refer to their respective biomass in monoculture. RCC is an index: a value of 1.00 indicates equal competitiveness, with RCC increasing with the competitive ability of a species.
Aggressivity (A) (Equation 4) is another index used to measure relative competitive abilities (McGilchrist and Trenbath Reference McGilchrist and Trenbath1971):
 $$A_{x} \,{\equals}\,{\rm }{1 \over 2}{\rm }\left( {{{X_{{mix}} } \over {X_{{mono}} }}{\minus}{{Y_{{mix}} } \over {Y_{{mono}} }}} \right),$$
where X mono and Y mono refer to the mean biomass per plant of species x and y in monoculture, and X mix and Y mix refer to the mean biomass per plant of species x and y in mixture, respectively. A value of 0 denotes equal competitive ability of the two species, while positive values are given to species with greater competitiveness.
All data were subjected to a two-way ANOVA in SAS with mean separation at P<0.05, and a replacement series curve model was created based on RY and RYT for each species grown under the two pH treatments. Data from the two experimental runs were combined because data analysis indicated that there was no interaction between density and experimental run (P≥0.05).
Results and Discussion
A de Wit (Reference de Wit1960) replacement model was used to determine the effects of soil pH on the relative competitiveness of cogongrass ramets and bahiagrass seedlings. Replacement studies are often used to characterize the relative competitiveness of species, particularly under conditions of stress or environmental disturbance (i.e., increased nutrient availability or water stress) (Gao et al. Reference Gao, Wang, Han, Patton and Nyren2005; Griffin et al. Reference Griffin, Shilling, Bennett and Currey1989; Li et al. Reference Li, Suzuki and Hara1999; Santos et al. Reference Santos, Dusky, Stall, Shilling and Bewick1998). Interpretation can be difficult for a replacement series when the species of interest have different growth forms (Radosevich et al. Reference Radosevich, Holt and Ghersa2007). Willard and Shilling (Reference Willard and Shilling1990) noted these concerns in a study comparing cogongrass ramets vs. bahiagrass seeds. However, their data provided a practical platform from which to overlay the impact of pH on the competitive interactions between these two species and have applied value in the context of cogongrass-invaded rangelands. Bahiagrass is commonly established via seed, while cogongrass primarily spreads clonally; thus, this experimental design more accurately portrays a realistic management scenario.
Aboveground Biomass
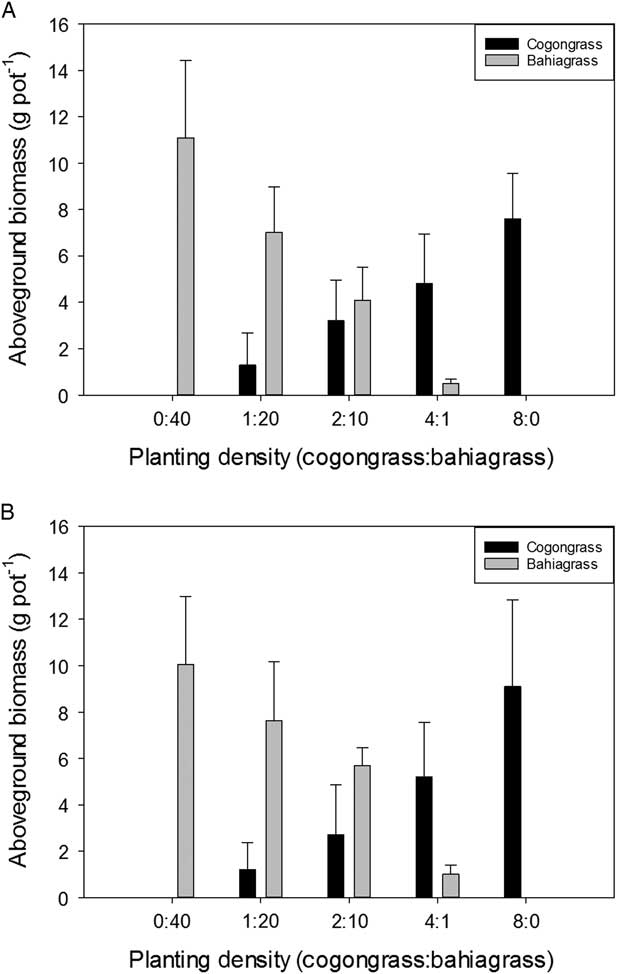
There were no differences in shoot biomass per pot between pH treatments for either species (Figure 1). Cogongrass biomass (Figure 1) per pot increased as its proportion in the mixture increased. A similar trend was observed for bahiagrass (Figure 1). There was a concomitant increase in biomass for both species as the planting density for each species increased. The effect of pH was minimal for cogongrass, with nearly equal amounts of biomass at pH 4.5 and 6.8. However, bahiagrass did show nearly 50% less biomass under pH 4.5 at the 4:1 planting density than it did with the same ratio at the higher soil pH. Under the absence of competition, total aboveground biomass per pot for cogongrass or bahiagrass ranged from 9.5 to 10 g pot−1, indicating the ratios chosen accurately reflected equivalent competitiveness.
Aboveground biomass (g pot−1) for cogongrass ramets and bahiagrass seedlings after 8 wk of competition as a function of (A) low soil pH (4.5) and (B) high soil pH (6.8). Error bars display 95% confidence intervals for eight replications of cogongrass and bahiagrass biomass at each planting density.
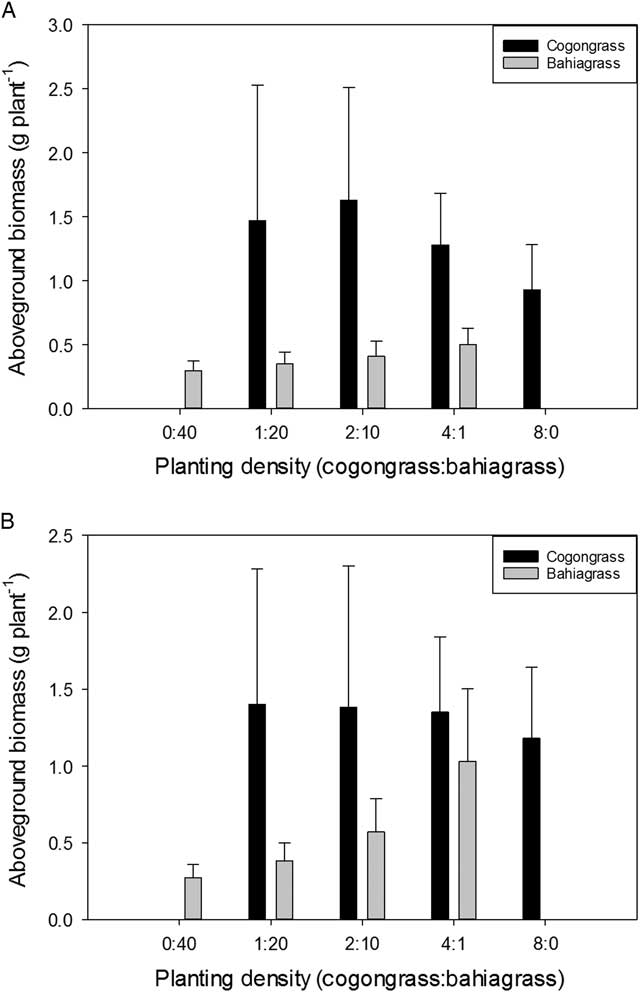
Cogongrass biomass on a per plant basis was minimally impacted by pH and declined at greater densities on an individual plant basis, showing intraspecific competition (Figure 2). However, there were no differences in biomass between pH levels within a given planting density. For bahiagrass, shoot biomass also decreased on an individual plant basis as the proportion of bahiagrass in the mixture increased (Figure 2). There was a significant difference in individual plant biomass between the two pH treatments at the lowest ratio of cogongrass to bahiagrass (4:1). At this proportion, bahiagrass biomass was nearly twice as great when plants were grown at pH 6.8 than they were at pH 4.5. However, there were no differences between pH treatments for any of the other density levels. This increase is directly correlated to effects of pH on bahiagrass alone; there were no impacts on cogongrass biomass at this planting density (Figure 2).
Aboveground biomass (g plant−1) for cogongrass ramets and bahiagrass seedlings after 8 wk of competition as a function of (A) low soil pH (4.5) and (B) high soil pH (6.8). Error bars display 95% confidence intervals for eight replications of cogongrass and bahiagrass biomass at each planting density.
Relative Yield
While pH treatments did not result in many differences in plant biomass, the RY of each species suggests that soil pH may play a role in competition. Cogongrass RY was significantly greater under conditions of low soil pH at the density level of 2:10 (0.42 at pH 4.5 and 0.24 at pH 6.8), although differences were nonsignificant at other density levels (Figure 3). Similarly, bahiagrass had significantly greater RY under high pH conditions for only one density level, 4:1 (0.04 at pH 4.5 and 0.12 at pH 6.8). Relative yield of the two species was almost equal at the 2:10 planting density under low soil pH, indicating similar competitive ability under these conditions; conversely, the RY of cogongrass was half that of bahiagrass at this planting level when soil pH was 6.8.
Relative yield (RY) of aboveground biomass for cogongrass ramets and bahiagrass seedlings, as well as relative yield total (RYT), after 8 wk of competition as a function of (A) low soil pH (4.5) and (B) high soil pH (6.8). Indices were generated using aboveground biomass per pot. RY was calculated using Equation 1, where X mix and X mono , refer to the yields of species x in mixture and monoculture, respectively. RYT was calculated using Equation 2, where RY x and RY y refer to the relative yields of species x and y, respectively. Error bars display 95% confidence intervals for eight replications of cogongrass and bahiagrass RY at each planting density.
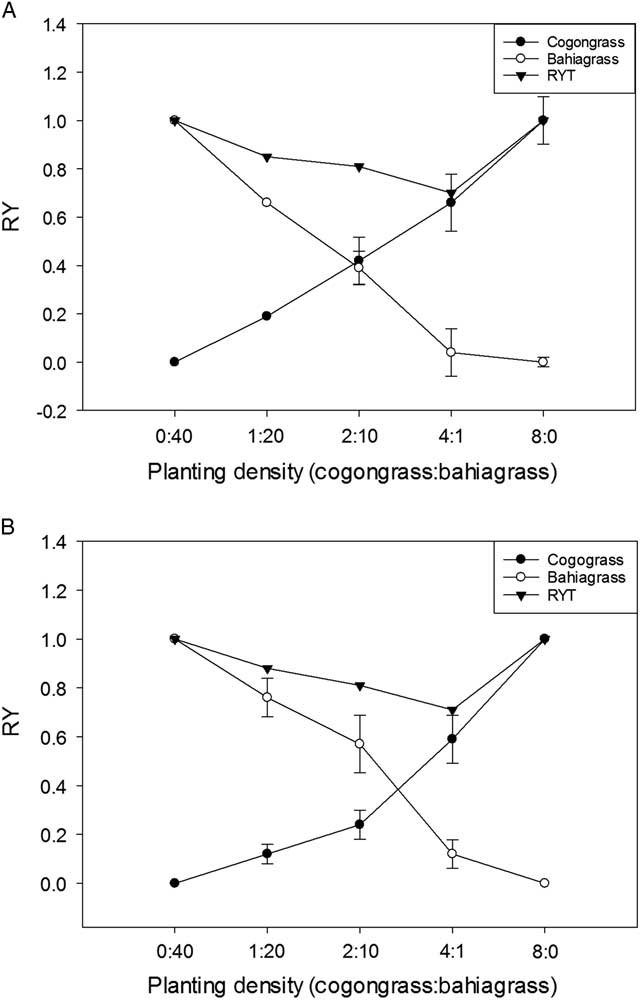
Relative yield of cogongrass under low pH showed a nearly linear increase with increasing density. At a planting density of 2 ramets per pot, RY for cogongrass was 0.42, while that of bahiagrass was 0.39 (Figure 3A). Relative yield for bahiagrass showed a much steeper decline, with a RY of 0.04 at a density of 1 seedling per pot. In the higher pH treatment, an opposite trend was observed; bahiagrass exhibited a more linear increase in RY as planting density increased, while cogongrass RY increased more sharply with planting density (Figure 3B).
These results suggest that bahiagrass is more competitive at pH 6.8 than it is at pH 4.5, because it achieved the same competitive ability as cogongrass with fewer plants under higher pH conditions. This is supported by the species contribution to RYT: cogongrass and bahiagrass contributed similarly to the RYT when soil pH was 4.5, while bahiagrass contributed more when soil pH was 6.8 (Figure 3). This suggests that high pH is more influential on competition between these two species than low pH. Overall, there were few differences in RYT as a function of soil pH, but the mixtures were antagonistic, suggesting an additional negative impact from one or both species.
An advantage of the de Wit experimental design is that it allows for manipulation of environmental variables; replacement series studies elucidate the competitive hierarchies among a set of species, which are often determined by resource gradients or other environmental conditions (Gao et al. Reference Gao, Wang, Han, Patton and Nyren2005; Keddy Reference Keddy1990). Other replacement studies have shown shifts in RY of competing species under varying environmental conditions. Santos et al. (Reference Santos, Dusky, Stall, Shilling and Bewick1998) demonstrated enhanced competitive ability of lettuce (Lactuca sativa L.) with increased phosphorus availability when grown in mixture with smooth pigweed (Amaranthus hybridus L.), as well as enhanced competitive ability of common purslane (Portulaca oleracea L.) in mixtures with lettuce. In addition, Griffin et al. (Reference Griffin, Shilling, Bennett and Currey1989) found that water availability affected the competitive interactions of soybean (Glycine max (L.) Merr.) and Florida beggarweed [Desmodium tortuosum (Sw.) DC.].
Relative Crowding Coefficient and Aggressivity
Bahiagrass had significantly greater RCC values under higher pH at the density levels of 2:10 and 4:1 (Table 1). An RCC of 1.00 indicates that the two species are equally competitive, and RCC increases with increasing competitive ability of a species. Relative crowding coefficient values for bahiagrass were greater than 1.00 for all density levels and pH treatments, while for cogongrass RCC was only greater than 1.00 at the density levels of 1:20 and 2:10 under low pH conditions.
Cogongrass and bahiagrass as measured by relative crowding coefficient (RCC) and aggressivity (A). RCC was calculated using Equation 3, where X mix , X mono , Y mix , and Y mono refer to the yields of species x and y in mixture and monoculture, respectively. A was calculated using Equation 4. Data were based on aboveground biomass per pot and are represented as the mean of eight replications. Mean separation (indicated by letters) is only shown between soil pH treatments within each density level for RCC of cogongrass, RCC of bahiagrass, and A of cogongrass, respectively.
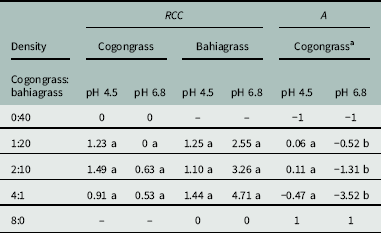
a Bahiagrass aggressivity values are the same as for cogongrass, but with an inverse sign.
This is supported by the aggressivity (A) values, which for cogongrass were negative under pH 6.8 for all density levels (excluding the 8:0 cogongrass monoculture) (Table 1). These negative values indicate that cogongrass was less competitive than bahiagrass under these conditions. Cogongrass had significantly greater A under pH 4.5, and positive values for two of the density levels (1:20 and 2:10). These are the same densities at which cogongrass had an RCC greater than 1.00, further suggesting that the species had greater competitive ability when soil pH was low and intraspecific competition was minimal. For bahiagrass, A values hold the same absolute value as for cogongrass, but with an inverse sign. Aggressivity of bahiagrass was greatest at pH 6.8.
Our data indicate that cogongrass ramets do not show overwhelmingly greater competitive ability than bahiagrass seedlings, a result that is inconsistent with previous research. In their 1990 study, Willard and Shilling evaluated the influence of propagule type on competition between the two species and showed that cogongrass was more competitive than bahiagrass seedlings regardless of planting density. Here, the competitive indices show that cogongrass was less competitive than bahiagrass under pH 6.8 for all density treatments, and even under one of the density levels under lower pH conditions (4:1). The authors of the previous research did not record the soil pH, however, and it is possible that soil conditions may partially account for this inconsistency.
We hypothesized that competitive ability of cogongrass and bahiagrass will be impacted by soil pH, with cogongrass showing stronger competitiveness when soil pH was low. Our results do not support this hypothesis. Cogongrass did not show more competitive ability at pH 4.5 than it did at pH 6.8, and it had a similar level of competitiveness to bahiagrass at the lower pH. Rather, it was bahiagrass competition that was influenced by soil pH: bahiagrass exhibited higher competitive ability at pH 6.8 than it did at pH 4.5. Soil pH has been shown to have differential effects on species in other contexts. In North American fescue prairies, invasive Kentucky bluegrass (Poa pratensis L.) is positively affected by the increased pH of disturbed grasslands, while the native plains rough fescue (Festuca hallii (Vasey) Piper) responds poorly to these conditions (Desserud and Naeth Reference Desserud and Naeth2013). Another study found the growth of large crabgrass (Digitaria sanguinalis (L.) Scop.) to be negatively impacted by high soil pH and raised the possibility of using soil amendments as a management tool (Pierce et al. Reference Pierce, Warren, Mikkelsen and Linker1999).
Bahiagrass pastures can have open areas for a variety of reasons (e.g., periodic flooding, animal disturbance); these open areas are vulnerable to colonization by cogongrass. Low soil pH may exacerbate this vulnerability. While we used bahiagrass seedlings in this experiment, it is likely that mature plants would also show reduced health and competitive ability under acidic soil conditions; this weakness, coupled with the ability of cogongrass to thrive in conditions of low soil pH, may explain the recent cogongrass invasions into bahiagrass pastures. Although bahiagrass seedlings are generally considered weak competitors with cogongrass (Willard and Shilling Reference Willard and Shilling1990), this study has demonstrated that their competitive ability can be enhanced when they are grown under optimal environmental conditions. When combined with amendments to raise the soil pH, reseeding with bahiagrass may be a viable management tool to prevent invasion of cogongrass in Florida grazing lands.
Acknowledgements
The authors would like to acknowledge the Natural Resource Conservation Service for support of this research. They would also like to acknowledge the Center for Aquatic and Invasive Plants. Part of this research was conducted by Jingjing Wang while she was funded by the University of Florida. While every effort has been made to contact Jingjing Wang, she is no longer traceable.



