





Highlights
-
• Recent models postulated that iron oxidation in ancient oceans produced Fe(II)–Fe(III) phases that led to the formation of Banded Iron Formations
-
• We tested whether iron-oxidising phototrophs generate these phases in a Fe(II)-rich environment and found they only produced Fe(III) phases
-
• Our results suggest that Fe(II) oxidation mechanism and local chemical conditions determine the mineral product, not the overall environmental conditions
Introduction
The redox transition between the Fe(II) (ferrous) and Fe(III) (ferric) valence states of iron has been a critical component of global biogeochemical cycling throughout Earth’s history. Microorganisms are now understood to exert major control on iron redox chemistry across a wide range of environments (Kappler and Straub, Reference Kappler and Straub2005). Notably, Fe(II)-oxidising bacteria play a key role in iron cycling in oxic and anoxic waters, soils and sediments (e.g. Lalonde et al., Reference Lalonde, Mucci, Ouellet and Gélinas2012; Bose et al., Reference Bose, Gardel, Vidoudez, Parra and Girguis2014; Melton et al., Reference Melton, Swanner, Behrens, Schmidt and Kappler2014; Camacho et al., Reference Camacho, Walter, Picazo and Zopfi2017; Romanowicz et al., Reference Romanowicz, Crump and Kling2023; Nikeleit et al., Reference Nikeleit, Maisch, Straub, Eroglu, Lopez-Rivoldi, Strauss, Ring-Hrubesh, Byrne, Kappler and Bryce2025). Microbial Fe(II) oxidation is particularly prominent under anoxic and suboxic conditions at circumneutral pH values. Under these conditions, rates of microbial Fe(II) oxidation can rival rates of competing abiotic Fe(II) oxidation by molecular oxygen or by other highly oxidising species. In addition, the redox potential of ferrous iron increases sharply above a pH of 3 because of the formation of ferric (oxyhydr)oxide compounds (Garrels and Christ, Reference Garrels and Christ1965; Stumm and Morgan, Reference Stumm and Morgan1996). At pH 7.0, the Fe(OH)3/Fe2+ (E′0 = –0.236 V) redox couple is more relevant than the standard redox potential of Fe3+/Fe2+ (+0.77 V), allowing Fe(II) to function as an electron donor in various microbial metabolisms (Jørgensen, Reference Jørgensen2000).
The theoretical possibility of biological Fe(II) oxidation in the absence of free oxygen (Garrels et al., Reference Garrels, Perry and Mackenzie1973) was confirmed by the isolation of bacteria capable of using Fe(II) as the sole electron donor for anoxygenic photosynthesis (Widdel et al., Reference Widdel, Schnell, Heising, Ehrenreich, Assmus and Schink1993; Ehrenreich and Widdel, Reference Ehrenreich and Widdel1994). These iron-oxidising phototrophs perform a type of light-dependent Fe(II) oxidation known as photoferrotrophy. In regions of sufficient light intensity, photoferrotrophic bacteria use Fe(II) as an electron source to produce reducing equivalents needed for the assimilation of inorganic carbon (Ehrenreich and Widdel, Reference Ehrenreich and Widdel1994), as shown in the following simplified reaction:

Phototrophic Fe(II) oxidation is an important process by which Fe(III)-bearing precipitates can form in modern anoxic environments (Fortin and Langley, Reference Fortin and Langley2005; Kappler and Straub, Reference Kappler and Straub2005; Weber et al., Reference Weber, Achenbach and Coates2006). This metabolism may have also catalysed the deposition of Fe(III)-bearing minerals from Precambrian oceans (Camacho et al., Reference Camacho, Walter, Picazo and Zopfi2017; Kappler et al., Reference Kappler, Pasquero, Konhauser and Newman2005; Konhauser et al., Reference Konhauser, Hamade, Raiswell, Morris, Grant Ferris, Southam and Canfield2002), generating the prevalent Archean iron- and silica-rich sedimentary deposits known as Banded Iron Formations (BIFs). These BIF deposits suggest an Fe(II)-rich, or ferruginous, water column (Holland, Reference Holland1973; Canfield, Reference Canfield2005; Poulton and Canfield, Reference Poulton and Canfield2011) where photoferrotrophs could have thrived (Garrels et al., Reference Garrels, Perry and Mackenzie1973; Ehrenreich and Widdel, Reference Ehrenreich and Widdel1994; Kappler et al., Reference Kappler and Straub2005; Camacho et al., Reference Camacho, Walter, Picazo and Zopfi2017). However, BIFs are mineralogically complex and have experienced substantial diagenetic and metamorphic overprinting. Even the best-preserved BIFs contain a mixture of iron oxides, silicates, carbonates and sulfides (Trendall, Reference Trendall, Altermann and Corcoran2002; Klein, Reference Klein2005; Bekker et al., Reference Bekker, Planavsky, Krapež, Rasmussen, Hofmann, Slack, Rouxel and Konhauser2014), making it challenging to identify specific minerals as signatures of ancient photoferrotrophy.
Evaluating whether microbial activity could have driven the precipitation of minerals in BIF facies requires a systematic understanding of the identity of Fe minerals formed during phototrophic Fe(II) oxidation. However, the mechanisms of Fe mineral formation during photoferrotrophy under various geochemical conditions remain poorly constrained (Benzerara et al., Reference Benzerara, Miot, Morin, Ona-Nguema, Skouri-Panet and Férard2011; Bryce et al., Reference Bryce, Blackwell, Schmidt, Otte, Huang, Kleindienst, Tomaszewski, Schad, Warter and Peng2018). In particular, it is unknown whether photoautotrophic oxidation of Fe(II) can produce mixed-valent iron minerals thought to be important in the genesis of BIFs, such as magnetite (Sun et al., Reference Sun, Lechte, Shi, Zhou, Zhou, Fang, Xie, Wu and Tang2022), green rust (Halevy et al., Reference Halevy, Alesker, Schuster, Popovitz-Biro and Feldman2017) and iron silicates such as greenalite (Johnson et al., Reference Johnson, Muhling, Cosmidis, Rasmussen and Templeton2018; Rasmussen et al., Reference Rasmussen, Muhling and Krapež2021).
To date, studies characterising the mineral products of photoferrotrophy in anoxic and circumneutral waters have only conclusively demonstrated the primary precipitation of ferric minerals. These experimental phases range from short-range ordered amorphous ferrihydrite (Posth et al., Reference Posth, Huelin, Konhauser and Kappler2010; Gauger et al., Reference Gauger, Byrne, Konhauser, Obst, Crowe and Kappler2016; Schad et al., Reference Schad, Byrne, ThomasArrigo, Kretzschmar, Konhauser and Kappler2022; Zhou et al., Reference Zhou, Templeton and Johnson2024) to more crystalline Fe(III) oxyhydroxides such as lepidocrocite and goethite (Kappler and Newman, Reference Kappler and Newman2004; Posth et al., Reference Posth, Huelin, Konhauser and Kappler2010; Wu et al., Reference Wu, Swanner, Hao, Zeitvogel, Obst, Pan and Kappler2014; Zhou et al., Reference Zhou, Templeton and Johnson2024). It remains an open question why Fe(II)-oxidising phototrophy does not seem to produce mixed-valence Fe minerals, especially because (1) similar experiments utilising abiotic oxidation mechanisms have produced green rust, putative mixed-valence silicates and magnetite (Halevy et al., Reference Halevy, Alesker, Schuster, Popovitz-Biro and Feldman2017; Hinz et al., Reference Hinz, Rossi, Chi and Johnson2023) and (2) a nitrate-reducing Fe(II)-oxidising strain produced green rust as an early phase (Pantke et al., Reference Pantke, Obst, Benzerara, Morin, Ona-Nguema, Dippon and Kappler2012), although the authors suggested that the mechanism probably involved the microbial production of nitrite, which reacted with aqueous Fe(II) to form green rust.
This discrepancy in mineralogy and redox state may arise from the fact that batch experiments with Fe(II)-oxidising bacteria typically proceed until a substantial portion of the initial Fe(II) is oxidised before precipitates are collected and analysed (e.g. Gauger et al., Reference Gauger, Byrne, Konhauser, Obst, Crowe and Kappler2016; Kappler and Newman, Reference Kappler and Newman2004; Schad et al., Reference Schad, Byrne, ThomasArrigo, Kretzschmar, Konhauser and Kappler2022). By this point, the system may favour the formation of ferric rather than mixed-valence Fe minerals, which require the incorporation of structural Fe(II). Consistent with this idea, limited evidence from prior experiments suggests that partially ferrous phases may form while dissolved Fe(II) (henceforth, Fe(II)aq) is still abundant (Kappler and Newman, Reference Kappler and Newman2004; Miot et al., Reference Miot, Benzerara, Morin, Bernard, Beyssac, Larquet, Kappler and Guyot2009). In particular, Kappler and Newman (Reference Kappler and Newman2004) speculated that photoferrotrophy may have produced metastable carbonate green rust based on the green colour of early precipitates formed during the oxidation of siderite (FeCO3). These precipitates turned orange-brown over time, from which they were identified as Fe(III) oxyhydroxides. However, this investigation did not examine the putative mixed-valence phases, leaving uncertainties regarding their nature.
In this study, we conducted batch experiments to characterise the earliest mineral products formed during Fe(II) oxidation by the model photoferrotroph Rhodopseudomonas palustris TIE-1 in the presence of persistent Fe(II)aq. This research had two objectives: (1) to identify the first minerals formed through microbially-mediated siderite oxidation; and (2) to monitor their evolution in a system characterised by continuous oxidation and persistent low-level Fe(II)aq. Our exploration of early mineralisation processes in a siderite-buffered system addresses existing uncertainties and offers insights into the mechanisms governing the formation of biogenic iron minerals.
Methods
Our experimental design was inspired by the approach taken by Kappler and Newman (Reference Kappler and Newman2004), in which photoautotrophic Fe(II)-oxidising bacteria were supplied with 40 mM siderite as a source of Fe(II). A recent study used a similar set-up to investigate whether and how Rhodopseudomonas palustris TIE-1 could grow with 3 mM siderite as a sole source of electrons and carbon (Maisch et al., Reference Maisch, Nikeleit, Lüder, Bryce, Kappler and Byrne2025). Maisch et al. (Reference Maisch, Nikeleit, Lüder, Bryce, Kappler and Byrne2025) determined that TIE-1 could indeed subsist on siderite alone and that cellular contact with siderite enabled extensive siderite dissolution, potentially implying a direct electron transfer mechanism. Our study instead focused on the temporal evolution of mineral products in a Fe(II)-buffered environment established by abundant siderite. Therefore, we provided siderite in high excess (345 mM) relative to this prior work (3–40 mM) to establish a siderite-buffered system capable of sustaining stable levels of Fe(II)aq over an extended period. Similar to Maisch et al. (Reference Maisch, Nikeleit, Lüder, Bryce, Kappler and Byrne2025), and unlike Kappler and Newman (Reference Kappler and Newman2004), we used TIE-1 as our model photoferrotroph to investigate whether photoferrotrophy in an Fe(II)-buffered environment could produce mixed-valence iron phases.
Synthesis and characterisation of the siderite substrate
Pure siderite was synthesised according to the method developed by Koo and Kim (Reference Koo and Kim2020). We followed their synthesis protocol using 100 mM [Fe(II)] and 100 mM [HCO3–] (more details in the Supplementary Material). The aged precipitate was confirmed to be pure siderite using a combination of scanning electron microscopy (SEM), Raman spectroscopy and X-ray diffraction (XRD) before collection and use (Fig. 3; Figs. S1, S2).
At the end of the 36-day aging period, synthetic siderite was pipetted out as a slurry from the bottom of the synthesis bottle and transferred to 1.5 mL sterile Eppendorf tubes using a 2 mL sterile serological pipette. The contents of the Eppendorf tubes were centrifuged in an anaerobic chamber at 2000 × g in successive rounds until most solid material had been removed from the bottle and each Eppendorf tube contained roughly 0.5 mL of pelleted precipitate.
Bacterial strain and cultivation conditions
Experiments were performed with Rhodopseudomonas palustris TIE-1, a Gram-negative α-proteobacterium capable of photoautotrophic growth using Fe(II) as an electron donor (Jiao et al., Reference Jiao, Kappler, Croal and Newman2005; Jiao and Newman, Reference Jiao and Newman2007). TIE-1 was cultivated in freshwater mineral medium prepared after Ehrenreich and Widdel (Reference Ehrenreich and Widdel1994). After assessing the effect of lowering phosphate (Supplementary Material, Fig. S3), we modified the experimental medium to contain only 10 μM phosphate rather than the usual 3.67 mM. We used lower levels of phosphate than typical for microbial cultivation to minimise inadvertent precipitation of iron phosphates such as vivianite. This modification required replacing the KH2PO4 reagent usually used in this freshwater mineral medium with KCl to create a phosphate-free starting solution.
To prepare the low-phosphate freshwater medium, the following salts were degassed in the anaerobic chamber for 48 h and then dissolved in 1 L of anoxic, sterile ultrapure water: 0.05 g of NH4Cl, 0.07 g of KCl, 0.4 g of MgCl2 × 6H2O and 0.1 g of CaCl2 × 2H2O. After all basal salts were dissolved, the medium was autoclaved and degassed with N2. Inside the glovebox, it was further amended with 10 mM NaHCO3 to serve as a carbon source and inorganic buffer, 1 mL L–1 SL-10 trace minerals (Pfennig and Trüper, Reference Pfennig and Trüper1981; Widdel and Bak, Reference Widdel and Bak1992) and 1 mL L–1 sulfate-reducing bacteria (SRB) vitamin solution (Widdel and Bak, Reference Widdel and Bak1992). A bicarbonate concentration of 10 mM was chosen to reflect predictions for Archean ocean chemistry (Halevy and Bachan, Reference Halevy and Bachan2017) while also remaining conducive to siderite dissolution (Maisch et al., Reference Maisch, Nikeleit, Lüder, Bryce, Kappler and Byrne2025). Finally, KH2PO4 was added to a final concentration of 10 μM from a separate autoclave-sterilised 1 mM KH2PO4 stock solution. The pH of the complete medium was measured using an Orion Star A221 Portable pH meter and adjusted to 7.0 using 3 N HCl, similar to the pH of 6.8 used by Kappler and Newman (Reference Kappler and Newman2004) and Maisch et al. (Reference Maisch, Nikeleit, Lüder, Bryce, Kappler and Byrne2025). This pH should have maintained the added bicarbonate predominantly in its dissolved bicarbonate form.
Experimental setup and precipitate collection
Equal 100 mL volumes of complete experimental medium were transferred into each of four sterile 100 mL borosilicate glass bottles, with three bottles designated as experimental triplicates to be inoculated with TIE-1 and the last serving as an abiotic control. Each bottle received roughly 4 g (dry weight) of synthetic siderite, corresponding to 345 mM siderite per 100 mL bottle. Siderite was allowed to equilibrate with the experimental medium for 24 h following Kapper and Newman (Reference Kappler and Newman2004).
After the 24 h equilibration period, three bottles were inoculated with TIE-1 from a log-phase culture growing photoautotrophically in low-phosphate freshwater medium with hydrogen as the electron donor (95:5 N2/H2 headspace). Experimental triplicates were inoculated to a starting optical density at 600 nm (OD600) of 0.005, calculated from the parent culture’s OD. Triplicate inoculated samples and the abiotic control were sealed using sterile butyl stoppers and threaded caps to maintain anoxic conditions prior to removal from the anaerobic chamber. These bottles were then transferred into a lightbox incubator at room temperature (25°C) with NexLux white light LEDs to facilitate photoautotrophic growth of R. palustris with Fe(II) as the sole electron donor (no headspace H2) and 10 mM bicarbonate as the carbon source.
Inoculated cultures grew pink and turbid every 4–5 days (Fig. S4), upon which 90 mL of the overlying solution in each bottle was pipetted out in the glovebox and replaced with an equivalent volume of new low-phosphate freshwater medium. The residual 10 mL of media served as an inoculum of R. palustris and possibly also contained dead cells. Because siderite-derived Fe(II) was in excess relative to phosphorus and other trace elements and vitamins, replenishing these limiting nutrients helped promote continued cell growth and Fe(II) oxidation. Refreshing the medium also had the effect of periodically resetting the pH back to 7.0, as the pH of inoculated samples tended to rise and stabilise around 7.3.
Subsamples of solid precipitates from each bottle were collected in the anaerobic chamber at 3, 6, 10, 14, 18, 28 and 32 days after initiating the experiment. Precipitates were allowed to settle to the bottom of each bottle and small subsamples were carefully pipetted out, centrifuged at 2000 × g in sterile Eppendorf tubes and rinsed five times with sterile, anoxic ultrapure water to remove trace salts before mineralogical characterisation. A subsample of fresh precipitate was also prepared for SEM analysis (see details below) at each timepoint. The remaining rinsed samples were dried in the glovebox and stored as dry pellets in Eppendorf tubes, which were individually sealed in Mylar bags under an N2 atmosphere and transferred into a −80°C freezer for preservation until analysis.
Solution characterisation
The spectrophotometric ferrozine assay (Stookey, Reference Stookey1970; Viollier et al., Reference Viollier, Inglett, Hunter, Roychoudhury and Van Cappellen2000) was used to measure aqueous Fe redox speciation immediately before inoculation (i.e. after the 24 h siderite-medium equilibration period) as well as periodically throughout the experiment. Routine ferrozine analyses were performed in parallel with the collection of solid precipitates at 3, 6, 10, 14, 18, 28 and 32 days after inoculation. All experimental bottles were temporarily brought back into the anaerobic chamber for measurements of solution chemistry. For analysis of aqueous Fe redox speciation, 0.5 mL of experimental medium was withdrawn from each bottle in the anaerobic chamber with a sterile pipette. These aliquots were centrifuged at 2000 × g to remove particulate matter before filtering the supernatant through a 0.22 μm pore size PTFE membrane filter. Volumes of 90 μL of filtered experimental solutions were stabilised in 810 μL of anoxic 0.5 N HCl prior to performing the ferrozine assay, corresponding to a dilution factor of 10×. Fe(II)aq and total dissolved Fe were quantified at 562 nm (Genesys 50 UV–Vis spectrophotometer; Thermo Fisher), while Fe(III)aq was inferred from the difference of these measurements. Absorbance values were converted to Fe concentrations using a Fe standard curve generated in an acidified low-phosphate freshwater mineral medium (i.e. matrix-matched calibration).
Precipitate characterisation
Relative Fe(II) and Fe(III) contents of solid products
The ferrozine assay was also performed on subsamples of experimental precipitates to determine bulk iron redox speciation of the solid phase. Small volumes of precipitate slurry were transferred to fresh Eppendorf tubes after their final rinse with deoxygenated water and acidified with anoxic 3 N HCl for 12 h, following Braunschweig et al. (Reference Braunschweig, Bosch, Heister, Kuebeck and Meckenstock2012). The acidification step was performed in an anoxic chamber to prevent the rapid abiotic oxidation of Fe(II) in air. The solution generated by the acid digestion was then passed through a 0.22 μm pore size filter and diluted 50-fold in anoxic 0.5 N HCl before performing the ferrozine assay on the benchtop. To describe the Fe redox properties of experimental precipitates, we used FeTsolid to signify the total iron measured in these solids and Fe(II)/FeTsolid and Fe(III)/FeTsolid to describe the relative contributions of Fe(II) and Fe(III), respectively. As sample masses varied, these measurements represent proportional amounts of Fe(II) and Fe(III) within precipitates rather than absolute quantities.
Raman spectroscopy
We applied Raman spectroscopy to our synthetic siderite substrate and experimental precipitates harvested at the end of the 32 day experiment. To ensure that samples remained anoxic during analysis, precipitate slurries were prepared in the glovebox and sealed between a glass slide and cover slip by applying a layer of epoxy around the perimeter of the cover slip. Raman microspectroscopy measurements were performed on a Horiba XploRA PLUS Raman system, with spectra collected at ambient conditions using a laser excitation wavelength of 532 nm. We compared our Raman spectra to iron carbonate reference standards, obtaining a close fit to the spectrum of a reference siderite retrieved from the RRUFF database (RRUFF R040034; Lafuente et al., Reference Lafuente, Downs, Yang, Stone, Armbruster and Danisi2015).
Powder X-ray diffraction
Powder X-ray diffraction analyses were conducted on synthetic siderite as an additional verification of initial mineralogy, as well as on a precipitate sample collected at the end of the experiment. Samples were deposited as a slurry on glass slides and dried inside the glovebox. Sample slides were subsequently sealed under N2 inside an airtight container to minimise exposure to atmospheric oxygen during delivery to the XRD facility. Powder XRD measurements were performed using a Rigaku Ultima IV diffractometer with a scintillation detector equipped with a Cu Kα source. Data were recorded in continuous-scan mode over a 5–70°2θ range with 0.02° steps and a counting time of 2 h per sample (roughly 0.5° min–1). Diffraction patterns were compared against reference diffractograms of common iron mineral standards obtained from the RRUFF database (Lafuente et al, Reference Lafuente, Downs, Yang, Stone, Armbruster and Danisi2015).
Scanning electron microscopy
Solid products from all seven timepoints (3, 6, 10, 14, 18, 28 and 32 days) were further characterised using SEM. For SEM analyses, most samples were analysed directly immediately after collection. Rinsed and centrifuged precipitates were resuspended in deoxygenated ultrapure water and dispensed in 15 μL droplets onto carbon tape adhered to aluminium specimen mounts. After drying in the glovebox, samples were transported to a Denton Desk II vacuum coater under N2. After unsealing, samples were immediately sputtered with Au for 90 s to generate a 30 nm conductive film. Secondary electron images of mineral precipitates and accompanying R. palustris cells were collected using a JEOL JSM-7800FVL SEM system operating at an accelerating voltage of 10 kV and a working distance of 10 mm.
X-ray absorption spectroscopy
Microscale X-ray absorption spectroscopy (XAS) analyses at the Fe K-edge were performed on precipitates harvested from inoculated bottles on day 28 to determine the redox state and mineralogy of Fe-bearing phases following partial oxidation of the initial siderite substrate. We chose this late-stage day to assess the secondary phase(s) in our experiments due to the greater abundance and thus easier detection of secondary minerals; earlier experimental samples only had rare occurrences of mineral(s) other than siderite.
Samples for synchrotron XAS measurements were prepared in the glovebox under anoxic conditions (O2 < 0.1 ppm). Precipitate pellets from day 28 were brought into the glovebox and thawed. Thawed pellets were resuspended in deoxygenated, sterile ultrahigh purity water to create a concentrated slurry. Around 100 μL of this slurry was pipetted onto pre-cut 2 × 2 cm squares of Whatman Nucleopore track-etch membrane filters (0.2 μm pore size), which had been pre-mounted onto slightly larger squares of 3 mil (76 μm) thick Mylar Type A film tape with 3M 9471LE acrylic adhesive. The precipitate slurry was allowed to dry completely on the membrane filter squares, forming a faintly green sandy powder. The precipitate powder was then sealed with an overlying 1 × 1 inch layer of Mylar thin film (6 μm thickness; Cole-Parmer Spex 3517, Item #04575-99). Precipitate packets were stored inside heat-sealed Mylar pouches, and all pouches were subsequently sealed in a Mason jar before removal from the glovebox to maintain anoxic conditions during transport to the synchrotron.
X-ray absorption near-edge structure (XANES) spectra and microscale X-ray fluorescence (XRF) maps were collected at the Fe K-edge in fluorescence mode on beamline 2–3 at the Stanford Synchrotron Radiation Lightsource (Menlo Park, CA, USA). Experimental samples were mounted into a custom three-dimensional-printed sample holder in an on-site anaerobic chamber (99.9% Ar atmosphere). The sample holder was equipped with a nozzle to flush in a constant stream of N2 gas while mounted on the beamline to minimise exposure of the sample to oxygen. All analyses were conducted at room temperature.
Iron speciation maps were produced using X-ray spectroscopic imaging. This technique combines microscale X-ray spectroscopy with microscale X-ray fluorescence mapping at multiple energies to create phase maps showing the redox speciation of a designated element (e.g. Mayhew et al., Reference Mayhew, Webb and Templeton2011). The X-ray microprobe at beamline 2–3 had a beam spot size of approximately 1 × 1 μm, which was rastered across target areas. Incident beam energies were adjusted using a double crystal Si(111) monochromator with a pixel dwell time of 25 ms. Fluorescence data were collected using a Vortex silicon drift detector. For all measurements made on this beamline, energy was calibrated by setting the first inflection point of the Fe K-edge XANES spectrum of a reference Fe(0) foil to 7112.0 eV. The reference Fe(0) foil was recorded simultaneously with all samples.
The distribution of Fe(II) and Fe(III) in the sample was mapped using stacks of images collected at six discrete energies (7124.0, 7126.3, 7128.0, 7132.0, 7134.0 and 7137.65 eV). These energies were chosen to maximise differences in normalised intensity between micro-XANES analyses. We performed principal component analysis (PCA) on these energy maps using Sam’s Microanalysis Analysis Toolkit (SMAK version 3.09) (Webb et al., Reference Webb, McNulty, Eyberger and Lai2011) to identify endmember regions with contrasting Fe speciation signals and collected full XANES spectra at those identified locations. X-ray absorption near-edge structure spectra were collected on the same beamline across a 7110–7150 eV energy range. Three spectra were collected at each point of interest and averaged to improve the signal-to-noise ratio.
XAS data analysis
All XANES spectra were background-subtracted and normalised using Sam’s Interface for XAS Package (SIXPack) (Webb, Reference Webb2005). PCA was applied to normalised XANES spectra to determine the number of components necessary to explain the variation within the dataset, following previously published methods (Fay et al., Reference Fay, Proctor, Hoffmann, Houalla and Hercules1992; Wasserman, Reference Wasserman1997). The PCA module of the SIXPack software was also used to identify endmembers within the set of sample spectra. Spectral endmembers refer to the spectra that are the most different from one another; when combined, the endmembers describe all the variation in the dataset (Bateson and Curtiss, Reference Bateson and Curtiss1996).
In this dataset, spectral endmembers correspond to either the most reduced (i.e. siderite-like) regions of the sample or the regions containing the highest abundance of oxidised Fe phases. The most siderite-like spectral endmember was fit to a reference siderite spectrum to verify its composition; this endmember was subsequently designated as an internal siderite standard for use in future fitting analyses. The most oxidised endmembers were fit to linear combinations of reference spectra using the non-negative least-squares fitting function in the SIXPack Least Squares Fitting module. Fits for this oxidised endmember were generated using combinations of the internal siderite standard and other model compounds, following Webb (Reference Webb2005) and Johnson et al. (Reference Johnson, Savalia, Davis, Kocar, Webb, Nealson and Fischer2016). Solution geochemical constraints were used to identify plausible model compounds for the fitting analyses, which included vivianite, magnetite, green rust sulfate, ferrihydrite, lepidocrocite and goethite. Reference spectra for these compounds were obtained from Mayhew et al. (Reference Mayhew, Webb and Templeton2011) and Cosmidis et al. (Reference Cosmidis, Benzerara, Morin, Busigny, Lebeau, Jézéquel, Noël, Dublet and Othmane2014). We used sulfate green rust as a model compound because we lacked a high-quality reference spectrum for carbonate green rust, the variant likely to form in our carbonate-buffered and sulfate-free medium. However, the XANES spectra of these two green rust variants are nearly identical (O’Day et al., Reference O’Day, Rivera, Root and Carroll2004). We additionally fit the two oxidised endmember spectra with internal siderite and each model compound individually to generate a combination fit with a statistical measure of goodness-of-fit via the χ 2 values and r-factors reported by the SIXpack software.
Multiple-energy XRF maps were processed using SMAK. Fe K-edge multiple energy maps were fit to normalised fluorescence values for the siderite-like endmember and the most oxidised endmember. Processed data were displayed as composite maps with the blue channel representing regions consistent with internal siderite and the red channel representing regions with a similar mineralogical composition as the ferric endmember.
Results
Solution and precipitate chemistry
We determined the Fe concentrations and redox speciation of our experimental solutions and precipitates (Figs. 1, 2). The ferrozine assay was first performed on an acidified subsample of our synthetic siderite, confirming that the material was predominantly ferrous with >97% Fe(II) (Fig. 2). We then assessed the amount of Fe(II)aq and Fe(III)aq that had accumulated in solution after the equilibration period and immediately before inoculation (Fig. 1; Table S1). Initial Fe(II)aq varied from 58 to 220 μM across the experimental bottles. This lack of consistency may indicate that our experimental system had not yet reached solubility equilibrium with respect to siderite.
Ferrozine measurements of Fe(II)aq in inoculated bottles and an abiotic control throughout the course of the experiment. See Table S1 for underlying data, including values of Fe(III)aq.

Figure 1. Long description
The concentration of Fe(II)aq (uM) on the y-axis and time elapsed (days, or d) on the x-axis, spanning from 0 to 35 days. The graph compares four experimental conditions: a Control (black line with open square markers) and three replicates labeled Bottle #1 (light blue), Bottle #2 (medium blue), and Bottle #3 (dark blue), all using solid circular markers. From Day 0-3, the values vary significantly, varying from ~60 uM to ~235 uM. Bottles #2 and #3 drop dramatically at Day 6 to ~20 uM, while the control and Bottle #1 lower slightly. By Day 10, all lines converge round 60 uM (between 45 uM and 70 uM) and remain at ~60 uM for the remainder of the 32-day experiment. Underlying data in Table S1.
Iron redox speciation of synthetic siderite (Sid) and experimental precipitates collected and acidified 3 and 32 days after inducing oxidation by the addition of the anoxygenic photoferrotroph Rhodopseudomonas palustris TIE-1. Data shown in each bar are average proportions of Fe(II)/FeTsolid and Fe(III)/FeTsolid from triplicate pellets ± standard deviations. C = abiotic control; B# = Bottle #.

Figure 2. Long description
A stacked horizontal bar chart, showing the relative abundance (in percentage) of Fe(II) and Fe(III). The synthetic siderite (‘Sid’) and two control (‘C’) conditions have 3-4% Fe(III), the Bottle #1,2,3 start conditions have 2-4% Fe(III), and the Bottle #1,2,3 conditions have 6% Fe(III). Also see data in Table S1.
Concentrations of Fe(II)aq and Fe(III)aq were determined for all inoculated and abiotic control solutions at multiple timepoints throughout the 32 day experiment. Fe(II)aq fluctuated between 20 and 200 μM until 7 days after inoculation in both the inoculated and abiotic control treatments (Fig. 1). After this point, Fe(II)aq concentrations stabilised around 60 μM in the three inoculated bottles as well as in the abiotic control for the remainder of the experiment. Fe(II)aq in inoculated bottles was on average slightly lower than in the abiotic control from days 6 to 14, but concentrations eventually converged to similar values across all samples. Fe(III)aq was present in much lower concentrations, reflecting the insolubility of this species at circumneutral pH (Table S1).
Ferrozine analyses were also performed on acidified subsamples of experimental precipitates to track solid-phase Fe redox speciation over time. Precipitates harvested from the abiotic control sample at days 3 and 32 matched the Fe(III)/FeTsolid ratio of the starting siderite (Fig. 2; Table S2). Our analyses indicated that the relative abundance of Fe(III) increased slightly in samples inoculated with TIE-1. In these samples, Fe(III)/FeTsolid rose from an average of 3% at the start of the experiment to 6% at 32 days, demonstrating that only a small percentage of the total Fe(II) in the system was oxidised (Fig. 2). However, this increase of ~3% in 32 day inoculated bottles relative to the initial inoculated Fe(III)/FeTsolid was statistically robust, generating a T-test (paired, one tail) p value of 0.014 and suggesting that TIE-1 drove an increase in Fe(III) over the course of the experiment.
Characterisation of Fe minerals formed by R. palustris TIE-1
Raman spectroscopy
No changes were observed in the Raman spectrum of our synthesised siderite retrieved from the abiotic control sample 32 days after the start of the experiment, indicating that siderite is stable in our experimental medium (Fig. S1). Raman spectra of end-member precipitates collected from inoculated bottles included the characteristic intense siderite band (ν1) at 1087 cm–1, which corresponds to the symmetric stretching of the CO3 group (Buzgar and Apopei, Reference Buzgar and Apopei2009). Several peaks unique to the inoculated samples were also observed at 1005, 1150 and 1509 cm–1 (Fig. S1).
X-ray diffraction
Powder XRD profiles of synthetic siderite and experimental endpoint samples corroborated Raman analyses, demonstrating that even the endpoint samples were essentially all siderite. The most intense peak in the XRD pattern was observed at 2θ = 32.1°, consistent with the 2.78 Å spacing of siderite (Fig. S2). No new spectral features were seen in the inoculated sample, indicating that phases produced by microbial Fe(II) oxidation only formed in minor quantities or were X-ray amorphous.
Scanning electron microscopy
Scanning electron microscopy observations showed that the synthetic siderite typically occurred in framboids, with roughly spherical aggregates ranging between 5 and 10 μm in diameter (Fig. 3a,b). These aggregates were formed of discrete submicron euhedral microcrystallites with edge angles of 120°. Larger isolated rhombohedral crystals (2–5 μm) were also occasionally observed (Fig. 3). Both crystal morphologies matched descriptions of siderite presented by Koo and Kim (Reference Koo and Kim2020), whose synthesis procedure we followed, and are also consistent with morphological observations from other studies (Jimenez-Lopez and Romanek, Reference Jimenez-Lopez and Romanek2004; Wiesli et al., Reference Wiesli, Beard and Johnson2004). In the absence of biological activity, the morphology of synthetic siderite did not change over 32 days in our low-phosphate freshwater medium (Fig. 3).
Scanning electron microscopy (SEM) images of synthetic siderite with characteristic framboidal and trigonal-rhombohedral morphology. (a, b) Two representative images of the synthetic siderite used in this experiment, which was collected and imaged immediately after the 36 day anoxic aging period. No changes in mineral morphology were observed in precipitates collected from the abiotic control sample (c) 3 days after initiating the experiment and (d) 32 days after initiating the experiment.

Figure 3. Long description
A four-panel grid of Scanning Electron Microscope (SEM) images showing the microstructure of synthetic siderite crystals at different stages, with a 5-micrometer scale bar in the bottom-left corner of each panel.
Panel (a) Synth. siderite: Shows a cluster of spherical, textured aggregates composed of tightly packed, tiny rhombohedral microcrystals. A few isolated, larger cubic/rhombohedral crystals are scattered on the surface.
Panel (b) Synth. siderite: A closer view of similar spherical aggregates, highlighting thefaceted texture created by the tiny rhombohedral crystal subunits.
Panel (c) Control Day 3: Displays similar spherical clusters mixed with larger, more distinct, smooth-faced rhombohedral crystals growing adjacent to them.
Panel (d) Control Day 32: Shows a dense accumulation of the clusters with individual rhombohedral sub-crystals comprising the spheres.
Scanning electron microscopy analyses were also used to track the temporal evolution of mineralogy. In contrast to the abiotic control, trace amounts of novel minerals were observed in samples inoculated with TIE-1, although siderite remained the dominant phase in all samples (Fig. 4; Fig. S5). The first clearly distinct new mineralogical features appeared in SEM images from our second timepoint 6 days after inoculation; we interpret these to be the products of microbial iron oxidation. These phases consisted of annealed, doubly terminated acicular crystals that were typically arranged in submicron clusters reminiscent of six-pointed stars (Fig. 4b,d,e,f,g,i; Fig. S5). These laths and star-shaped clusters were usually found near cells (e.g. Fig. 4b) and seemed to adhere to the surfaces of siderite rhombohedra. In rare cases, acicular crystals were also observed growing directly out of siderite dissolution pits (Fig. 4f). Although laths and star-shaped clusters were the most common feature observed in addition to siderite, these phases remained small and scarce, representing no more than an estimated 3% of the total precipitate volume by the end of the experiment.
Scanning electron microscopy (SEM) images of minerals formed following Fe(II) oxidation by R. palustris TIE-1 in a siderite-buffered system, with panels labelled by time. (a) Framboidal siderite spherules around 10 μm in diameter remained the dominant phase throughout the experiment, with rare secondary phases first observed 6 days after inoculation (boxed region). (b) A closer view of the selected area reveals the distinctive star-shaped morphology of trace secondary phases (white ‘S’ arrow). These phases were typically found near intact R. palustris cells (pink arrows). (c) Platelets began to appear as a rarer additional phase by day 10 (white ‘P’ arrow). (d) Submicron star-shaped phases were typically associated with the surfaces of siderite rhombohedra. (e–i) As the experiment progressed, ongoing Fe(II) oxidation resulted in laths, star-shaped aggregates and platelets that typically formed in rosettes or disordered stacks. Panel (h) highlights that the secondary phases were still rare, even by day 32, compared to the abundant siderite cubes.

Figure 4. Long description
(a) Day 6: Large, spherical clusters of cubic crystals agglomerated together. A white box outlines a region detailed in the next panel.
(b) Day 6: A high-magnification view of the boxed area in (a). Smooth, sheet-like cellular structures cover parts of rhombohedral (cube-like) crystal faces. Pink arrows point to thecells, and a white arrow labeled “S” points to a small, star-shaped crystal cluster emerging near the cells.
(c) Day 10: Rhombohedral crystals intermixed with delicate plate-like aggregates. A white arrow labeled “P” points to these thin, interlocking mineral plates.
(d) Day 18: A dense cluster of well-defined, rhombohedral crystals covered in places by distinct, star-shaped mineral formations.
(e) Day 18: Spherical aggregates of cubic crystals with small rosette clusters, plates, and small star-like aggregates emerging. Intermixed with these minerals are long floppy cellular remains.
(f) Day 18: A close-up of a large, smooth rhombohedral crystal face. At the cube’s edge, a smaller, star-shaped crystal aggregate is growing directly out of an indented, textured patch of the cube.
(g) Day 21: Aggregates dominated by a cluster of thin, overlapping plates, many star-like aggregates, and, in the background and on the right side, an aggreagte of the cubic crystals.
(h) Day 32: A perfect single sphere densely covered on its outer surface with small, distinct rhombohedral crystal blocks. Interspersed are a few star-like clusters of lath forms.
(i) Day 32: A mixture showing smooth, larger rhombohedral crystals sitting alongside clusters of highly intricate, needle- and plate-like rosette formations and clusters of laths in a dark gray background with a couple cell-like shapes.
Over time, the most noticeable change was that the abundance of star-shaped clusters increased. However, the morphology and size of laths and stars remained constant. Other mineral morphologies appeared in even lesser quantities starting at day 10, and these later-forming phases also became more abundant with time. These included thin platelets (Fig. 4c,e,g,i) and more developed flower-like rosettes of plates (Fig. 4e,i; Fig. S5). Because of their rarity and delayed appearance, these phases are probably transformation products of the initial minerals produced by photoferrotrophy. However, the extremely low abundance of these plate-like phases may have rendered them invisible to the analytical techniques applied in this experiment.
X-ray absorption spectroscopy
Different Fe-bearing minerals can have unique spectral fingerprints that are determined by the oxidation state and local coordination environment of Fe atoms. Fig. S6 displays normalised Fe K-edge XANES spectra for various geochemically plausible model compounds from Mayhew et al. (Reference Mayhew, Webb and Templeton2011) and Cosmidis et al. (Reference Cosmidis, Benzerara, Morin, Busigny, Lebeau, Jézéquel, Noël, Dublet and Othmane2014). These reference compounds demonstrate the well-documented observation that the absorption edge energy increases as the average oxidation state of the absorbing atom (Fe) increases (Shulman et al., Reference Shulman, Yafet, Eisenberger and Blumberg1976). Spectral deconvolution techniques provide a means to assess the oxidation state and mineralogy of a mixture of iron-containing compounds.
Most spectra obtained from the day 28 sample were a close match to the reference siderite spectrum alone (Fig. 5a). The most oxidised endmember spectrum had the most pronounced shift to higher absorption edge energy, indicating that the spectrum was obtained from a sample region containing the greatest concentration of ferric iron. To determine which candidate mineral(s) could best explain the ferric signature, this oxidised endmember and the next-most-oxidised point spectrum were fit by linear combination fitting with multiple standards (green rust, magnetite, ferrihydrite, lepidocrocite, goethite, vivianite, internal siderite) as well as in binary combinations of an internal siderite spectrum and each reference compound. Linear combination fitting to minimised residuals identified ferrihydrite as the sole secondary phase besides siderite, with the siderite–ferrihydrite combination yielding the best statistical fit (indicated by the lowest χ² values and r-factors; Table S3). The most oxidised end-member spectrum was best described as a mixture of 38% ferrihydrite and 62% siderite (Fig. 5a; Fig. S7, Table S3). However, the morphological characteristics of the secondary phase are inconsistent with ferrihydrite, which we address further in the Discussion.
X-ray absorption near-edge structure (XANES) spectra, least-squares fits and Fe speciation map of ferric hotspots from a sample collected 28 days after inoculation. (a) Non-negative least-squares fits of the Fe K-XANES spectra of endmember experimental samples. Point spectra were collected either from a siderite-dominated region (‘Siderite-like endmember’) or a region with an appreciable ferric component (‘Oxidised points’). Fits to reference compounds are shown in black lines overlying coloured sample spectra (corrected for self-absorption). (b) Multiple-energy micro-XRF Fe speciation map fit to the two endmember spectra presented in the panel above. The blue channel represents regions consistent with siderite, while the magenta channel represents areas similar in composition to the oxidised endmember. Sid = siderite; Fh = ferrihydrite.

Figure 5. Long description
(a) A stacked line plot showing Normalized Absorbance on the y-axis against Energy in electronvolts (eV) on the x-axis, ranging from 7110 to 7150 eV. Three sets of spectra are vertically offset for comparison:
Top Set: “Oxidized point (pt3)” in pink text, displays a bumpy, pink experimental line overlaid with a smooth, black fitted curve ‘12% Fh, 88% Sid’ showing a broad double peak between 7125 and 7140 eV.
Middle Set: “Oxidized point (pt4)” in pink text shows a similar pink experimental line and a smooth, black fitted curve ‘38% Fh, 62% Sid’ with the second peak larger than the other two spectral sets.
Bottom Set: A blue curve is labeled “Siderite-like endmember” and a black curve is labeled “Siderite standard”. Both exhibit a strong, sharp absorption peak at approximately 7126 eV followed by a secondary peak near 7137 eV.
(b) A rectangular chemical map at the microscale (100 uM scale bar). The color scale bar transitions smoothly from dark blue at the bottom, labeled Fe(II), to bright magenta/pink at the top, labeled Fe(III). The map is heavily dominated by dark blue and medium blue mottled regions, indicating a prevalence of Fe(II) (siderite-like phases). Small, isolated patches of bright pink and magenta are scattered sparsely throughout, highlighting localized areas of oxidized Fe(III) (ferrihydrite-like phases).
We fit multiple-energy map data to internal reduced (siderite-like) and oxidised endmembers, which resolved the spatial distribution of siderite and Fe(III)-bearing minerals throughout the most ferric region of the sample (Fig. 5b). Fe(II)/Fe(III) XANES fitting revealed that most particles in the sample are consistent with the siderite-like endmember, whereas Fe(III)-rich phases are scarce within the siderite substrate. These results are in agreement with SEM analyses of corresponding samples, which showed that minerals produced by Fe(II) oxidation were present in small and unevenly distributed clusters (Fig. 4; Fig. S5).
Discussion
This study characterised the minerals produced when the photoautotrophic Fe(II)-oxidising bacterium R. palustris TIE-1 was provided with an excess of Fe(II) from siderite. Although the system was characterised by persistent levels of dissolved Fe(II), all minerals formed were fully ferric oxyhydroxides rather than mixed-valence compounds.
Fe(II) oxidation and production of Fe(III)
The oxidation of Fe(II) by TIE-1 affected the concentrations of Fe(II)aq and Fe(III)aq similarly for all inoculated replicates. The persistent dissolution of siderite as dictated by chemical equilibrium maintained [Fe(II)aq] around 60 μM throughout the experiment despite continuous bacterial growth and precipitation of Fe(III)-bearing minerals. Measured Fe(II)aq concentrations were higher than the predicted equilibrium concentration of 26 μM, which we calculated from siderite’s K sp (10–10.7; Morel and Hering, Reference Morel and Hering1993) and ion speciation in our experimental solution as determined with Visual MINTEQ. Kappler and Newman (Reference Kappler and Newman2004) similarly observed higher [Fe(II)aq] than predicted from thermodynamic equilibrium alone, although with an even larger difference (3 μM predicted vs 250 μM measured).
Similar concentrations of Fe(II)aq in inoculated and abiotic control bottles indicated that microbial Fe(II) oxidation rates did not exceed the rate of Fe(II) release into solution from partial siderite dissolution. Growth of R. palustris did not deplete Fe(II)aq over time, even though wild-type R. palustris TIE-1 can oxidise up to 2.1 mM Fe(II)aq/day (Bird et al., Reference Bird, Saraiva, Park, Calçada, Salgueiro, Nitschke, Louro and Newman2014). This result also contrasts with Maisch et al. (Reference Maisch, Nikeleit, Lüder, Bryce, Kappler and Byrne2025) who observed that Fe(II)aq was kept extremely low by TIE-1 in their siderite oxidation experiments. However, we note that starting siderite concentrations were only 3 mM in their experiments, unlike the 345 mM siderite that we provided. While our cultures turned visibly pink and turbid around 4–5 days after each medium refresh (Fig. S4), the use of lower PO43– (10 μM) than typical for cell culture experiments may also have hindered rates of Fe(II) oxidation. Control experiments indicated that lowering phosphate below 1 mM lowered anoxygenic photosynthetic growth rates but still provided sufficient phosphorus for cells, and there was even some growth with no added phosphate in the media (Fig. S3). Dead and lysed cells may also have served as sources of phosphate or organic carbon species that could be electron donors for R. palustris in addition to Fe(II) (e.g. Nikeleit et al., Reference Nikeleit, Maisch, Byrne, Harwood, Kappler and Bryce2024). Alternatively, microbial depletion of Fe(II)aq may have promoted siderite dissolution to maintain an equilibrium concentration of Fe(II)aq.
Only low levels of Fe(III)aq (<5 μM) were detected throughout the experiment, with inoculated samples containing on average 1–2 μM more Fe(III)aq than the uninoculated, abiotic control. This observation aligns with the expectation that Fe(III)aq should rapidly hydrolyse and form insoluble compounds at circumneutral pH (Schwertmann et al., Reference Schwertmann, Carlson and Fechter1984), efficiently partitioning Fe(III) into the solid fraction rather than remaining in suspension as complexed or colloidal forms.
Ferrozine analyses of acidified experimental precipitates demonstrate that very limited changes in bulk Fe redox state occurred over the course of the experiment. The proportion of Fe(III)/FeTsolid in the solid fraction increased only slightly in inoculated samples, rising on average from 3% to 6% Fe(III)/FeTsolid between the first and last day of the experiment. If we assume from the difference between those values that 3% of the starting siderite (345 mM) was oxidised over 32 days, then roughly 10.35 mM Fe(II) was oxidised in all, translating to 0.32 mM Fe(II) oxidised per day. This rate is on the lower end of published Fe(II) oxidation rates for photoferrotrophs (0.1–4.5 mM/day; Gauger et al., Reference Gauger, Byrne, Konhauser, Obst, Crowe and Kappler2016; Hegler et al., Reference Hegler, Posth, Jiang and Kappler2008; Jiao et al., Reference Jiao, Kappler, Croal and Newman2005; Kappler and Newman, Reference Kappler and Newman2004; Laufer et al., Reference Laufer, Niemeyer, Nikeleit, Halama, Byrne and Kappler2017; Peng et al., Reference Peng, Bryce, Sundman, Borch and Kappler2019; Schad et al., Reference Schad, Byrne, ThomasArrigo, Kretzschmar, Konhauser and Kappler2022; Wu et al., Reference Wu, Swanner, Hao, Zeitvogel, Obst, Pan and Kappler2014), possibly reflecting suppressed growth due to low phosphate.
Mineralogy of the oxidation products of siderite by R. palustris TIE-1
Raman and XRD analyses were used to track the evolution of bulk mineralogy throughout the experiment. Neither XRD nor Raman spectral signatures differed noticeably from that of synthetic siderite over the 32-day experiment, with the exception of new Raman bands in the inoculated samples (Fig. S1). These features were observed around 1005, 1150 and 1590 cm–1, which did not match peak positions of common Fe(III)-bearing minerals in our spectral database. We suggest that these signals are instead derived from carotenoids produced by R. palustris because such features are consistent with characteristic Raman bands of rhodovibrin and spirilloxanthin (Naruse et al., Reference Naruse, Hashimoto, Kuki and Koyama1991). These carotenoids are known to be synthesised by R. palustris via the organism’s methylerythritol phosphate (MEP) and carotenoid biosynthetic pathways (Li et al., Reference Li, Xia, Lv, Tong, Wang, Nie and Yang2022, Reference Li, Zhu, Yang, Wang, Liu and Yang2023).
The absence of new spectral features attributable to mineral phases indicates that little of the siderite substrate was modified or transformed over 32 days despite weekly replenishment of the growth medium. The persistence of most of the initial siderite was an intentional component of our experimental design; we started with approximately 345 mM siderite in each experimental bottle to ensure that most of the siderite would remain unchanged even if TIE-1 had been capable of oxidising Fe(II) at rates near the maximum reported in the literature (~2.1 mM/day; Bird et al., Reference Bird, Saraiva, Park, Calçada, Salgueiro, Nitschke, Louro and Newman2014). We hypothesised that allowing only a small fraction of total Fe(II) in the system to be oxidised would provide conditions most favourable for the formation of mixed-valent Fe minerals.
Scanning electron microscopy analyses corroborated our prior assessments of bulk mineralogy, revealing that the vast majority of siderite remained unchanged by the end of the experiment. Mineralogical changes in the inoculated samples were subtle, with the appearance of submicron lath and star-shaped clusters and rarer platelets the only clear indication of microbial iron oxidation (Fig. 4, Fig. S5). Scanning electron microscopy images also revealed that the secondary minerals were always attached to the surfaces of much larger (5–10 μm) siderite spherules rather than existing in isolation. The close association between framboidal siderite and the incipient phases precluded transmission electron microscopy (TEM) analyses, which would have provided nanoscale elemental and structural data. Siderite spheres were too thick to allow for penetration of the TEM electron beam, preventing the technique from imaging incipient minerals in our samples. As a result, we turned to X-ray absorption spectroscopy to further assess the Fe redox speciation and mineralogy of microbial Fe(II) oxidation products.
X-ray absorption near-edge structure spectra were fit to several geochemically plausible reference compounds to determine the mineralogy and Fe redox properties of newly formed minerals. Because >95% of the initial siderite remained unoxidised and the 1 μm synchrotron microbeam spot size was larger than any individual star-shaped particle, we expected all analysed regions to consist either of siderite alone or siderite with minor amounts of a Fe(III)-bearing phase or phases. As such, we fit experimental spectra with the most ferric signals using a least-squares fitting software (SIXpack). Both oxidised spectra were best fit with only ferrihydrite and siderite (Fig. 5). Binary linear combinations of an internal siderite standard and one other reference mineral showed that mixed-valence compounds such as green rust and magnetite produced poor linear combination fits, particularly in the most oxidised endmember, whereas the best fits were obtained when using the ferric oxyhydroxides ferrihydrite, lepidocrocite and goethite (Fig. 5; Fig. S7, Table S3).
While ferrihydrite yielded a better statistical fit than goethite, SEM imaging suggested that goethite is the major product of Fe(II) oxidation in our system. Ferrihydrite is an amorphous, poorly ordered hydrous ferric oxide with individual spherules 2–10 nm in diameter (Cornell and Schwertmann, Reference Cornell and Schwertmann2003). This morphology is inconsistent with our observations of regular arrangements of acicular needles or laths 0.5–1 μm in length. The platelets that appeared slightly later than the laths could be a similar phase to plates observed in another study and identified as a poorly crystalline Fe(III) oxyhydroxide (Nikeleit et al., Reference Nikeleit, Maisch, Byrne, Harwood, Kappler and Bryce2024). They are also a morphological match for nano-lepidocrocite (γ-FeO(OH)) platelets (Qafoku et al., Reference Qafoku, Kovarik, Bowden, Nakouzi, Sheng, Liu, Pearce and Rosso2020), which commonly form flowery aggregates of plates during corrosion (Antunes et al., Reference Antunes, Costa and de Faria2003; Duffó et al., Reference Duffó, Reinoso, Ramos and Farina2012). Goethite (α-FeO(OH)) is a better match for the more abundant laths that aggregate in star-like clusters when morphology is considered alongside XANES fitting results. Goethite has previously been detected in star-shaped clusters in experimental (Cornell and Giovanoli, Reference Cornell and Giovanoli1985; Hansel et al., Reference Hansel, Benner and Fendorf2005; Qafoku et al., Reference Qafoku, Kovarik, Bowden, Nakouzi, Sheng, Liu, Pearce and Rosso2020) and environmental (Spilde et al., Reference Spilde, Northup, Boston, Schelble, Dano, Crossey and Dahm2005) samples, where each star consists of three twinned crystals rotated 120° about a central point. Furthermore, the extended X-ray absorption fine structure of nano-goethite apparently is distinct from micro-goethite and instead has a very similar spectrum to ferrihydrite, leading to underestimation of goethite and overestimation of ferrihydrite (Sun et al., Reference Sun, Mailloux, Chillrud, van Geen, Thompson and Bostick2018). Thus, it is possible that, in our study, the XANES of nano-goethite was also mistakenly identified as ferrihydrite. Regardless, we argue that the morphology of the acicular laths and star-like clusters is not consistent with ferrihydrite but would match goethite. Although goethite appears to be the dominant microbial oxidation product observed in our system, we suggest it is probable that short-lived metastable ferrihydrite served as a precursor for the growth of more thermodynamically stable goethite. Indeed, our identification of dominantly goethite in this HCO3–-rich system, buffered by siderite and beginning with 10 mM NaHCO3, aligns with a prior study that determined ferrihydrite largely transformed into goethite with minor lepidocrocite in bicarbonate-rich systems (Qafoku et al., Reference Qafoku, Kovarik, Bowden, Nakouzi, Sheng, Liu, Pearce and Rosso2020).
Transformation from preexisting ferrihydrite is the main mechanism by which goethite forms in most natural environments (Schneider, Reference Schneider1988; Cornell and Schneider, Reference Cornell and Schneider1989). The conversion of ferrihydrite to goethite is a spontaneous reconstructive transformation involving the rearrangement of FeO3(OH)3 octahedral units (Funnell et al., Reference Funnell, Fulford, Inoué, Kletetschka, Michel and Goodwin2020; Sassi et al., Reference Sassi, Chaka and Rosso2021) into highly ordered edge-sharing octahedral double chains (Yang et al., Reference Yang, Lu, Downs and Costin2006). This process entails extensive reassembly of the crystal structure via dissolution and reprecipitation. The conversion of ferrihydrite to goethite in this manner most commonly proceeds in the presence of a catalyst such as Fe(II)aq (Tronc et al., Reference Tronc, Belleville, Jolivet and Livage1992; Benner et al., Reference Benner, Hansel, Wielinga, Barber and Fendorf2002; Hansel et al., Reference Hansel, Benner, Neiss, Dohnalkova, Kukkadapu and Fendorf2003). Such Fe(II)aq-catalysed transformations can be quite rapid, with quantitative conversion of ferrihydrite to goethite reported in under 14 h at 21°C (Yee et al., Reference Yee, Shaw, Benning and Nguyen2006). Because these changes take place through dissolution and reprecipitation rather than solid-state transformations, goethite particles grow in new structures rather than inheriting the morphologies of precursor phases (Guo and Barnard, Reference Guo and Barnard2013). The specific morphological characteristics of goethite can thus reveal details about its local chemical environment and growth mechanisms.
Goethite crystals with acicular morphology form through growth along a single crystallographic axis (the c-axis). This style of crystallisation proceeds through oriented-attachment growth from preexisting ferrihydrite nanoparticles and/or rapid nucleation onto freshly formed goethite (Barnard and Guo, Reference Barnard and Guo2012). The regular lengths of acicular goethite particles further imply that crystallisation occurred through a one-dimensional phase-boundary controlled mechanism with a constant nucleation rate (De Yoreo and Vekilov, Reference De Yoreo and Vekilov2003; Yee et al., Reference Yee, Shaw, Benning and Nguyen2006; Vekilov, Reference Vekilov2010). In such mechanisms, reactions proceed too slowly to attain equilibrium at the solid–liquid interface and the overall crystal formation rate is determined by access to available nucleation sites. The growth of goethite needles along a single axis rather than as multiply branched tree-like structures (e.g. Guo and Barnard, Reference Guo and Barnard2013, p. 32, fig. 11b) suggests that although the local environment was supersaturated with respect to goethite, saturation remained under a critical threshold required for activated secondary nucleation (Puel et al., Reference Puel, Verdurand, Taulelle, Bebon, Colson, Klein and Veesler2008).
Based on this body of literature, we propose that microbially-produced Fe(III)aq rapidly hydrolysed and precipitated as ferrihydrite near cells and directly adjacent to siderite. Fe redox speciation analyses show that the rate and extent of Fe(II) oxidation were both low, with only ~3% of total Fe(II) oxidised over 32 days. Therefore, only small quantities of ferrihydrite were present at any given time and Fe(II)aq sourced from siderite dissolution was probably in excess on a molar basis. The large specific surface area of ferrihydrite (Dzombak and Morel, Reference Dzombak and Morel1990; Jambor and Dutrizac, Reference Jambor and Dutrizac1998) coupled with plentiful Fe(II)aq meant that Fe(II)aq-catalysed recrystallisation could rapidly convert ferrihydrite into goethite and lepidocrocite (Das et al., Reference Das, Hendry and Essilfie-Dughan2011; Qafoku et al., Reference Qafoku, Kovarik, Bowden, Nakouzi, Sheng, Liu, Pearce and Rosso2020; Sheng et al., Reference Sheng, Liu, Li, Qafoku, Collins, Jones, Pearce, Wang, Ni and Lu2020; Notini et al., Reference Notini, ThomasArrigo, Kaegi and Kretzschmar2022). Small domains of goethite formed in this manner may have become suitable nucleation templates for direct growth of acicular goethite along its c-axis.
The hypothetical requirement for preexisting nucleation sites is consistent with SEM observations of siderite-attached goethite (Fig. 4; Fig. S5). An alternate mechanism in which goethite could precipitate directly from solution might have resulted in a more random dispersal of goethite particles than the strictly surface-attached crystals observed. Overall, the formation of goethite through surface-controlled growth mechanisms provides insights into how photoautotrophic iron-oxidising bacteria access Fe(II) and deal with the Fe(III) they produce.
Mechanism of photoautotrophic oxidation of siderite by TIE-1
The main Fe(II) oxidation product observed in this experiment was acicular goethite, which was first detected 6 days after inoculation with TIE-1. Regardless of whether goethite is preceded by transient ferrihydrite, our evidence indicates that Fe(II) oxidation by TIE-1 produces Fe(III) oxyhydroxides despite the presence of excess siderite and the continuous release of Fe(II) into solution. Although precipitates were greenish-grey in colour (Fig. S4), siderite oxidation by photoautotrophic bacteria did not appear to form carbonate green rust as speculated by Kappler and Newman (Reference Kappler and Newman2004). Rather than incorporating into the structure of mixed-valence minerals, Fe(II)aq seems to have been limited to catalysing the dissolution–reprecipitation reactions responsible for transforming initial ferrihydrite into goethite.
Why does oxidation of Fe(II) by TIE-1 produce fully ferric minerals even in the presence of excess Fe(II)aq? Previous studies on photoautotrophic Fe(II) oxidation by this strain at circumneutral pH have only definitively demonstrated the formation of poorly crystalline ferrihydrite (e.g. Kappler and Newman, Reference Kappler and Newman2004; Nikeleit et al., Reference Nikeleit, Maisch, Byrne, Harwood, Kappler and Bryce2024; Zhou et al., Reference Zhou, Templeton and Johnson2024; Maisch et al., Reference Maisch, Nikeleit, Lüder, Bryce, Kappler and Byrne2025) or goethite (Jiao et al., Reference Jiao, Kappler, Croal and Newman2005). Jiao et al. (Reference Jiao, Kappler, Croal and Newman2005) also observed the formation of magnetite, although they interpreted it to be a secondary product formed through the interaction of Fe(II)aq with primary ferric oxyhydroxides. In contrast, O2-induced oxidation can form mixed-valence green rust from similar solution compositions (Halevy et al., Reference Halevy, Alesker, Schuster, Popovitz-Biro and Feldman2017). The discrepancy in initial oxidation products raises the question of whether there are properties specific to microbial Fe(II) oxidation that favour the precipitation of ferric minerals over mixed-valence phases.
Illuminating which aspects of photoautotrophic Fe(II) oxidation could prevent the incorporation of structural Fe(II) requires understanding of the local chemical environment where the one-electron transfer from Fe(II) occurs. Genetic studies in R. palustris TIE-1 have established that the three-gene pioABC operon is required for both photoferrotrophy (Jiao and Newman, Reference Jiao and Newman2007) and phototrophic extracellular electron uptake (Bose et al., Reference Bose, Gardel, Vidoudez, Parra and Girguis2014). The pioA gene encodes a periplasmic decaheme cytochrome (PioA), pioB encodes an outer membrane porin (PioB) and pioC encodes a high-potential iron-sulfur protein. PioA is modified after secretion to produce a shorter heme-attached PioA (holo-PioAc), which can exist freely in the periplasm or form a complex with PioB that localises it to the outer membrane (Gupta et al., Reference Gupta, Sutherland, Rengasamy, Meacham, Kranz and Bose2019). The holo-PioAcB complex catalyses extracellular Fe(II) oxidation and also plays an integral role in extracellular electron uptake from insoluble iron minerals or poised electrodes (Bose et al., Reference Bose, Gardel, Vidoudez, Parra and Girguis2014; Gupta et al., Reference Gupta, Sutherland, Rengasamy, Meacham, Kranz and Bose2019). The periplasmic electron transfer protein PioC then shuttles electrons from the PioAB conduit to the photosynthetic reaction centre (Bird et al., Reference Bird, Bonnefoy and Newman2011, Reference Bird, Saraiva, Park, Calçada, Salgueiro, Nitschke, Louro and Newman2014).
Because the holo-PioAcB iron oxidase spans the outer membrane, the electron transfer from Fe(II) probably occurs extracellularly (e.g. Gupta et al., Reference Gupta, Sutherland, Rengasamy, Meacham, Kranz and Bose2019, p.12, fig. 8) rather than in the periplasmic space. The extracellular localisation of this process is not universal; many iron-oxidising microbes oxidise Fe(II) in the periplasm, at times leading to periplasmic encrustation by insoluble Fe(III) minerals (Klueglein et al., Reference Klueglein, Zeitvogel, Stierhof, Floetenmeyer, Konhauser, Kappler and Obst2014; Miot et al., Reference Miot, Maclellan, Benzerara and Boisset2011, Reference Miot, Recham, Larcher, Guyot, Brest and Tarascon2014; Xing et al., Reference Xing, Graham, Zhao, Li, Tang, Kappler, Dong, Winkler and Yu2023). Being in close proximity to siderite crystals may confer a growth advantage if TIE-1 indeed acquires and oxidises Fe(II) directly outside its cell membrane because Fe(II)aq is released from the partial dissolution of solid siderite. Supporting this argument for siderite-proximal growth, SEM images showed that TIE-1 cells were commonly attached to siderite framboids (Fig. 4; Fig. S5). Furthermore, a recent study indicates that TIE-1 has mechanisms to promote the dissolution of siderite, and that dissolution is enhanced when cells are able to access the siderite surface (Maisch et al., Reference Maisch, Nikeleit, Lüder, Bryce, Kappler and Byrne2025).
Although aqueous Fe(II) is commonly considered to be the bioavailable form of Fe for photoferrotrophs, TIE-1 may also be able to oxidise structural Fe(II). This strain is capable of accepting electrons from poised electrodes (Bose et al., Reference Bose, Gardel, Vidoudez, Parra and Girguis2014) as well as magnetite nanoparticles (Byrne et al., Reference Byrne, Klueglein, Pearce, Rosso, Appel and Kappler2015, Reference Byrne, Van Der Laan, Figueroa, Qafoku, Wang, Pearce, Jackson, Feinberg, Rosso and Kappler2016) and potentially siderite (Maisch et al., Reference Maisch, Nikeleit, Lüder, Bryce, Kappler and Byrne2025) through extracellular electron uptake mechanisms. While it remains unclear whether TIE-1 can directly oxidise siderite, we see no morphological signs of solid-state siderite transformation. Therefore, even if structural Fe(II) had been oxidised, any Fe(III) produced by the process was probably released into solution before being reprecipitated. As such, our proposed goethite formation mechanism should hold whether TIE-1 was oxidising aqueous or structural Fe(II) because Fe(III) should be generated extracellularly into the same local environment in both cases.
Finally, cell membranes appeared free of visible encrustation throughout the experiment (Figs 4b,i; Fig. S5), although goethite was almost always found within 1 μm of intact cells. Mineral precipitation at some distance from the cell surface suggests that newly formed Fe(III) was able to diffuse away from the outer membrane before its hydrolysis and precipitation as either metastable ferrihydrite or goethite. One explanation is that Fe(III)aq diffusion rates could have simply exceeded rates of Fe(III)aq hydrolysis and precipitation. Alternatively, TIE-1 could have some mechanism to generate a low-pH microenvironment around the outer membrane, which prevents precipitation until the Fe(III)aq diffuses into a less acidic environment (Hegler et al., Reference Hegler, Posth, Jiang and Kappler2008, Reference Hegler, Schmidt, Schwarz and Kappler2010).
Controls on primary minerals produced by photoautotrophic Fe(II) oxidation
We tested whether microbial Fe(II) oxidation in a siderite-buffered system could drive the formation of mixed-valence Fe minerals, as hypothesised and observed in prior literature (Kappler and Newman, Reference Kappler and Newman2004; Pantke et al., Reference Pantke, Obst, Benzerara, Morin, Ona-Nguema, Dippon and Kappler2012). All evidence points to the exclusive precipitation of ferric products even at the earliest stages of our experiment. Why is this the case if TIE-1 is generating low levels of Fe(III)aq extracellularly, directly into a solution with at least 60 μM Fe(II)aq?
One explanation for the sole generation of ferric phases could be that the formation of mixed-valence green rust and magnetite is sensitive to pH and stoichiometric constraints that were not met in this experiment. Green rust consists of positively charged Fe(II)/Fe(III)-tri-octahedral hydroxide layers ([Fe(II)4(Fe(III)2(OH)12]2+) alternating with negatively charged interlayers containing carbonate, chloride or sulfate anions (Refait et al., Reference Refait, Abdelmoula and Génin1998; Génin et al., Reference Génin, Refait, Bourrié, Abdelmoula and Trolard2001; Ruby et al., Reference Ruby, Géhin, Abdelmoula, Génin and Jolivet2003; Simon et al., Reference Simon, François, Refait, Renaudin, Lelaurain and Génin2003). Direct precipitation of green rust has typically been documented when stoichiometric ratios of Fe(II), Fe(III) and OH– are used, with a 1:2 Fe:OH– ratio deemed particularly important (Bocher et al., Reference Bocher, Géhin, Ruby, Ghanbaja, Abdelmoula and Génin2004; Génin et al., Reference Génin, Ruby, Géhin and Refait2006; Guilbaud et al., Reference Guilbaud, White and Poulton2013). The requirement for higher OH– has a mechanistic basis as well. The proposed mechanism for green rust precipitation involves the oxidation of a Fe(OH)2 intermediary (Olowe and Génin, Reference Olowe and Génin1991; Génin et al., Reference Génin, Refait, Bourrié, Abdelmoula and Trolard2001, Reference Génin, Ruby, Géhin and Refait2006) and may further explain why green rust is typically only observed or stabilised at higher pH values (Drissi et al., Reference Drissi, Ph, Abdelmoula and Génin1995; Guilbaud et al., Reference Guilbaud, White and Poulton2013; Halevy et al., Reference Halevy, Alesker, Schuster, Popovitz-Biro and Feldman2017; Tosca et al., Reference Tosca, Ahmed, Tutolo, Ashpitel and Hurowitz2018).
These favourable conditions for green rust precipitation were not met in our experiment. At our pH setpoint of 7.0, [OH–] was only 10–7 M (0.1 μM), whereas bulk dissolved Fe was around 65 μM (60 μM Fe(II)aq + 5 μM Fe(III)aq; Fig. 1, Table S1). Even as the pH rose to 7.3, [OH–] would only rise to ~0.2 μM. The OH– concentration was therefore two orders of magnitude lower than the measured soluble iron content, potentially precluding the precipitation of green rust. These factors can also be applied to explain why magnetite precipitation was unfavourable under our experimental conditions. Although magnetite in natural environments is typically a secondary (bio)mineralisation product of existing ferric oxyhydroxides (Bell et al., Reference Bell, Mills and Herman1987; Hansel et al., Reference Hansel, Benner, Neiss, Dohnalkova, Kukkadapu and Fendorf2003), its nucleation and growth via Fe(II) and Fe(III) co-precipitation is likewise enhanced under alkaline conditions (Laurent et al., Reference Laurent, Forge, Port, Roch, Robic, Vander Elst and Muller2010; Baumgartner et al., Reference Baumgartner, Dey, Bomans, Le Coadou, Fratzl, Sommerdijk and Faivre2013). Similar to green rust, an initial Fe(II):OH– ratio of 1:2 (i.e. the stoichiometric ratio of Fe(OH)2) is believed to be the most appropriate value for magnetite synthesis by oxidation of a solution containing Fe(II)aq (Kiyama, Reference Kiyama1974).
In addition to the effect of pH on governing initial mineralogy, the phases identified in this experiment may have precipitated in a local chemical environment not conducive to the formation of Fe(II,III) minerals. Because Fe(II) oxidation is believed to occur at the outer cell membrane of TIE-1, Fe(III) generated by this organism would have been released into a small volume immediately surrounding active cells. The influx of Fe(III) into a relatively restricted environment could allow high concentrations of Fe(III)aq to accumulate locally, driving the precipitation of ferric rather than mixed-valence phases. This microenvironmental control is consistent with results presented by Hinz et al. (Reference Hinz, Nims, Theuer, Templeton and Johnson2021), who found that adding 0.05 mM Fe(III)aq to a pH 6.5 or 7.0 seawater solution containing 0.95 mM Fe(II)aq stimulated the immediate precipitation of predominantly amorphous Si-rich Fe(III) oxides. The direct delivery of Fe(III) in this manner would have rapidly introduced Fe(III) more locally than the diffusion of molecular oxygen into a solution containing ferrous iron. Aerial oxidation is always a slower process because it requires additional steps to produce Fe(III), namely the diffusion and dissolution of molecular oxygen into solution followed by the oxidation of Fe(II). This delay may make it less probable for Fe(III)aq to accumulate to high levels in specific regions of the solution, particularly if the system is well-mixed.
The precipitation of metastable green rust from a Precambrian seawater analogue as demonstrated by Halevy et al. (Reference Halevy, Alesker, Schuster, Popovitz-Biro and Feldman2017) and the Pantke et al. (Reference Pantke, Obst, Benzerara, Morin, Ona-Nguema, Dippon and Kappler2012) study of a nitrate-reducing iron oxidising microbial strain provide useful counterpoints to consider factors that control the identity of primary products of Fe(II) oxidation. The Halevy et al. (Reference Halevy, Alesker, Schuster, Popovitz-Biro and Feldman2017) experiment was conducted at a slightly higher pH (between 7 and 8) than our study (pH 7–7.3), and initial phases were aged for about a day in a slightly alkaline solution before the first mineral characterisation. This higher pH alone may have been enough to shift the mineral assemblage towards green rust, consistent with modelling results from the same study. Their thermodynamic model predicted that green rust would only begin to dominate Fe(II) oxidation products above a pH of 7.2. Pantke et al. (Reference Pantke, Obst, Benzerara, Morin, Ona-Nguema, Dippon and Kappler2012) detected a green rust intermediate at pH levels comparable to our system (6.8–7.2), although their media initially contained 6 mM Fe(II)aq, establishing a much more Fe(II)-rich system that could be critical for green rust formation. In addition, these studies all differed in the mode of Fe(II) oxidation. Halevy et al. (Reference Halevy, Alesker, Schuster, Popovitz-Biro and Feldman2017) oxidised their ferruginous seawater via diffusion of air, probably producing Fe(III)aq more evenly throughout the system than microbially mediated Fe(II) oxidation would. Pantke et al. (Reference Pantke, Obst, Benzerara, Morin, Ona-Nguema, Dippon and Kappler2012) suggested the formation of green rust was driven by a nitrite byproduct reacting with Fe(II)aq, which also may cause a more gradual oxidation of Fe(II) (Miot et al., Reference Miot, Benzerara, Morin, Bernard, Beyssac, Larquet, Kappler and Guyot2009; Pantke et al., Reference Pantke, Obst, Benzerara, Morin, Ona-Nguema, Dippon and Kappler2012) compared to direct and localised iron oxidation by TIE-1. Although these differences hint that the pH and oxidative pathway could be major controls on primary mineralogy, a more rigorous understanding of the exact mechanism and local chemistry of Fe(II) oxidation processes is required to clarify the relationships between the mode of oxidation, chemical (micro)environmental conditions and resulting mineralogy.
Conclusions
In the presence of siderite and persistent Fe(II)aq, the photoferrotroph TIE-1 drove the transformation of siderite into predominantly well-ordered acicular goethite. Fe(II)aq mediated the recrystallisation of precursor ferrihydrite to more thermodynamically stable goethite but did not appear to induce the formation of mixed-valent Fe compounds. These results may complicate the use of the bulk mineral redox state as proxies for the redox composition of the source solution because fully oxidised phases are seemingly capable of precipitating directly from solutions with ample remaining Fe(II)aq.
Given that our experiment was conducted under conditions unfavourable for green rust or magnetite formation, we cannot discount the possibility that photoferrotrophy can produce primary mixed-valence Fe minerals under different circumstances. Rather, this study suggests that the local chemical environment to which newly produced Fe(III) is first exposed might exert a major control over the identity of the initial mineral phase(s). Although low levels of Fe(II)aq were continually present in our experimental solution, low [OH–] may have precluded the formation of the Fe(OH)2 intermediate required for the oxidative formation of green rust (Génin et al., 2006; Guilbaud et al., Reference Guilbaud, White and Poulton2013) and magnetite (Schikorr, Reference Schikorr1929; Ma et al., Reference Ma, Zhang, Guo and Gu2013; Wang et al., Reference Wang, Bowden, Saslow, Riley, Kim, Eaton and Kruger2021).
The primary precipitation of Fe(III) oxyhydroxides in our experimental system aligns with the understanding that pH can influence the products of Fe(II) oxidation. It is well-established that somewhat alkaline conditions favour the direct precipitation of green rust, as supported by multiple experimental and modelling studies (Detournay et al., Reference Detournay, De Miranda, Derie and Ghodsi1975; Génin et al., 2006; Guilbaud et al., Reference Guilbaud, White and Poulton2013; Halevy et al., Reference Halevy, Alesker, Schuster, Popovitz-Biro and Feldman2017). However, the enhanced stability of green rust under alkaline conditions may conflict with the idea that green rust was an important primary phase in the Archean oceans. The pH typically required for direct green rust precipitation (>7.2) is higher than the range predicted for Archean seawater (~6.5–7.0; Halevy and Bachan, Reference Halevy and Bachan2017; Krissansen-Totton et al., Reference Krissansen-Totton, Arney and Catling2018). Therefore, very specific conditions may have been needed for green rust to directly precipitate from Archean seawater, raising questions about whether it could have been a significant sink for ancient marine iron.
In conclusion, primary biomineralisation pathways are governed by aqueous geochemistry, microbial metabolism, and the nucleation and growth of solid phases. These findings show that Fe(III) oxyhydroxides can precipitate from anoxic solutions with an excess of Fe(II)aq, although it is difficult to discern whether primary mineral products are more strongly controlled by the local chemical environment or by the oxidative mechanism. Further studies are needed to resolve this issue and refine our understanding of early Earth environments and the processes that generated ancient mineral deposits.
Supplementary material
The supplementary material for this article can be found at http://doi.org/10.1180/gbi.2026.10009.
Acknowledgements
We are grateful to Leanne Rossi for her assistance with Raman analyses. We also thank Sam Webb and other research staff at the Stanford Synchrotron Radiation Lightsource for assistance with X-ray absorption spectroscopy acquisition, analyses and data processing. We appreciate feedback from four reviewers who helped improve the manuscript. Research was supported by NSF Geobiology and Low-Temperature Geochemistry (J.E.J., Award 2142509), NASA Exobiology (J.E.J., Award #80NSSC18K1060) and the University of Michigan Department of Earth and Environmental Sciences Scott Turner Award Funds (A.Z.).
Competing interests
The authors declare none.
Data availability statement
Additional data files can be found in this Zenodo repository: https://doi.org/10.5281/zenodo.12761932.
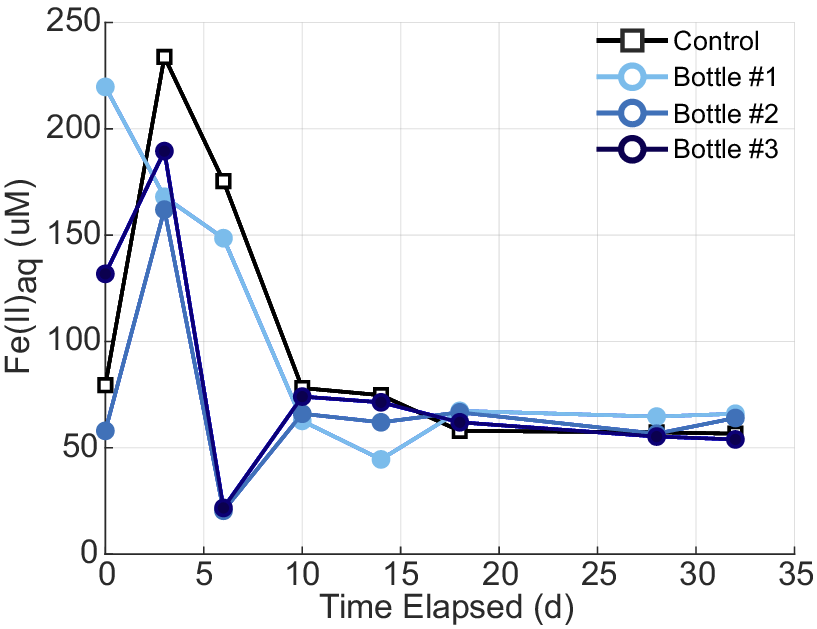
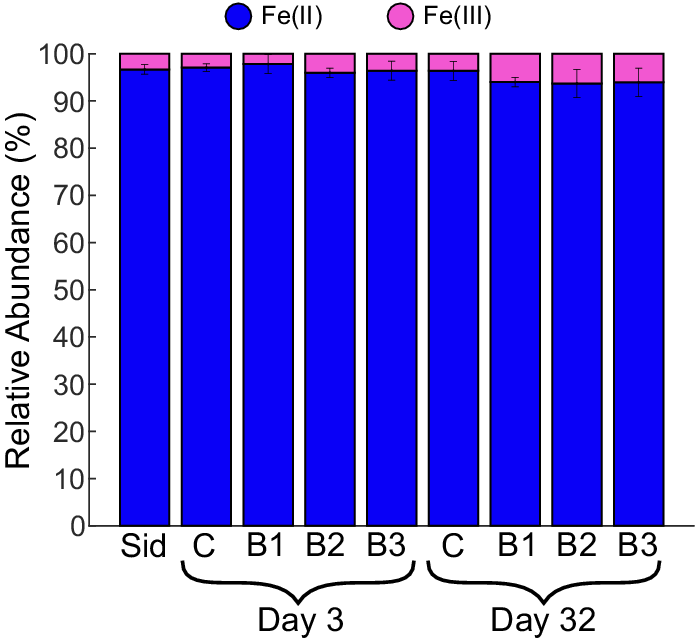
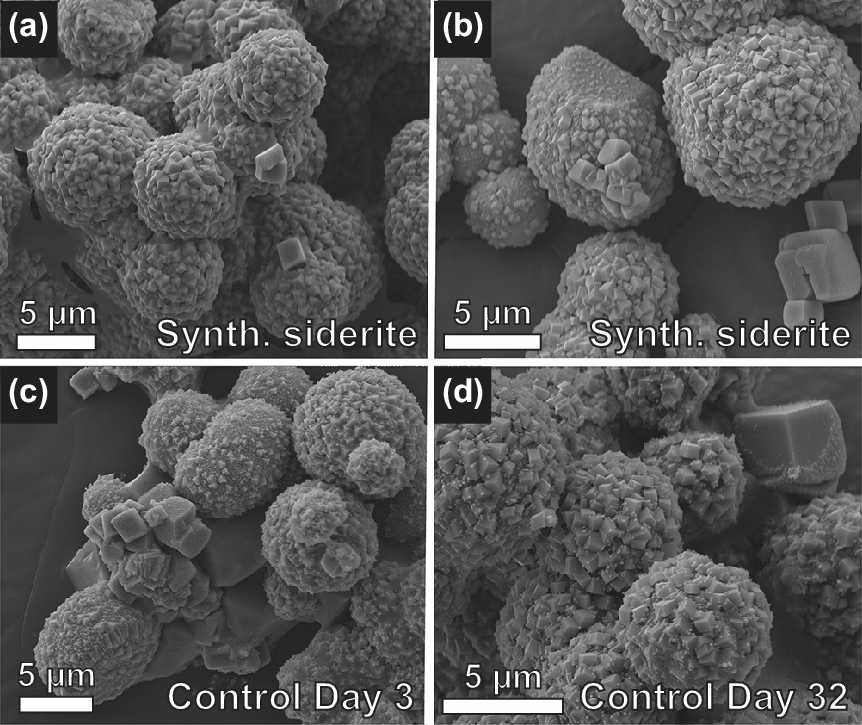
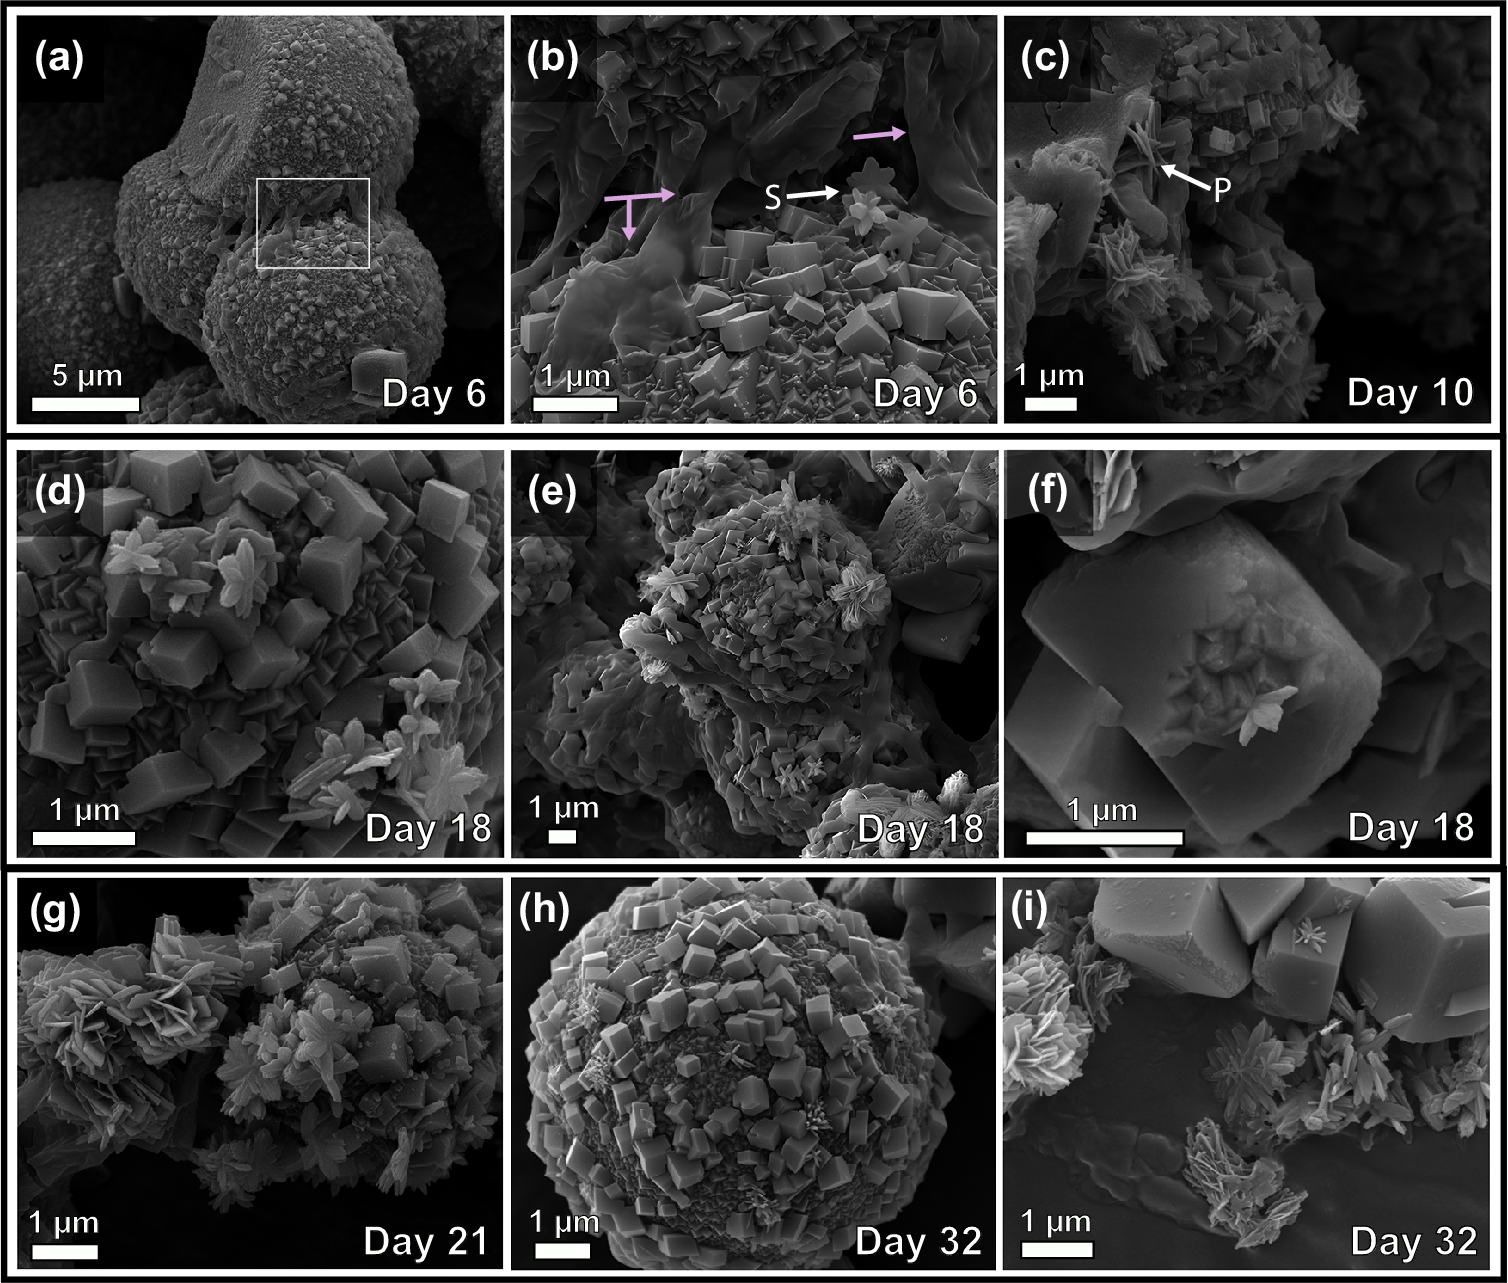
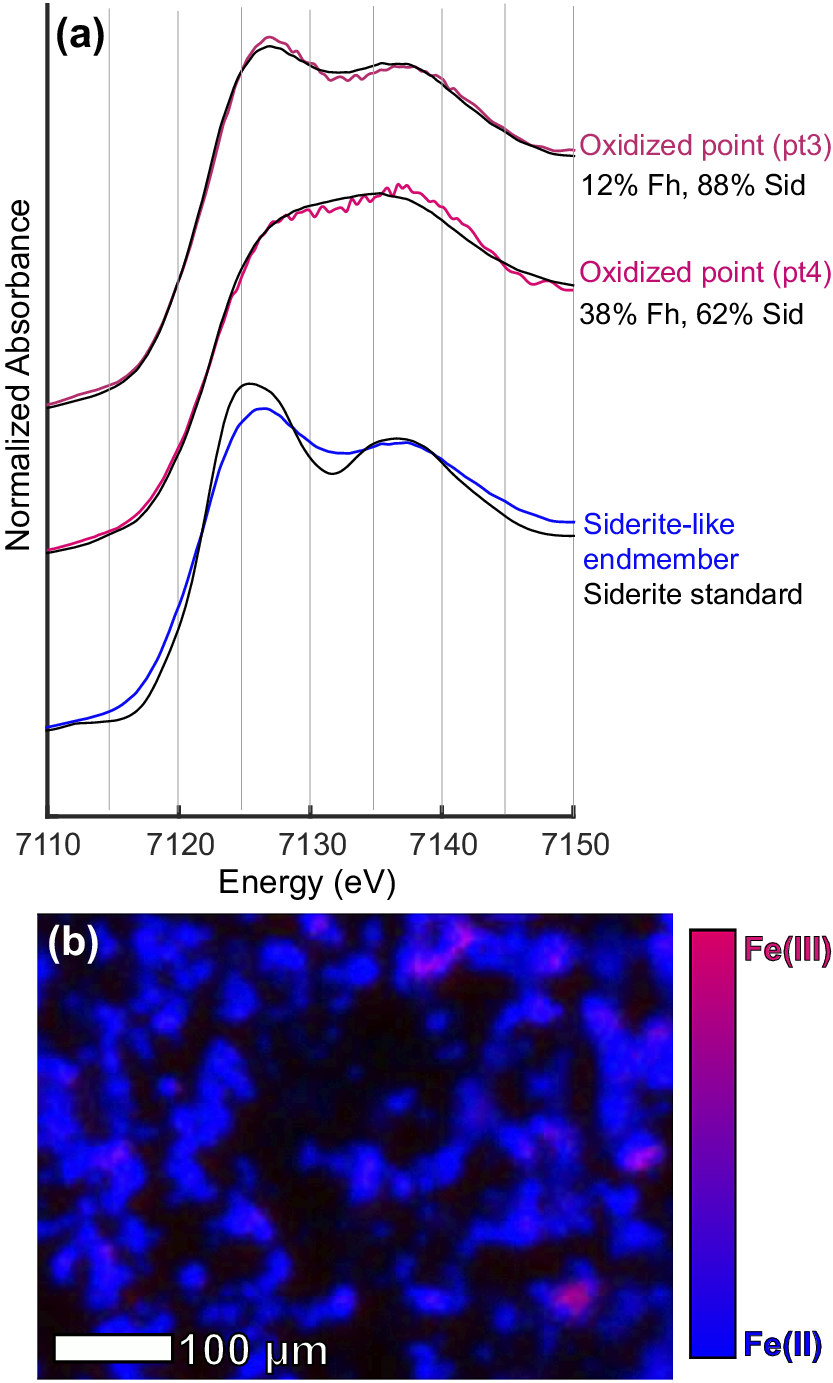


 Open access

