I. INTRODUCTION
The need for implantable devices for medical research and patient care requires the development of materials that meet certain biocompatibility standards. A biocompatible material can be defined as one that has the ability to exist in contact with living tissue without causing a harmful negative response and, at the same time, without degradation of device performance or functionality.Reference Williams1 However, the material may produce beneficial effects in the host, measured through the stimulation of stem cell differentiation, maintenance of cell phenotype, or a variety of other processes.Reference Williams1 Initially, it was thought that biocompatible materials for medical devices should exhibit completely inert surfaces. However, this concept needs to be revised, since a biological response of some magnitude, adverse or not, can be beneficial or may even be necessary, for example, with materials used in sutures. Therefore, the primary concern is not the complete avoidance of biological material response but the mitigation of adverse effects. Thus, a biocompatible substrate will allow cells to perform required chemical processes on the surface, such as specific signal transduction responses that lead to cell attachment and proliferation.Reference Miyamoto, Akiyama and Yamada2, Reference Juliano, Haskill and Carolina3 The aforementioned processes are mediated by the interactions between cell surface integrin receptors and extra cellular matrix (ECM) proteins adsorbed on the substrate, in which the wettability, roughness, and charge of the surface play important roles.Reference Miyamoto, Akiyama and Yamada2, Reference Underwood, Steele and Dalton4–Reference McClary, Ugarova and Grainger6 Hence, a biocompatible material that could be functionalized to achieve a specific aim, such as detection of target biomolecules or promotion of specific protein attachment, would provide an optimum substrate for device construction.Reference Sundaram, Gómez-Navarro, Balasubramanian, Burghard and Kern7–Reference Vahlberg, Yazdi, Petoral, Syvajarvi, Uvdal, Spetz, Yakimova and Khranovsky9 The use of self-assembled monolayers (SAMs) to tune surface properties is particularly attractive for implantable device applications since it allows controlled cell proliferation while maintaining close physical proximity, and, therefore, electrical coupling, between cells and the underlying substrate.
Silicon carbide (SiC) is a ceramic and semiconductor that has been used in high-power and high-temperature applications due to its robust mechanical and electrical properties in harsh environments.Reference Yakimova, Steinhoff, Petoral, Vahlberg, Khranovskyy, Yazdi, Uvdal and Lloyd Spetz10, Reference Fawcett, Wolan, Lloyd Spetz, Reyes and Saddow11 It is chemically inert to acids, alkalis, and salts, does not expand in liquid environments, and can be processed with existing methods, which were developed for the silicon (Si) industry.Reference Carter, Casady, Bonds, Okhuysen, Scofield and Saddow12, Reference Gabriel, Erill, Caro, Gomez, Riera, Villa and Godignon13 SiC has been demonstrated to be biocompatible,Reference Yakimova, Petoral, Yazdi, Vahlberg, Lloyd Spetz and Uvdal14, Reference Saddow, Frewin, Coletti, Schettini, Weeber, Oliveros and Jarosezski15 and many examples of this property are presented in the review article written by Yakimova et al.,Reference Yakimova, Petoral, Yazdi, Vahlberg, Lloyd Spetz and Uvdal14 one of the first review articles on the topic, which describes several SiC-based biomedical devices and possible surface functionalization of the material for bioelectronic device construction. Later, Saddow et al.Reference Saddow, Frewin, Coletti, Schettini, Weeber, Oliveros and Jarosezski15 summarized their work regarding the in vitro viability of skin, connective tissue, platelets, and nervous cells on SiC. Colleti et al.Reference Coletti, Jaroszeski, Pallaoro, Hoff, Iannotta and Saddow16 tested the biocompatibility of SiC using in vitro techniques with B16-F10 mouse melanoma, BJ human fibroblast, and human keratinocyte (HaCaT) cells and found that there was qualitatively no difference between 3C–SiC, 4H–SiC, and 6H–SiC in terms of cell viability. In addition, n- or p-type doping of the semiconductor had little impact on these cell lines. A comprehensive in vitro study on 3C–SiC and nanocrystalline diamond with PC12 and H4 cells showed superior lamellipodia permissiveness on 3C–SiC compared to Si.Reference Frewin, Jaroszeski, Weeber, Muffly, Kumar, Peters, Oliveros and Saddow17 However, not all the SiC polytypes presented the same behavior. For instance, 6H–SiC and 4H–SiC displayed similar cell morphologies and viability to 3C–SiC with B16-F10, BJ, and HaCaT cell lines but lower cell proliferation with PC12 and H4 cells.Reference Coletti, Jaroszeski, Pallaoro, Hoff, Iannotta and Saddow16, Reference Frewin18 The trend was different with PC12 and H4 cells, with reduced cell viabilities observed for 6H–SiC with PC12 and H4 cells.Reference Frewin18 On the 6H–SiC surface, optical inspection of cell morphology revealed a rounded and elliptical shape with small microtubule extensions. In addition, it was established that 6H–SiC possessed a reduced surface permissiveness when compared to 3C–SiC due to the negative charge of the surface in combination with other factors. Recently, the in vivo biocompatibility of 3C–SiC in the central nervous system was investigated by comparing the immunoresponse of 3C-3iC neural probes implanted in C56BL/6 mice after 5, 10, and 35 days. In this case, the 3C–SiC surface revealed limited immunoresponse and significantly reduced microglial activation compared to Si substrates.Reference Frewin18
SiC has also been validated as a hemacompatible and suitable material for heart stent coatings.Reference Hehrlein19–Reference Kalnins, Erglis, Dinne, Kumsars and Jegere21 Schettini et al.Reference Schettini, Jaroszeski, West, Saddow and Saddow22 determined that 3C–SiC presents properties of a hemacompatible material, whereas 4H–SiC and 6H–SiC showed no qualitative improvement compared with Si, a known nonhemacompatible material. Herhlein et al.Reference Hehrlein19 provided an extensive review about the implementation of amorphous SiC (a-SiC) as a coating for heart stents, which includes the work done by Rzany and Schaldach,Reference Rzany and Schaldach20 who explored the hemacompatibility of the a-SiC surface by exposing 316L stainless steel uncoated and coated with a-SiC to circulating human blood for 15 min, and observed a dense fibrin network with incorporated blood cells on the metallic surface but not on the a-SiC-coated surface. Kalnins et al.Reference Kalnins, Erglis, Dinne, Kumsars and Jegere21 conducted a clinical study using a Tenax stent covered with a-SiC monitored in 300 patients for 2 years and concluded that the a-SiC-coated stents reduced early and late coronary events. Other studies, including the one made by Santavirta et al.,Reference Santavirta, Takagi, Nordsletten, Anttila, Lappalainen and Konttinen23 have been focused on evaluating the cytotoxicity of Ti-based pins for hip replacement implants compared to coated SiC–Ti pins and determined the advantages of using a SiC coating for bone prosthetics.
SAM-modified surfaces yield inorganic/organic interfaces that can also be used to tailor the surface properties of SiC to achieve a specific aim. Previous studies of SAM formation on Si and glass surfaces have proven many of these functionalized substrates to be highly biocompatible, with corresponding increases in cell adhesion to the substrates.Reference Faucheux, Schweiss, Lützow, Werner and Groth24–Reference Low, Williams, Canham and Voelcker27 For instance, Faucheaux et al.Reference Faucheux, Schweiss, Lützow, Werner and Groth24 concluded that there was a strong interaction and elevated proliferation of cells on amino-terminated SAMs on glass and Si with an enhanced activity of integrins compared to methyl-, bromine-, and vinyl-terminated SAMs. The strength of adhesion and morphology of vein endothelial cells was related to surface chemistry composition of organosilanes prepared on Si (100) by Kapur and Rudolph,Reference Kapur and Rudolph25 as well as the increased cell spreading and strength of cell adhesion on the modified surfaces. Amine- and amide-terminated SAMs have also been considered as artificial coatings on Si substrates for controlled neuronal growth and development. The work performed by Stenger et al.Reference Stenger, Pike, Hickman and Cotman26 also demonstrated that the cell body is affected by the SAM chemistry and structure and that hippocampal neuron growth and survival is also sensitive to the mentioned factors. Nonetheless, collagen and 3-aminopropyltrimethoxysilane coated porous Si has been shown to promote PC12 cells and epithelial cell attachment compared to oxidized and polyethylene glycol silanized surfaces.Reference Low, Williams, Canham and Voelcker27
SAMs are composed of organic molecules that are covalently immobilized on the surface of the semiconductor via suitable linker groups.Reference Catellani and Cicero8, Reference Vahlberg, Yazdi, Petoral, Syvajarvi, Uvdal, Spetz, Yakimova and Khranovsky9, Reference Linford and Chidsey28 In general, hydrogen (H)- or hydroxide (OH)-terminated surfaces provide the reactive sites necessary to obtain high quality monolayers. Hydrosilylation and silanization are two common surface functionalization processes that have been used extensively on Si substratesReference Linford and Chidsey28–Reference Stutzmann, Garrido, Eickhoff and Brandt30 and SAMs synthesized in this way have been analyzed in detail, with either suppression or enhancement of cell spreading and proliferation depending on the identity of the molecular end-group.Reference Faucheux, Schweiss, Lützow, Werner and Groth24
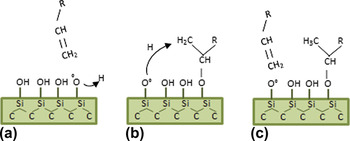
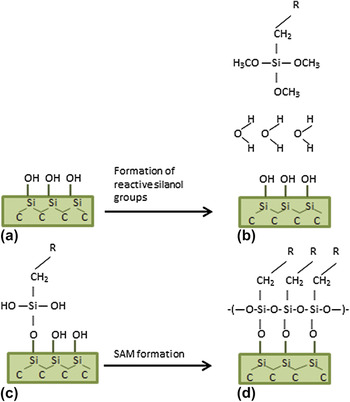
Hydrosilylation of Si typically involves the attachment of long-chain alkenes to the surface of the H-terminated semiconductor through addition reactions, resulting in formation of Si–C covalent bonds with the surface.Reference Linford and Chidsey28, Reference Rosso, Arafat, Schroën, Giesbers, Roper, Maboudian and Zuilhof31 Silanization, on the other hand, requires an OH-terminated surface, which can react with the alkoxy groups of organosilane molecules.Reference Stutzmann, Garrido, Eickhoff and Brandt30, Reference Rosso, Arafat, Schroën, Giesbers, Roper, Maboudian and Zuilhof31 The functionalization of SiC is possible using both alkenes and organosilanes, similar to the processes used for Si, but certain differences in the surface preparation must be addressed.Reference Catellani and Cicero8, Reference Rosso, Arafat, Schroën, Giesbers, Roper, Maboudian and Zuilhof31–Reference Schoell, Hoeb, Sharp, Steins, Eickhoff, Stutzmann and Brandt34 Treating 6H–SiC (0001) with HF creates a nearly perfectly OH-terminated surface.Reference Tsuchida, Kamata and Izumi35 Alkoxylation using alkenes is possible on OH-terminated surfaces via a Markovnikov addition reaction but leads to a Si–O–C bonding configuration that is chemically less stable than direct Si–C bonding.Reference Rosso, Arafat, Schroën, Giesbers, Roper, Maboudian and Zuilhof31 Illustrations of the proposed mechanisms for alkoxylation and silanization processes on SiC substrates are shown in Figs. 1 and 2.
In this paper, we demonstrate that the proliferation and attachment of two immortalized neuronal cell lines can be controlled after biofunctionalization of 6H–SiC using both hydrophobic and mildly hydrophilic SAMs. The contrasting properties of the functionalized surfaces are shown to affect the cell responses to the surfaces, which are assessed through the observation of PC12 and H4 cell proliferation and morphology. Cell-treated polystyrene (PSt) was used as the control surface, and reference measurements were performed on untreated SiC surfaces. The quantification of cell proliferation was achieved using 3-(4,5-dimethylthiazol-2-yl)-2,5-diphenyltetrazolium bromide (MTT) assays. Yellow MTT is only metabolized by living mitochondria, producing purple formazan, which is soluble in dimethyl sulfoxide. Thus, the cell viability can be quantified using a spectrophotometer in the wave length range of 500–600 nm.Reference Mossman36 Cell morphologies also provide indications of substrate biocompatibility. Cells tend to spread and increase their attached area when a substrate promotes adhesion of suitable proteins.Reference Richards37 Likewise, if a substrate is attractive to a cell, the cell filopodia and lamellipodia extensions couple strongly with the surface.Reference Goodman38, Reference Levitan and Kaczmarek39 Hence, qualitative analysis of cell morphology and filopodia and lamellipodia extensions, in addition to quantitative assessment via MTT assays, provides an insight into the permissiveness of the functionalized surfaces and an indication of the biocompatibility of the material.
Alkoxylation process. (a) Creation of surface radical by hydrogen abstraction under thermal, catalytic, or photochemical activation. (b) Markovnikov addition of the alkene to the surface dangling bond. (c) Saturation of the surface-bound alkyl chain by abstraction of a neighboring surface hydrogen atom. (color online)

Chemical silanization process. (a) Surface hydroxylation via HF etching results in adsorption of a water layer on the hydrophilic surface. (b) Samples are immersed in a solution containing organosilane molecules leading to (c) formation of reactive silanol groups via reaction with adsorbed water. The activated molecules covalently bind to the hydroxylated surface. (d) A cross-linked network is formed by reaction of silanol groups of adjacent molecules with one another. (color online)

II. MATERIALS AND METHODS
A. Substrate preparation
Two 6H–SiC off-axis n-type wafers [3.43° off-axis, Si (0001) face, 420 μm thick], purchased from Cree Inc. (Durham, NC), were diced into 5 × 5 mm2 die. A hydrogen etching process was first performed to obtain well-ordered atomically flat surfaces free of polishing scratches and with reduced defect densities.Reference Frewin, Coletti, Riedl, Starke and Saddow40, Reference Coletti, Frewin, Saddow, Hetzel, Virojanadara and Starke41 The samples were then ultrasonically cleaned in acetone, methanol, and isopropanol, followed by a 10-min immersion in piranha solution (H2SO4:H2O2, 2:1). A sequence of oxygen plasma (2450 MHz, 200 W, 1.4 mbar) treatment and etching for 5 min in 5% diluted HF to obtain the hydroxyl (–OH) termination was performed twice before functionalizing the surfaces. The thermal alkylation process with 1-octadecene was performed directly on OH-terminated surfaces. For the silanization processes, using aminopropyldiethoxymethylsilane (APDEMS) and aminopropyltriethoxysilane (APTES), the oxygen plasma step was replaced with a HCl (1:2, HCl:H2O) dip followed by a 5% diluted HF dip; the last step was performed to obtain the hydroxyl (–OH) termination.
B. Preparation of SAMs on SiC substrates
After cleaning and etching of the samples, alkylation of 6H–SiC (0001) was performed by reaction of the hydroxylated surfaces with 1-octadecene for 120 min at 200 °C under Ar. The samples were then ultrasonically cleaned in hexane, chloroform, and methanol for 10 min each. The silanization reactions were performed by immersing the samples in 10% APDEMS (or APTES) in anhydrous toluene for 90 min at room temperature in a N2 environment, followed by ultrasonic cleaning in toluene and isopropanol, for 20 min each. After SAM formation, the samples were placed in ethanol to prevent bacterial growth and surface oxidation before cell seeding.
C. Surface characterization
Static water contact angle (SWCA) measurements were performed using a KSV CAM101 system from KSV Instruments (Helsinki, Finland). Briefly, a 3-μL droplet of deionized (DI) water was deposited on three different samples for each of the surfaces prepared. The droplet contact angle was determined by measuring the angles between the baseline of the drop and the tangent of the same. In addition, atomic force microscopy (AFM) topography measurements of the surfaces were performed using a XE-100 Advanced Scanning Microscope from Park Systems (Santa Clara, CA) under ambient conditions. Surface scans of 5 × 5 μm2 area were collected in non-contact mode, and the overall RMS roughness (Rq) was calculated using the Park Systems XEI image analysis software.
D. Biocompatibility assessment
Two immortalized neural cell lines obtained from American Type Culture Collection (ATCC, Manassas, VA) were used for this study: H4 human neuroglioma (ATCC # HTB-148) and PC12 rat pheochromocytoma (ATCC # CRL-1721). The H4 cell line was cultured in advanced Dulbecco’s modified Eagle’s medium supplemented with 10% fetal bovine serum (FBS), 2.2 mM L-glutamine GlutaMAX-1, and 1% penicillin–streptomycin (PS). The PC12 line was grown in Kaighn’s F-12K media supplemented with 10% FBS, 10% horse serum, and 1% PS. The media and sera were purchased from Invitrogen (Life Technologies, Carlsbad, CA).
To perform the MTT assay and determine the cell proliferation on the substrates, each of the tested samples was placed into one well of a 12-well plate. Cell concentrations of 5 × 10⁵ cells/mL for both the H4 and PC12 cell lines were seeded in each well while adding 2 mL of cell media, followed by incubation at 37 °C for 96 h in a 5% CO2 and 95% relative humidity atmosphere. MTT assays were then performed in accordance with the procedures outlined in Ref. Reference Frewin, Jaroszeski, Weeber, Muffly, Kumar, Peters, Oliveros and Saddow17, with each assay repeated three times and in triplicate for each type of sample and for the PSt control. The results were normalized with respect to the PSt control reading and statistical analysis was performed using ANOVA and the Tukey’s test, with an established statistical significance of P < 0.05. For the cell morphology and evaluation of filopodia and lamellipodia extensions, 12-well plates were also used, and 5 × 10³ cells/mL were seeded under the same environmental conditions. After 48 h, the samples were removed from the media and the cells were fixed using 4% paraformaldehyde and methanol.Reference Frewin, Jaroszeski, Weeber, Muffly, Kumar, Peters, Oliveros and Saddow17 The AFM micrographs were taken in contact mode, and the live cells were immersed in Dulbecco's phosphate-buffered saline (DPBS) solution during the measurements. The AFM images were used to identify the filopodia and lamellipodia by relative height (∼200–300 nm) and to assess spreading on the different surfaces.
III. RESULTS
A. SiC substrate characterization
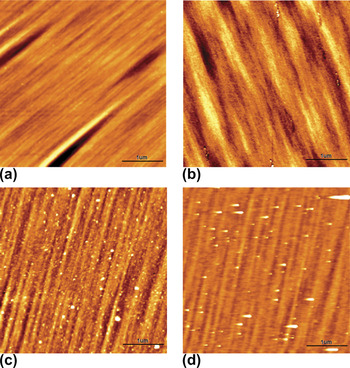
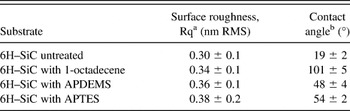
The characterization of SAM-functionalized SiC substrates using x-ray photoelectron spectroscopy, ellipsometry, contact angle measurements, AFM topography, and Fourier transform infrared spectroscopy have been previously reported.Reference Vahlberg, Yazdi, Petoral, Syvajarvi, Uvdal, Spetz, Yakimova and Khranovsky9, Reference Rosso, Arafat, Schroën, Giesbers, Roper, Maboudian and Zuilhof31, Reference Schoell, Hoeb, Sharp, Steins, Eickhoff, Stutzmann and Brandt34, Reference Bhowmick, Linden, Devaux, De Cola and Zacharias42 In this article, we confirmed the characteristics of the functionalized SiC surfaces that are most pertinent to the current study (i.e., topography and wettability) before cell seeding. SWCA measurements give an indication of the degree of hydrophobicity and hydrophilicity of the functionalized substrates. Table I contains the SWCA and RMS roughness values (reported as the statistical mean ± standard deviation of the mean) for the surfaces tested. We observed hydrophobic behavior for the 1-octadecene-treated sample, consistent with molecular methyl end-groups.Reference Rosso, Arafat, Schroën, Giesbers, Roper, Maboudian and Zuilhof31, Reference Sharp, Schoell, Hoeb, Brandt and Stutzmann43 The APDEMS and APTES surfaces were moderately hydrophilic, with values in the expected range for amino end-groups.Reference Faucheux, Schweiss, Lützow, Werner and Groth24, Reference Schoell, Hoeb, Sharp, Steins, Eickhoff, Stutzmann and Brandt34 The untreated sample exhibited hydrophilic behavior, consistent with a native oxide. Surface topography analysis with AFM showed a very smooth surface following etching and before functionalization as seen in Fig. 3(a) with a ∼ 0.3 nm RMS value. The 1-octadecene-treated surface showed a similar topography to the prefunctionalized 6H–SiC surface with no aggregates [See Fig. 3(b)]. On the other hand, on the APDEMS- and APTES-functionalized surfaces, some signs of oligomerization, most likely due to homogeneous methoxy cross-linking, were observed as particulates, and a difference of RMS roughness is obtained with respect to the 6H–SiC substrate [see Figs. 3(c) and 3(d)].
AFM micrographs comparing the morphology of (a) 6H–SiC- and (b) 1-octadecene-functionalized 6H–SiC after alkylation, (c) APDEMS- and (d) APTES-functionalized 6H–SiC after silanization. AFM data were recorded in noncontact mode with scan areas of 5 × 5 μm and the scale bar range is 0–3.5 nm. (color online)

SAM characterization via AFM and SWCA analysis.

a Average surface roughness calculated from 5 × 5 μm scan areas averaged over five scans per surface.
b Contact angles measured with 3 uL water droplets and averaged over three different surface readings.
B. Cell viability and morphology
MTT assays were performed to quantify the cell viability on 6H–SiC (0001) substrates with and without the three SAMs described above. Although both cell lines exhibited qualitatively similar behavior, the PC12 cells showed a generally lower proliferation than the H4 cells. For the H4 cells, the Tukey’s test proved that the mean viability values of 0.44 ± 0.03 and 0.76 ± 0.07 relative to PSt obtained on the unmodified 6H–SiC substrates and on the 1-octadecene-functionalized surfaces, respectively, were statistically similar. These results are in agreement with the lower permissiveness values determined through optical inspection of the cell morphology on these two surfaces. On the other hand, the APDEMS- and APTES-treated surfaces showed dramatic increases in cell viability, exceeding the PSt control surface with mean viability values of 2.14 ± 0.19 and 2.72 ± 0.26 relative to PSt, respectively. These two values were statistically similar, as per the Tukey’s test, but different from octadecene-modified and bare 6H–SiC. Of the two cell lines, the PC12 cells displayed the lowest proliferation on the bare 6H–SiC surface, with a mean viability of only 0.22 ± 0.04 relative to PSt. A statistical difference of the bare 6H–SiC compared to the 1-octadecene-functionalized surface was obtained with the Tukey’s test, with the octadecene-modified surface exhibiting a viability of 0.66 ± 0.06 relative to PSt, an indication that the surface termination clearly affects this cell type. The APDEMS-functionalized surface yielded a 1.26 ± 0.09 proliferation with respect to PSt, whereas cell proliferation after functionalization with APTES was close to 1.86 ± 0.15, much higher than the PSt control. The average cell viability values obtained for the four surfaces tested were significantly different (p < 0.05), which is an indication that the response of the cells to the surface is indeed due to the material with which they are interacting and not to random factors involved in the experiment. More importantly, these results show a statistically significant degree of higher cell proliferation than previous studies performed with PC12 cells on porous SiReference Low, Williams, Canham and Voelcker27 and SAMs on Si and glass substrates.Reference Faucheux, Schweiss, Lützow, Werner and Groth24Figure 4 displays a summary of the cell viability obtained for both cell lines on each of the surfaces tested.
Proliferation of H4 and PC12 cell lines on the (0001) 6H–SiC substrates as a function of surface termination, as determined by MTT assay analysis. Results are normalized to the PSt control well and are expressed as the sample distribution of the mean  $(\bar x)$ and standard error of the mean (σM), normalized to the PSt readings. (color online)

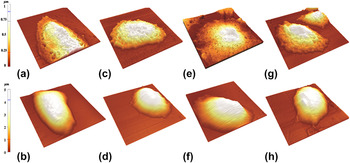
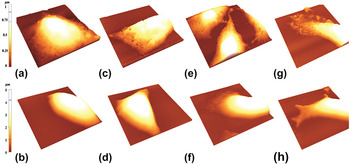
Insight into the cell morphology was obtained via AFM analysis. Figure 5 displays selected AFM micrographs of the H4 cell line for both the unmodified and SAM-modified surfaces, including a living cell and a fixed cell for each (three cells were scanned per surface and a representative image was selected that best illustrates the cell morphology). Figure 6 shows the same for the PC12 cell line. Although some subtle differences in cell morphology exist, both cell lines exhibited certain trends on each type of surface. For the bare 6H–SiC and 1-octadecene-modified surfaces, AFM micrographs showed elongated or rounded cells with few focal points or filopodia and lamellipodia extensions. Indeed, the lamellipodia areas seen on those surfaces were not significant with respect to the total cellular areas (see Figs. 5 and 6). For both cell lines on the APDEMS- and APTES-treated surfaces, cells with elongated shapes that were flattened and expanded over larger surface areas were observed, suggesting good attachment and consistent with the high proliferation observed using MTT assays. Additionally, there was evidence of focal point attachment, filopodia and lamellipodia extensions, as well as intercellular interaction. These results compliment the MTT assays, which showed greater proliferation on these surfaces compared to the untreated and 1-octadecene-modified 6H–SiC surfaces.
AFM micrographs for H4 cells, fixed (top row) and live (bottom row), on the untreated (a) and (b) and modified (c) through (h) 6H–SiC substrates. (a) and (b) are untreated 6H–SiC, (c) and (d) are 6H–SiC after alkoxylation with 1-octadecene, (e) and (f) are 6H–SiC after silanization with APDEMS, and (g) and (h) are 6H–SiC after silanization with APTES. Scan size: 45 × 45 μm. (color online)

AFM micrographs for PC12 cells, fixed (top row) and live (bottom row), on the untreated (a) and (b) and modified (c) through (h) 6H–SiC substrates. (a) and (b) are untreated 6H–SiC, (c) and (d) are 6H–SiC after alkoxyylation with 1-octadecene, (e) and (f) are 6H–SiC after silanization with APDEMS, and (g) and (h) are 6H–SiC after silanization with APTES. Scan size: 45 × 45 μm. (color online)

IV. DISCUSSION
Cell attachment and proliferation on surfaces are the products of many chemical processes occurring between the cell membrane and the underlying substrate in contact with the cell. These involve chemical, morphological, and electrical properties of the surface, as well as cell protein receptor binding and internal cellular reactions, all of which affect the cell–biomaterial interaction.Reference Mrksich and Whitesides44–Reference Dan46 Furthermore, ECM protein adsorption on the substrate, which occurs much more rapidly than cell adhesion, is a key step in the mechanism of cell attachment and spreading.Reference McClary, Ugarova and Grainger6, Reference Faucheux, Schweiss, Lützow, Werner and Groth24, Reference Arima and Iwata47–Reference Ostuni49 In general, cell attachment and proliferation are considered to occur in three stages: (i) protein adsorption onto the substrate from the cell medium, (ii) attachment and spreading of cells on the protein-modified surface, and (iii) remodeling of the surface by the cells through cellular protein generation.Reference Ostuni49 Modification of surfaces with SAMs is thought to primarily impact the first stage since hydrophobic, electrostatic, and chemical interactions between molecular end-groups and proteins in the growth medium significantly alter the orientation, composition, and amount of attached proteins, along with the strength of adhesion.Reference McClary, Ugarova and Grainger6, Reference Faucheux, Schweiss, Lützow, Werner and Groth24, Reference Arima and Iwata47–Reference Ostuni49
In this article, (0001) 6H–SiC surfaces, which are hydrophilic in their untreated state (∼19° SWCA), were modified with 1-octadecene, which possesses hydrophobic methyl end-groups (∼100° SWCA), and APDEMS and APTES, which possess mildly hydrophilic amine end-groups (∼50° SWCA) to determine if these treatments would increase cell viability. Using MTT assays, we found that cell proliferation was significantly higher on the amine-terminated SAMs compared to the methyl-terminated SAMs and untreated surfaces for both cell lines. These findings are in accordance with results obtained on amino-terminated SAMs on other substrates in Refs. Reference Lee, Brass, Morris, Composto and Ducheyne5, Reference Faucheux, Schweiss, Lützow, Werner and Groth24, Reference Low, Williams, Canham and Voelcker27, Reference Naji and Harmand50, and Reference Webb, Hlady and Tresco51.
In addition to the cell proliferation measurements, morphological evaluation of cells provides a criterion to determine if the functionalized surfaces are permissive to cellular attachment and spreading. Elongated and flat cells that are spread out on the surface give an indication of positive cell surface interactions.Reference Coletti, Jaroszeski, Pallaoro, Hoff, Iannotta and Saddow16, Reference Frewin, Jaroszeski, Weeber, Muffly, Kumar, Peters, Oliveros and Saddow17, Reference Naji and Harmand50, Reference Webb, Hlady and Tresco51 On the other hand, large cell height to area ratios (corresponding to cell somata, which are far from the substrate), cell clumps, cells of round shape with small interfacial areas, and/or few lamellipodia extensions are all symptomatic of low substrate permissiveness.Reference Coletti, Jaroszeski, Pallaoro, Hoff, Iannotta and Saddow16, Reference Frewin, Jaroszeski, Weeber, Muffly, Kumar, Peters, Oliveros and Saddow17, Reference Naji and Harmand50 In this work, the cell morphology evaluation on untreated 6H–SiC and 1-octadecene-modified surfaces showed, in general, rounded cell shape and a few elongated flat cells. Additionally, few lamellipodia and filopodia extensions were observed, with evidence on the 1-octadecene-treated surface that cell bodies avoid contact with the surface, a sign that the cells do not find the appropriate conditions to spread and proliferate on the surface. In previous studies using other cell lines on alkylsilane-modified Si surfaces (CH3 end-groups), similar cell morphologies were observed.Reference Lee, Brass, Morris, Composto and Ducheyne5, Reference McClary, Ugarova and Grainger6, Reference Faucheux, Schweiss, Lützow, Werner and Groth24
AFM measurements of cells on both APDEMS- and APTES-treated surfaces showed significantly more elongation and spreading than on the untreated and 1-octadecene-treated surfaces. The spreading and elongation were significantly more pronounced on the APTES-functionalized surfaces. Such cell morphologies indicate spreading, short cell body surface separations, and high adhesion to the surface similar to those reported by Frewin et al.Reference Frewin, Jaroszeski, Weeber, Muffly, Kumar, Peters, Oliveros and Saddow17 for cells seeded on PSt and 3C–SiC. These findings are similar to the cell morphology and cell spreading reported for rat hippocampal neurons,Reference Stenger, Pike, Hickman and Cotman26 PC12, epithelial,Reference Low, Williams, Canham and Voelcker27 and human fibroblast cellsReference Faucheux, Schweiss, Lützow, Werner and Groth24 on different amino-terminated surfaces. An additional study, which utilized fluorescence interference contrast microscopy, also demonstrated short cell surface distances (∼40 nm) of neurons of the dorsal root ganglia from rats on APTES-treated surfaces.Reference Sorribas, Braun, Leder, Sonderegger and Tiefenauer52
It has previously been demonstrated that very little protein adsorption, and essentially no fibronectin or vitronectin adsorption, occurs on nonionic hydrophilic surfaces, such as the untreated 6H–SiC studied here.Reference Faucheux, Schweiss, Lützow, Werner and Groth24 Conversely, significant protein adsorption, including fibronectin and vitronectin adsorption, occurs on both moderately hydrophobic (e.g., NH2-terminal) and highly hydrophobic (e.g., CH3-terminal) surfaces. However, for the case of hydrophobic surfaces, fibronectin receptor function is impaired due to poor fibronectin cell-binding domain accessibility.Reference McClary, Ugarova and Grainger6, Reference Faucheux, Schweiss, Lützow, Werner and Groth24 Furthermore, competitive adsorption of nonbinding proteins, such as serum albumin, reduces the coverage of the ECM proteins, which are important for cell spreading and proliferation on hydrophobic surfaces.Reference Lee, Brass, Morris, Composto and Ducheyne5, Reference McClary, Ugarova and Grainger6, Reference Webb, Hlady and Tresco51 Thus, in terms of wettability, moderately hydrophilic surfaces provide a balance, which allows significant ECM protein adsorption while retaining appropriate integrin function. In addition to protein adsorption, direct cell surface interactions should also be considered. It has been previously reported that cells show a tendency to attach to positively charged surfacesReference Frewin, Jaroszeski, Weeber, Muffly, Kumar, Peters, Oliveros and Saddow17, Reference Van Damme, Taglias, Nemat and Preston45, Reference Dan46 and that surface charge may modulate cell attachment and spreading, as found by Webb et al.Reference Webb, Hlady and Tresco51 in their study of thiols, amines, and quaternary amines. In principle, such an effect could contribute to the differences in cell proliferation observed on untreated CH3- and NH2-terminal surfaces.Reference Lee, Brass, Morris, Composto and Ducheyne5, Reference Webb, Hlady and Tresco51 Although the positive charge present on amine-terminal monolayers in solution may contribute to early stages of cell adhesion via direct electrostatic interaction with the negatively charged glycocalyx on cell surfaces,Reference Van Damme, Taglias, Nemat and Preston45, Reference Dan46 the instability of these end-groups with time, rapid adsorption of both ECM and nonsticking proteins, and modification of surfaces via cellular activity most likely render their direct contributions to cell spreading and proliferation negligible. To affirm that this behavior is general to other cell types, and to ascertain the roles of electrostatic forces and surface chemistry, additional studies on surface-modified SiC will be required. This is particularly important since results tend to vary with different cell types.Reference Lee, Brass, Morris, Composto and Ducheyne5
Even though APDEMS and APTES have identical end-groups (i.e., NH2), the latter showed slightly higher cell proliferation and better permissiveness than the former. Previous studies on Si have demonstrated the superior quality and uniformity of APDEMS-derived monolayers compared to those of APTES; the reduced number of methoxy groups in APDEMS inhibits homogeneous reaction and leads to monolayer, rather than multilayer (∼50 Å), formation.Reference Moon, Shin, Kim and Park53, Reference Hernando, Pourrostami, Garrido, Williams, Gruen, Kromka, Steinmuller and Stutzmann54 However, the APTES surface is suitable for certain applications since it provides excellent cell proliferation along with cell attachment and spreading on different substrates.Reference Lee, Brass, Morris, Composto and Ducheyne5, Reference Sorribas, Braun, Leder, Sonderegger and Tiefenauer52
V. CONCLUSIONS
Although SiC has already seen some implementation in modern medical implants, and previous studies have suggested that SiC is biocompatible with different cell lines, little research has been devoted to enhancing its biocompatibility via surface modification. In this work, we examined the possibility of increasing cellular proliferation and attachment on 6H–SiC (0001) with PC12 and H4 cells using self-assembled organic monolayers with terminal methyl and amino groups. The results obtained from two in vitro techniques, MTT assays and AFM cell morphology inspection, confirmed the characteristics of substrate viability and permissiveness, which were significantly better for the amino (NH2)-terminated surfaces with an increase of ∼5x and ∼3x (APTES and APDEMS, respectively) for PC12 cells and ∼8x and ∼6x (APTES and APDEMS, respectively) for the H4 cell line with respect to the pretreated 6H–SiC substrates.
This study indicates that the application of SAMs on 6H–SiC can greatly increase cell viability and substrate permissiveness while providing the ability to modify specific surface properties. This method allows for direct control of the wettability, surface chemical reactivity, and surface charge, which can directly impact the adsorption of ECM proteins that mediate cell adhesion and spreading. Nevertheless, much work remains to provide truly multifunctional SiC devices for biomedicine. Identification of charge transfer pathways and mechanisms in multicomponent and multiphase systems, including SiC substrates, (bio)organic molecules, and electrolyte environments, is required. In addition, a comprehensive understanding of the effects of surface charge, morphology, and termination on cell growth on the surface must be developed.
ACKNOWLEDGMENTS
The authors would like to thank Dr. Mark Jaroszeski of the USF Chemical and Biomedical Engineering Department for use of his laboratory for the cell culturing and Leigh West of the USF CDD lab for access to the KSV CAM101 system. I.D.S. and S.J.S. acknowledge support of the Technische Universität München—Institute for Advanced Study, funded by the German Excellence Initiative. S.J.S. acknowledges support by the IGSSE and CompInt graduate schools.