INTRODUCTION
In the recent years, the effect of magnetic field on the expansion of laser-produced plasma plume has been the subject of intensive research because of its applicability in various application, e.g., thin film deposition, debris mitigation, development of X-ray-ultraviolet lithographic sources, analytic detection limit enhancement in laser-induced-breakdown-spectroscopy, nanoparticle synthesis, surface modifications etc. (Rai et al., Reference Rai, Rai, Yueh and Singh2003; Harilal et al., Reference Harilal, Tillack, O’Shay, Bindhu and Najmabadi2004, Reference Harilal, O’Shay, Tao and Tillack2007; Sizyuk et al., Reference Sizyuk, Hassanein and Sizyuk2007; Godwal et al., Reference Godwal, Taschuk, Lui, Tsui and Fedosejevs2008; Fazio et al., Reference Fazio, Neri, Ossi, Santo and Trusso2009; Trtica et al., Reference Trtica, Radak, Gakovic, Milovanowic, Batani and Desai2009). The presence of magnetic field may initiate several phenomena in the overall plume dynamics, e.g., confinement, plume compression, adiabatic heating, and onset of instabilities, etc. (Peyser et al., Reference Peyser, Manka, Ripin and Ganguly1992; Kim et al., Reference Kim, Nam, Park, Song and Park2007; Neogi & Thareja, Reference Neogi and Thareja1999; Harilal et al., Reference Harilal, O’Shay, Tillack, Bindhu and Najmabadi2005; Qindeel et al., Reference Qindeel, Bidin and Daud2008; Rafique et al., Reference Rafique, Kaleeq-ur-Rahman, Riaz, Jalil and Farid2008; Shen et al., Reference Shen, Lu, Gebre, Ling and Han2006; Haverkcamp et al., 2009; Kumar et al., Reference Kumar, Singh, Prahlad and Joshi2010a, Reference Kumar, Singh, Prahlad and Joshi2010b).
Time resolved imaging of plasma plume is important in understanding the expansion dynamics of plume in the presence of the magnetic field. Peyser et al. (Reference Peyser, Manka, Ripin and Ganguly1992) found that laser plasma from hollow glass cylinders in magnetic field results in structures. Further, they attributed that E × B is responsible for the jet-like structures, whereas instabilities cause the edge structure. Neogi and Thareja (1996) observed splitting of plume in the presence of an inhomogeneous magnetic field and explained the presence of lobes by considering J × B force acting on the plume. Harilal et al. (Reference Harilal, O’Shay, Tillack, Bindhu and Najmabadi2005) suggested the role of backflow of particles toward the target for the appearance of lobes. Qindeel et al. (Reference Qindeel, Bidin and Daud2008) studied the plume behavior with imaging charge-coupled device for varying magnetic field for Al, Cu, and brass targets. They suggested that plume structure might result from the Lorentz force exerted by the field. Jet-like structures in the plume in the presence of magnetic field has been attributed to instabilities by Rafique et al. (Reference Rafique, Kaleeq-ur-Rahman, Riaz, Jalil and Farid2008). Despite these reports, a comprehensive temporal imaging study with varying field is necessary to understand the field effect. In the present paper, we report temporal intensified charge couple device (ICCD) images with varying field for the lithium plasma.
EXPERIMENTAL
A detailed description of experimental setup has been reported in our previous papers (Kumar et al., Reference Kumar, Chaudhary, Singh, George, Patel and Singh2009). Only the main features and additional parts are briefly summarized. The experiment has been carried out in a cylindrical stainless steel chamber, evacuated to a base pressure < 2 × 10⁻⁵ Torr. The target is 1/2 inch diameter solid pure (99.999%) Li rod. The spot size of the laser beam was set to about 1 mm diameter at the target to achieve average power density of about 109 W/cm2. A pulsed power system consisting of capacitor bank and a wire wound solenoid was used to produce a magnetic field, 400–2800 G (flat-top duration of the magnetic field profile is 40 µs; much larger than the plume duration (Kumar et al., Reference Kumar, Chaudhary, Singh, George, Patel and Singh2009)). An ICCD camera (4 Picos, Stanford Computer Optics, Inc.) having variable gain and gating on time, has been used to record the time resolved images of the plume luminescence in the spectral range of 350–750 nm. In the present experiment, gate opening (integration) time is set at 4 ns. Temporal evolution of the laser produced plasma (LPP) plume has been obtained by varying the time delay between the laser pulse and the opening time of ICCD gate. Five images are recorded under similar experimental conditions. These images are found to be nearly identical in shape and the reproducibility of the emission intensity is better than 5%. A mesh image of known dimensions has been recorded in order to map the geometrical parameters of the plume. For better visibility, gray images have been converted into pseudo-color images using jet color map. To find the emission profile along the direction of plume expansion, plume images are binned along the vertical column of images.
RESULTS AND DISCUSSION
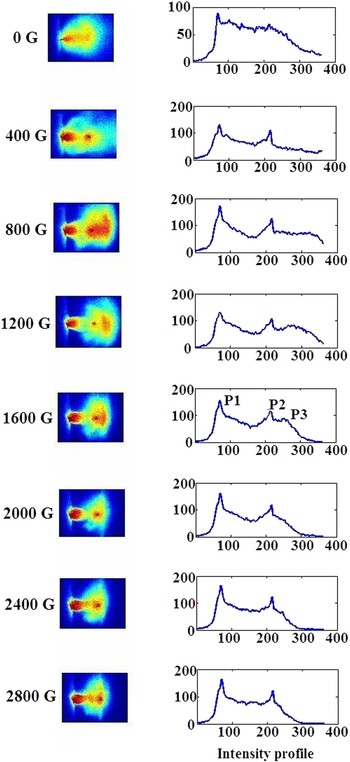
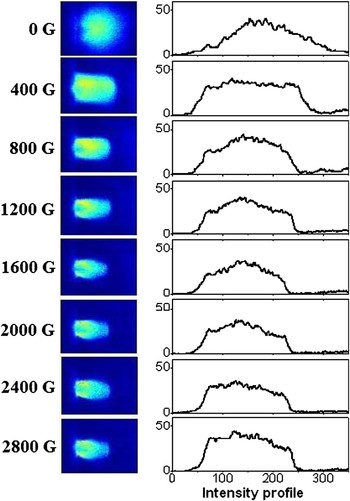
The evolution of the plasma plume across the transverse magnetic field obtained by fast imaging of the electronically excited plume species (driven by collisional processes between electrons, ions, and neutrals generated by laser-solid interaction) can provide the two-dimensional snapshot of the expanding laser-blow-off (LBO) plume. The effect of magnetic field on the dynamics and geometrical shape of the expanding plume can be studied by observing these emissions as a function of time and field strength. The sequences of images at different magnetic field strengths, varying from 0 to 2800 G are shown in Figure 1. These images are recorded in vacuum at time delay of 300 ns with respect to the laser pulse. Each image represents spectrally integrated emission intensity in the region of 350–750 nm emitted from different plume species for a fixed value of magnetic field. In order to get the better presentation of axial variation of emission intensity in presence of magnetic field, the cross-section of the plume emission intensity along the expansion axis is binned and also included in Figure 1.
(Color online) Sequential images recorded with ICCD and corresponding intensity profiles along the expansion axis for different magnetic fields. The time delay is set at 300 ns.

In the absence of the magnetic field, ablation of Li into vacuum produces an intense luminous plume that expands normally to the target surface. The expansion is primarily governed by the initial density/pressure gradient inside the plume and is well explained theoretically in terms of adiabatic and self-similar expansion model (Singh & Narayan, Reference Singh and Narayan1990). The shape and the intensity of the plasma plume are completely modified on introducing the transverse magnetic field. It can be seen that enhancement in the emission takes place when the plume expands in the magnetic field. Initially, in the presence of magnetic field (400 G), the plume is splits into two lobes (P1 and P2) in the direction of expansion. From the binned intensity profile (Fig. 1), the formation of another structure can be clearly observed with increase in the magnetic field (>400 G), and a well-defined third lobe (P3) is clearly visible at 1200 G field. However, P3 diminishing with further increase in the field and almost disappears when the field is >1600 G and finally attains a two lobe structure. Here we rule out the possibility of P2 and P3 being merged. Had the merger caused it, a large enhancement in the emission intensity should have taken place for higher field values, which, of course, is not observed in the present case. Another noticeable observation is that the increase in magnetic field largely affects the leading portion of the plasma plume as compared to the initial portion closer to the target.
Plume splitting in the presence of magnetic field has been observed previously by several authors (Peyser et al., 1991; Kim et al., Reference Kim, Nam, Park, Song and Park2007; Neogi & Thareja, 1999) and they explained this phenomenon on the basis of a fluid magnetohydrodynamics model. According to this model, plasma plume can be treated as a conductive medium, which expands in external magnetic field, and an internal diamagnetic current arises to exclude the field from the interior. This diamagnetic current interacts with the magnetic field through J × B force that accelerates or decelerates different regions of the plasma plume depending on the direction of the diamagnetic current within the plume causing the plume splitting along the expansion direction. It can be noted that the above conclusion drawn in most of the previous reports was on the basis of experimental results with fixed magnetic field. Hence experiments with variable magnetic field are essential to explore the role of J × B force in expanding plasma plume across the transverse magnetic field.
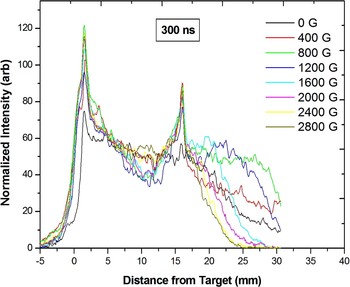
We, therefore, attempted to look more closely at the plume splitting in the magnetic field by investigating the splitting pattern for variable field strength. In this regard, binned emission intensity profiles along the expansion axis corresponding to different magnetic fields are overlapped as shown in Figure 2. Interestingly, the peak positions of P1 and P2 are independent of the field strength and appear at the same axial position for the entire field range. However, the front portion of the plume slowly converges with increasing of the magnetic field. This is an important observation because variation in the separation between two components is expected with the increase in the field, if J × B force is responsible for the splitting. This indicates that instead of J × B force, some other processes should be responsible to produce the above phenomenon.
(Color online) Overlapped intensity profiles for various magnetic fields for 300 ns delay.

Another suggestion for the presence of lobes observed in the imaging study was given by Harilal et al. (Reference Harilal, O’Shay, Tillack, Bindhu and Najmabadi2005) (the observations were carried out at a fixed magnetic field). They estimated the bubble time and found that splitting takes place at longer times than the bubble time, and subsequently attributed it to the backflow of particles. We have also calculated bubble radius and hence calculated bubble time from it. A typical bubble radius
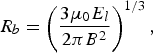
where E l is the laser energy and B is the magnetic field strength. For our experimental parameters and at 400 G field is about 4.2 cm and corresponding bubble time (2R b/v) comes about 760 ns (expansion velocity is about 1.1 × 10⁷ cms−1). As the lobes appear even at the lowest field (400 G) and at 300 ns time delay, we cannot correlate the presence of lobes to the collapse of the bubble and subsequent backflow of particles, as our bubble lifetime is relatively longer.
Another aspect that can result in instabilities is the self-generated magnetic field. The self-generated field can be estimated by (Sharma & Thareja, Reference Sharma and Thareja2007; Schwirzke et al., Reference Schwirzke, Schwarz and Hora1974; Thareja & Sharma, Reference Thareja and Shrama2006)

where k is the Boltzmann constant, T e is the plasma temperature, e is the electronic charge, z is the distance at which field is to be calculated, and v is the expansion velocity of the plume. For our experimental parameters at z = 6 mm distance, we have maximum value of B ~ 80 G, which is much less as compared to our field values. Hence any instability due to the interaction of self generated magnetic field and applied magnetic field can be simply ruled out.
We feel that the magnetic field significantly influences the plasma parameters and hence the associated atomic processes in different regions to different extents in the plume (as the composition changes along the expansion direction) causing the structure formation in magnetic field. The presence of magnetic field increases the electron temperature due to Joule heating (Harilal et al., Reference Harilal, Tillack, O’Shay, Bindhu and Najmabadi2004) and electron density due to magnetic confinement (Rai et al., Reference Rai, Rai, Yueh and Singh2003). Also the plume expansion in the transverse magnetic field may result in the cyclotron motion of electrons and ions. This will significantly increase the probability of electron-atom/ion collisions, which in turn should lead to enhancement in the emission intensity of the expanding plume. Therefore, the overall enhancement in emission intensity will be a net combination from the contributions from electron impact excitation as well as recombination processes.
The individual contribution of different atomic processes can be identified from the computed photoemissivity coefficients (PEC) for ionic and neutral lines (Kumar et al., Reference Kumar, George, Singh and Nampoori2010a; Joshi et al., Reference Joshi, Prahlad, Singh and Kumar2009), using atomic data and analysis structure ADAS (ADAS database). As discussed in our earlier works (Kumar et al., Reference Kumar, George, Singh and Nampoori2010a; Joshi et al., Reference Joshi, Prahlad, Singh and Kumar2009), the intensity of a particular line can be expressed in terms of PEC. In ADAS, it is assumed that the collisional and radiative processes between all excited levels redistribute the populations, and the excited levels are in quasi-static equilibrium with the metastable. The emissivity of an individual line between states j and k for electron impact excitation is given by

and emissivity of an individual line due to recombination is given by

where A j→k is the transition probability for transition between j and k levels, F σexc and F υrec are the effective contributions to the populations of the excited state from metastable σ of the atom and υ of the ion for electron impact excitation and recombination, respectively (electron density and temperature dependent), and N e, N υ, and N σ are electron density, density of ions in metastable υ and density of atoms in metastable σ, respectively. Here it can be noted that recombination includes two body, three body as well as dielectronic contributions. The respective emissivity for electron impact excitation and recombination can be expressed in terms of

and

where PECexc and PECrec are photon emissivity coefficients for electron impact excitation and recombination, respectively, and N e, N i, and N a are electron density, density of ions, and density of atoms, respectively.
From the knowledge of PEC, the intensity of a particular line can be represented by (Joshi et al., 2009; Kumar et al., Reference Kumar, George, Singh and Nampoori2010a)

where K is the factor that depends on the geometry of observation and detector response. Evidently, intensity will depend on (1) electron density (N e), (2) number density of atoms/ions (N a/N i), (3) PECexc and PECrec (photon emissivity coefficients for electron impact excitation and recombination, respectively), and (4) factor K.
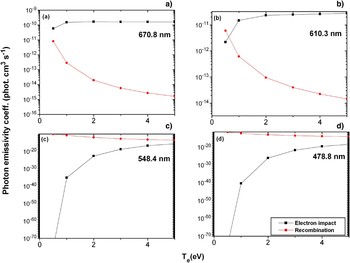
It is known that LPP plume front mainly composed by the energetic ionic species and therefore ionic emission is supposed to form the plume front in the observed images. While the slow moving species dominated by neutrals represent the trailing portion of the plume. The above argument is strongly supported by our optical emission spectroscopic data (Joshi et al., Reference Joshi, Prahlad, Singh and Kumar2009) where strong Li II emission line appeared at shorter time delays as compared to that of Li I emission. Further, it is evident that the typical electron temperature and electron density of Li plasma are around 2 eV and 1017 cm−3 under similar experimental condition (Joshi et al., Reference Joshi, Prahlad, Singh and Kumar2009). In order to get the individual contribution of different atomic processes, we have calculated the PECs for the strongest lines from neutrals (670.8 and 610.3 nm) as well as ions (548.4 and 478.8 nm). PECs for Li I and Li II as function of electron temperature for the both, electron impact excitation and recombination processes are shown in Figure 3. Here it can be noted that recombination includes two-body, three-body as well as dielectronic contributions. ADAS analysis for the ionic line at 548.4 nm demonstrates that the recombination PECs are higher than the electron impact excitation process by an order of magnitude, which mainly contributes to the observed ionic emission in the temperature range of 1–2 eV.
(Color online) Photon emissivity coefficients for electron impact excitation and recombination processes for Li (I) 670.8 and 610.3 nm (upper panel) and Li (II) 548.4, 478.8 nm (lower panel). N e is 1 × 1017 cm−3.

On the basis of above discussion, we conclude that the enhancement in the emission intensity; especially at the plume front and the appearance of elongated leading portion of the plume (P3) in the presence of the magnetic field is mainly due to the increase in excited ionic species by recombination processes. It is likely that with the introduction of the field, confinement may take place, which will result in increased electron density and hence increase the electron-ion recombination.
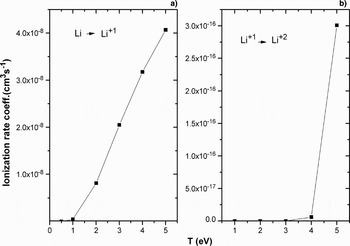
As evident from Figure 3, the contribution from electron impact excitation process is very high for Li I emission as compared to that of recombination process (as PECexc >> PECrec). Therefore, enhancement in the region, which is closer to the target (P1), will mainly be due to the increase in electron impact excitation processes because neutral concentration is higher in this region. This can occur because with increase in the field there will be increase in electron temperature (due to Joule heating) and electron density (by confinement), that will favor the increase in the electron impact excitation process. It can be noticed that with increase in the field, intensity of P1 and P2 increases initially and then start reducing. It can be explained as with increase in field (discussed above) electron density and temperature increases, which will result in the ionization of neutral atoms. It can be seen that ionization of lithium neutrals to Li+ becomes significant in this temperature range (Fig. 4).
Ionization rate coefficient for the Li → Li+ and Li+ → Li++ as a function of electron temperature.

Careful examination of Figure 1 reveals that the magnetic field largely influences the front portion of the plume as compared to that of the trailing part and plume front gradually converges into small volume with further increase in the field. This could be understood as follows. The leading portion of the plume is mainly composed of energetic ions. It appears that ejected ions experience the resistive force in presence of magnetic field and are gradually confined in small volume with increasing the magnetic field. For the present experimental condition, the estimated bubble radii for the magnetic fields of 400 G and 2800 G are 4.2 and 1.15 cm, respectively. The average deceleration (g = v 2/2R) in the presence of 2800 G magnetic field is 5.3.0 × 1013 cm/s2. Here the initial velocity of the plume (v = 1.1 × 107cm/s) is obtained by the plume image at 300 ns in absence of magnetic field. The deceleration is also calculated by considering the plume images in absence and presence of magnetic field using time of flight method. The agreement between the experimentally observed deceleration (~4.0 × 1013 cm/s2) and calculated one suggests the confinement of ion rich plume front in the presence of magnetic field.
Similar analyses were performed for the images taken at 700 ns delay and are shown in Figure 5. The shape of the plume is entirely different from those observed at 300 ns. It can be noted that the emission intensity of the emitting species thermalizes rapidly with increasing the time delay. It appears that emission from the ionic species (front portion of the plume, P2 and P3) is decreased significantly (disappears) and only neutral rich trailing portion of the plume appears at this time delay. This is probably due to the decrease in number density of Li2+ considerably at longer time delay and hence the emission from Li II lines by recombination process will decrease. Further, the excitation of ions by electron impact process is negligible due to the fact that PECexc for ions is an order of magnitude lower than that of neutrals, especially at lower temperature region (as in case of 700 ns). It is also noticed the plume length gradually decreases with increasing the magnetic field. The confinement of neutral species can be understood in the following manner. At 700 ns, plume emission comes from both slow moving neutrals as well as neutral produced by the recombination of ionic species. As we have already discussed, the ionic species experience the resistive force in the presence of magnetic filed, which is reflected in the reduction of emission length from neutrals. Further, the images at 700 ns clearly show that the emission intensity at the edge of the plume (near the pole) is high in the presence of the magnetic field. This is because electron current density at the outer most boundary of the plume is expected to be high in the presence of the magnetic field.
(Color online) Sequence of images at 700 ns along with the corresponding intensity profiles for different magnetic fields.

CONCLUSION
Fast imaging of the laser produced plasma plumes shows that appearance of structures in presence of transverse magnetic field. The feasibility of J × B force to produce the above structures has been validated by the introduction of variable magnetic field. Our findings indicate that instead of J × B force, atomic processes get affected by magnetic field in different regions to different extents causing the structure formation. Evidence of instability or collapse of the bubble has not been found to be the cause of the structures.