- CSN1S1
αs1-casein locus
- CSN1S2
αs2-casein locus
- CSN2
β-casein locus
- CSN3
κ-casein locus
- PCR-RFLP
Polymerase Chain Reaction-Restriction Fragment Length Polymorphism
- AS-PCR
Allele Specific-Polymerase Chain Reaction
- ACRS-PCR
Amplification Created Restriction Site-Polymerase Chain Reaction
Garganica goat is an autochthonous breed, reared on the Gargano promontory, in Apulia region (Southern Italy). This breed is characterized by a high adaptability to climatic extremes and poor pasture of the southern part of the Mediterranean basin. Garganica goat milk is entirely destined for typical Cacioricotta cheese manufacture, obtained using high heat treatment (at 90°C) of whole milk, that allows the recovery of whey proteins, and by ripening time that varies from 1 week to 1 month (Albenzio et al. Reference Albenzio, Caroprese, Marino, Muscio, Santillo and Sevi2006). In the last decade, there has been an increased interest for goat milk not only for cheese production but also as an alternative source of liquid milk (Haenlein, Reference Haenlein2004).
Casein composition in goat, sheep and cow milk is influenced by genetic polymorphisms at the αs1, αs2, β an κ casein loci (Park et al. Reference Park, Juárez, Ramos and Haenlein2007); extensive investigation of goat casein polymorphism revealed the presence of high numbers of alleles on the four casein loci (Roncada et al. Reference Roncada, Gaviraghi, Liberatori, Canas, Bini and Greppi2002; Moioli et al. Reference Moioli, D'Andrea and Pilla2007; Park et al. Reference Park, Juárez, Ramos and Haenlein2007). The polymorphism at αs1 and αs2-CN is associated with different casein synthesis levels; in particular, the amount of αs1-CN plays an important role in milk cheesemaking ability. Also β-CN polymorphism was found to influence the aptitude for coagulation of individual milks (Park et al. Reference Park, Juárez, Ramos and Haenlein2007). Polymorphism attributed to κ-CN is mainly due to glycosilation and phosphorilation degree which affect the susceptibility of κ-CN chains and milk to clotting enzymes (Amigo et al. Reference Amigo, Recio and Ramos2000).
Genetic polymorphisms of milk proteins play an important role in eliciting different degrees of allergic reaction (El-Agamy, Reference El-Agamy2007). Some studies revealed that goat milk (Bevilacqua et al. Reference Bevilacqua, Martin, Candalh, Fauquant, Piot, Roucayroll, Pilla and Heyman2001) can be considered as a proper alternative to human milk due to hypoallergenic properties of its proteins. Animals with mild alleles can be employed to produce milk for allergic subjects while animals with strong alleles can be used to produce milk for the dairy industry (Roncada et al. Reference Roncada, Gaviraghi, Liberatori, Canas, Bini and Greppi2002).
Global casein genotype (αs1, αs2, β and κ-CN) and casein loci interaction could be useful to select animals for milk utilization and could represent a suitable strategy for preserving genotype of Garganica goat breed. Therefore, the aim of this paper was to investigate the casein gene cluster polymorphisms and to screen casein variability at the protein level in the Garganica goat milk.
Materials and Methods
Milk sampling and analyses
Individual milk samples were collected from 71 Garganica goats reared in eight dairy farms located in the Gargano area 60 km northwest of Foggia, Apulia, Southern Italy. Milk samples were analysed for total protein, casein, fat and lactose content using an i.r. spectrophotometer (Milko Scan 133B; Foss Electric, Hillerød, Denmark), and for pH value (GLP 21 Crison, Spain). Somatic cell count (SCC) in milk was determined by a Fossomatic 90 (Foss Electric) apparatus. Renneting parameters [clotting time (r), rate of clot formation (k20), and clot firmness after 30 min (a30)] were measured using a Formagraph (Foss Electric).
Milk DNA analysis
Genomic DNA was extracted from milk according to the procedure described by d'Angelo et al. (Reference d'Angelo, Santillo, Sevi and Albenzio2007). Locus CSN1S1 was analysed by PCR-Restriction Fragment Length Polymorphism (RFPL) and Allele-Specific PCR (Cosenza et al. Reference Cosenza, Pauciullo, Gallo, Colimoro, D'Avino, Mancasi and Ramunno2008). The method used does not differentiate between the A, G, H, I, and 02 alleles; the A* allele could therefore include these genetic variants. The B* allele could include the alleles B1, B2, B3, B4, L, M, which are not distinguishable from the B* allele by PCR-RFLP. Locus CSN1S2 was analysed by PCR-RFPL (Ramunno et al. Reference Ramunno, Cosenza, Pappalardo, Longobardi, Gallo, Pastore, Di Gregorio and Rando2001a, Reference Ramunno, Longobardi, Pappalardo, Rando, Di Gregorio, Cosenza, Mariani, Pastore and Masinab). Because the PCR-RFLP protocol (Ramunno et al. Reference Ramunno, Longobardi, Pappalardo, Rando, Di Gregorio, Cosenza, Mariani, Pastore and Masina2001b) does not allow the detection of the B and C alleles, the A* allele could include these polymorphisms. Locus CSN2 was analysed by Allele-Specific PCR (Sacchi et al. Reference Sacchi, Chessa, Budelli, Bolla, Ceriotti, Soglia, Rasero, Cauvin and Caroli2005) and PCR-RFLP (Pappalardo et al. Reference Pappalardo, Rando, Di Gregorio, Masina and Ramunno1997); the A* allele could include C allele. Locus CSN3 was analysed by Amplification Created Restriction Site-PCR (Feligini et al. Reference Feligini, Cubrik-Curik, Parma, Curik, Greppi and Enne2002), the B* allele included genetic variants C, D, E, F, G.
Two-dimensional electrophoresis
The first dimensional separation was carried out on IPG dry strips (pH 3·9–5·1 and 4–7, 11 cm, Bio-Rad) using an IPG Protean IEF Cell (Bio-Rad, Watford, UK). The individual goat milk samples were centrifuged at 4°C for 30 minutes at 2000× g, the fat layer was discarded and skimmed milk was suspended in isoelectrofocusing IPG sample buffer (ready-Prep Rehydratation/Sample Buffer, Bio-Rad). The dried IPG strips were actively rehydrated at 50 V with samples for 2 h; the following voltage gradient was applied: 250 V for 1·5 h; from 250 to 4000 V for 1 h; and 4000 V for 4 h. After IEF, strips were equilibrated for 10 min in a solution containing 0·375 m-Tris–HCl (pH 8·8), 6 m-urea, 200 ml glycerol/l, 20 g SDS/l and 20 g DTT/l, followed by a second bath with the same solution but with 45 g iodoacetamide/l instead of DTT.
The second-dimensional separation was performed on a Protean II xi vertical slab gel unit (Bio-Rad) using 12% acrylamide separating gels at a voltage of 280 V. A broad range molecular weight electrophoresis calibration kit (Bio-Rad) was used as standard. Gels were fixed and stained with R250 Coomassie blue (Bio-Rad). The de-stained gels were acquired by means of the Gel Doc EQTM system (Bio-Rad) using a white light conversion screen.
Statistical Analysis
The Arlequin package (Excoffier & Schneider, Reference Excoffier, Laval and Schneider2005) was used to estimate allelic frequencies, linkage disequilibrium between casein loci, and exact test of sample differentiation based on haplotype frequency. EH software (Xie & Ott, Reference Xie and Ott1993) was used to estimate haplotype frequencies.
On the basis of the exact test of sample differentiation on haplotype frequency goat dairy farms were clustered into two groups. The effects of the groups were tested on milk chemical composition and clotting parameters by using the GLM procedure of SAS (SAS Institute, 1999). The variables were tested for normal distribution using the Shapiro-Wilk test (Shapiro & Wilk, Reference Shapiro and Wilk1965). The model used was (eq. 1):

where: μ is the overall mean; α is the effect of the haplotype for αs1, αs2 and β loci (i=2); and ε is the error.
The statistical analysis of coagulation properties was performed using the following model of multiple covariance analysis (eq. 2):

where μ is the overall mean; α is the effect of the genotype at αs1, αs2 and β loci (i=37); and ε is the error; b is the regression coefficient of dependent variable on somatic cell count b1x1, on casein b2x2, fat b3x3, protein b4x4, and lactose content b5x5.
Results and Discussion
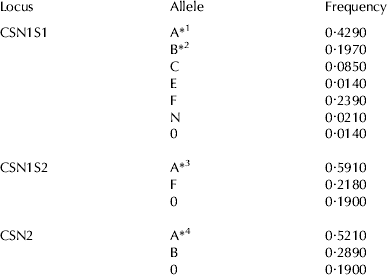
The allelic frequencies observed in Garganica goat breed at the casein loci (CSN1S1, CSN1S2, CSN2) are reported in Table 1. CSN3 locus was monomorphic for the B* allele, according to the nomenclature proposed by Yahyaoui et al. (Reference Yahyaoui, Angiolillo, Pilla, Sanchez and Folch2003). At CSN1S1 the allele A* was predominant in the population investigated. The alleles C and F showed frequencies which are in agreement with those observed in the Garganica goat breed by Sacchi et al. (Reference Sacchi, Chessa, Budelli, Bolla, Ceriotti, Soglia, Rasero, Cauvin and Caroli2005). In this study the presence of the null alleles N and 01 was found which had been never observed before in this breed, these alleles having been only observed in the Northern goat breeds (Sacchi et al. Reference Sacchi, Chessa, Budelli, Bolla, Ceriotti, Soglia, Rasero, Cauvin and Caroli2005).
Allelic frequencies in Garganica goat population. CSN3 is monomorphic for the B* allele
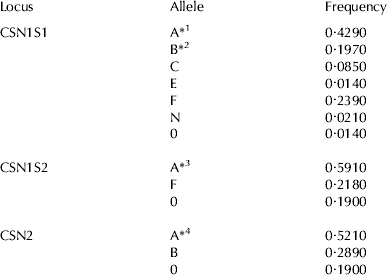
1 A*=CSN1S1*A+CSN1S1*G+CSN1S1*H+CSN1S1*I+CSN1S1*02
2 B*=CSN1S1*B1+CSN1S1*B2+CSN1S1*B3+CSN1S1*B4+CSN1S1*L+CSN1S1*M
3 A*=CSN1S2*A+CSN1S2* B+CSN1S2*C+CSN1S2*E
4 A*=CSN2*A+CSN2*C
At CSN1S2 the allele A* showed the highest frequency followed by the F and null allele; Sacchi et al. (Reference Sacchi, Chessa, Budelli, Bolla, Ceriotti, Soglia, Rasero, Cauvin and Caroli2005) observed in Garganica breed the predominance of the allele F and the absence of the null allele. At CSN2 locus the allele A* was predominant, and high frequencies of the B and 0 alleles were also observed.
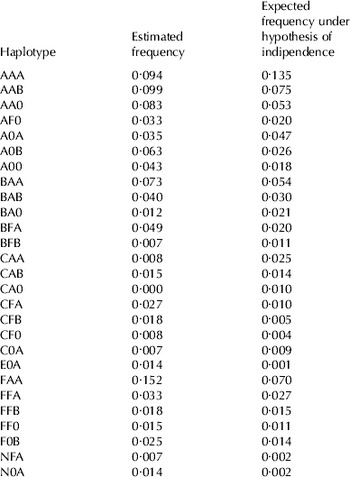
The casein haplotype frequencies and the expected frequencies under the hypothesis of independence are shown in Table 2. A total of 6 haplotypes (frequency >0·05) were observed; the haplotype FAA (CSN1S1F-CSN1S2*A-CSN2*A) was the predominant one, followed by the haplotypes AAB and AAA. The other haplotypes observed showed frequencies lower than 0·09. The expected frequency of the haplotype AAA was higher than 0·1 and also higher than the estimated frequency, whereas the other haplotypes showed an expected frequency lower than the estimated value.
Estimated and expected (under hypothesis of independence) frequencies of haplotypes (CSN1S1-CSN1S2-CSN2) observed in Garganica goat population. CSN3 is monomorphic for the B* allele
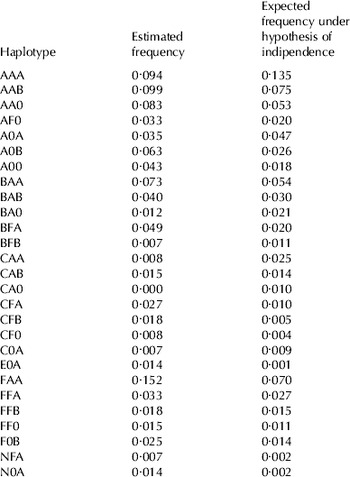
The χ2 test showed significant difference from the null hypothesis (no association), indicating the presence of linkage disequilibrium in the breed. Pair-wise linkage disequilibrium showed significant (P<0·05) values among CSN1S1 and CSN1S2 loci in Garganica goats in contrast with the findings of Sacchi et al. (Reference Sacchi, Chessa, Budelli, Bolla, Ceriotti, Soglia, Rasero, Cauvin and Caroli2005) probably due to the higher haplotype number reported by these authors.
According to Sacchi et al. (Reference Sacchi, Chessa, Budelli, Bolla, Ceriotti, Soglia, Rasero, Cauvin and Caroli2005) Garganica breed is similar both to the European Northern breeds for the high frequency of the weak F allele at CSN1S1 locus and to the Mediterranean breeds at the CSN2 locus showing a predominance of the strong alleles and a moderate frequency of the null allele (Chessa et al. Reference Chessa, Budelli, Chiatti, Cito, Bolla and Caroli2005).
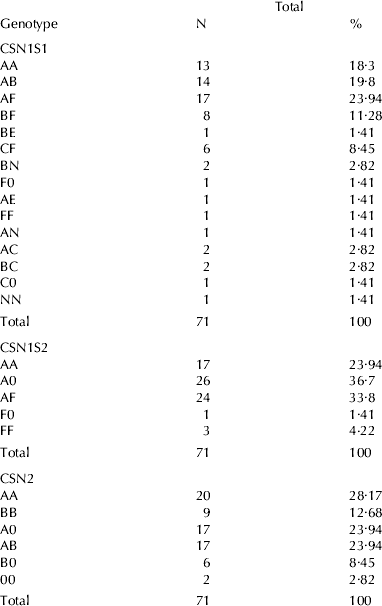
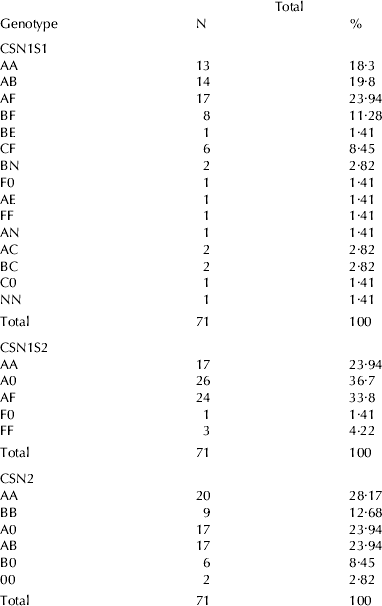
The distribution of Garganica goats by CSN1S1, CSN1S2, and CSN2 genotype is shown in Table 3. AF genotype was the most frequent followed by AA, AB, and BF in CSN1S1. A0 genotype was the most common followed by AF and AA in CSN1S2. In CSN2 the AA genotype was the most frequent followed by A0, AB, and BB. The percentage of the other genotype was less than 10%. Although a complex distribution of genotype on casein loci was observed, the exact test of sample differentiation based on haplotype frequencies grouped the eight farms investigated into two clusters characterized by the highest frequency of strong (S-CSN1S1) or weak (W-CSN1S1) alleles at CSN1S1. The most frequent haplotype were AAB (0·14 872) in S-CSN1S1 and FAA (0·24 279) in W-CSN1S1 and showed an expected frequency lower than the estimated value (0·13281 and 0·13837 in S-CSN1S1 and W-CSN1S1, respectively). The χ2 test did not show significant difference from the null hypothesis (no association) in the group W-CSN1S1, indicating the lack of evidence for linkage disequilibrium. Pair-wise linkage disequilibrium showed significant (P<0·05) values between CSN1S1 and CSN2 loci only in the S-CSN1S1 group.
Distribution of Garganica goats by CSN1S1, CSN1S2, and CSN2 genotypes
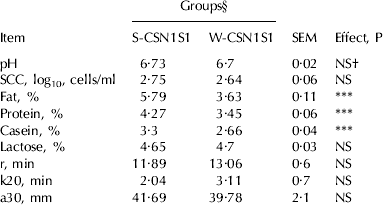
Differences in haplotype frequencies in the two groups are explained by the occurrence of strong or weak alleles at CSN1S1; this locus is able to discriminate the two groups owing to its high polymorphism. It is recognized that different variants are associated with different rates of αs1 casein synthesis (Martin et al. Reference Martin, Szymanowska, Zwierzchowski and Leroux2002). Eight of the currently identified alleles in goat milk (A, B1, B2, B3, B4, C, H, and L) are associated with high levels of αs1-CN (3·5 g/l milk), two (E and I) with medium levels (1·1–1·7 g/l), and two (F and G) with low levels (0·45 g/l). The 01, 02, and N are ‘null’ alleles and produce no αs1-CN in goat milk. Accordingly, protein and casein contents were higher (P<0·001) in the group characterized by strong allele than in the group with weak allele at CSN1S1 (Table 4). Casein genotype also influenced milk fat content (P<0·001) as reported by Zullo et al. (Reference Zullo, Barone, Chianese, Colatruglio, Occidente and Matassino2005) who found that milk characterized by strong alleles showed higher content of casein, fat and protein as well as greater coagulation properties. However, no significant differences in coagulation properties of milk where found between the two groups in the present study. Mean values of clotting time, rate of clot formation and curd firmness tended to be greater in S-CSN1S1 than in W-CSN1S1 as the quantity of total caseins is positively correlated with the amount of the αs1-CN (Grosclaude Reference Grosclaude1988). Accordingly, previous work showed that milk components and αs1-CN specifically, improve coagulation properties (Clarke & Sherbon, Reference Clark and Sherbon2000).
Gross composition and coagulation properties of milk from the two groups
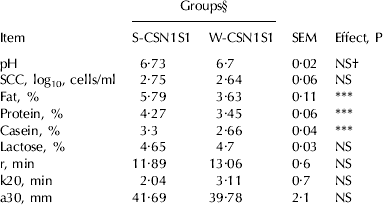
§ S-CSN1S1=Group with high frequency of strong allele at CSN1S1;
W-CSN1S1=Group with high frequency of weak allele at CSN1S1
† NS, not significant, *** P<0·001
r, clotting time; k20, rate of clot formation; and a30, curd firmness at 30 min
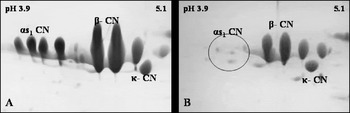
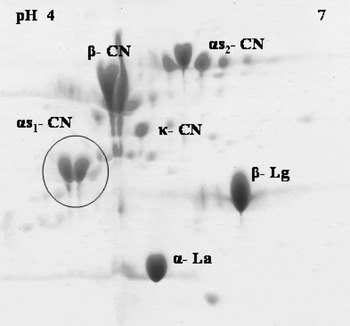
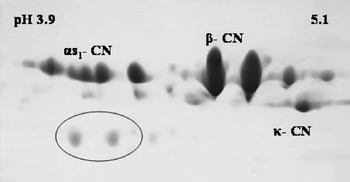
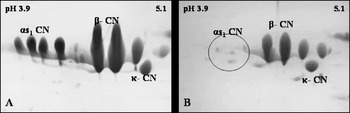
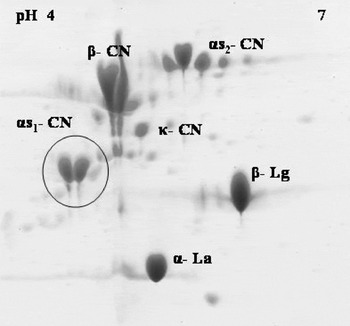
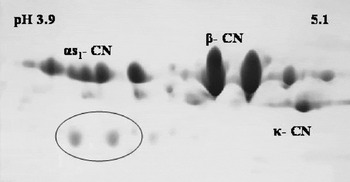
The 2D electrophoresis was performed to evaluate the protein profile in milk in association with global casein genotype (αs1, αs2, β and κ-CN). The protein profile resulting from 2D-PAGE separation of casein fraction evidenced for AB genotype four spots (Fig. 1A) of equal intensity of αs1-CN whereas no spots were observed for the same casein in the milk sample with null genotype (Fig. 1B). The 2D-electrophoretogram of individual milk sample displaying FF genotype of CSN1S1 (Fig. 2) showed defined characteristics: two spots in the corresponding pI but at a lower molecular weight than those generally ascribed to CSN1S1 alleles were found due to the deletion of 37 amino acids, derived from an abnormal processing of the primary transcript (Leroux et al. Reference Leroux, Mazure and Martin1992). In Fig. 3 five spots in the area of αs1-CN plus two spots at lower molecular weight are shown as a result of BF genotype being expressed as co-dominant alleles. The αs1-CN polymorphism has great interest in goat breeding due to its relationship with production traits, milk composition, and utilisation. Goat milk from animals possessing strong alleles contains significantly more total caseins than milk from animals with weak or null alleles and can be used to produce milk for dairy industry. Cheese yield observed in the milk produced by AA genotype animals was 15% higher compared with that of FF genotype (Vassal et al. Reference Vassal, Delacroix-Buchet and Buillon1994).
2-D PAGE (IPG strip, pH 3·9–5·1) of goat milk with AB CSN1S1 AA CSN1S2 AB CSN2 B CSN3 genotype (A) and of goat milk with NN CSN1S1 AF CSN1S2 AB CSN2 B CSN3 genotype (B). Note that the lack of αs1-CN is represented as a grey circle.
2-D PAGE (IPG strip, pH 4–7) of goat milk with FF CSN1S1 AF CSN1S2 A0 CSN2 B CSN3 genotype; αs1-CN spots at lower molecular weight are represented in a grey circle.
2-D PAGE (IPG strip, pH 3·9–5·1) of goat milk with BF CSN1S1 AF CSN1S2 AA CSN2 B CSN3 genotype. Note that αs1-CN spots at lower molecular weight are represented in a grey circle.
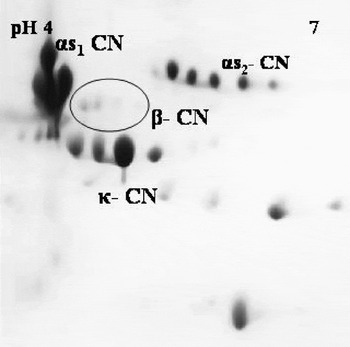
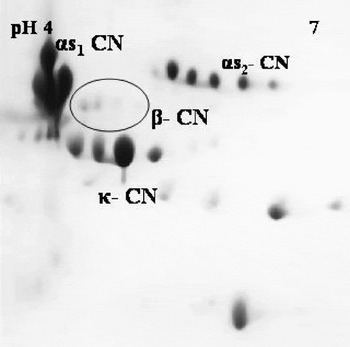
The AA and AB genotypes at CSN2 showed two spots (Fig. 1 & 3) whereas null genotype lacked a protein spot (Fig. 4). Studies about the aptitude for coagulation of individual milk with null β-CN showed that longer rennet coagulation times were needed than for normal milk and weaker curd firmness occurred (Park et al. Reference Park, Juárez, Ramos and Haenlein2007). Intermediate A0 CSN2 showed a different number of protein spots along with CSN1S1: three spots of equal intensity were found for β-CN when weak FF genotype was detected on CSN1S1, whereas only one spot was found in combination with strong AA CSN1S1 genotype. The diminished level of expression in FF CSN1S1 could have been counter balanced by an increase in the level of β-CN.
2-D PAGE (IPG strip, pH 4–7) of goat milk with AA CSN1S1 AF CSN1S2 00 CSN2 B CSN3 genotype. Note that the lack of β-CN is represented as a grey circle.
The results of covariance analyses (Table 5) showed that all the considered covariates, except fat content, significantly influenced clotting time, whereas only genotype influenced rate of clot formation, and all the tested covariates influenced clot firmness at 30 min. Genotype was the factor that accounted for 13·99, 31·89 and, 15·31% of the variability explained by the full model for r, k20 and a30, respectively. On the basis of estimated and corrected means for all the covariance, goat milk containing at least one null type genetic variant, i.e. A0 and 00 CSN2, showed poor curd firmness (13·88±5·34 mm and 22·41±6·3 mm, respectively). Accordingly Park et al. (Reference Park, Juárez, Ramos and Haenlein2007) found that A0 CSN2 genotype showed weaker curd firmness impairing cheese making ability. Moreover, milk that contained at least one strong type variant tended to have better coagulation properties than milk devoid of CSN1S1 (Clark & Sherbon, Reference Clark and Sherbon2000); indeed, AB CSN1S1 showed lower values of clotting time (12·24±1·80 min) than NN CSN1S1 (18·41±1·44 min).
Variability percentage explained by each factor and by the full model

NS not significant, *P<0·05; **P<0·01; ***P<0·001
r, clotting time; k20, rate of clot formation; and a30, curd firmness at 30 min
Seven alleles have been identified for αs2-CN which are associated with three different casein synthesis levels. A, B, C, E and F alleles produce normal αs2-CN contents (2·5 g/l), the D allele causes reduced αs2-CN content and the 0 allele has no detectable amount of this casein in goat milk (Lagonigro et al. Reference Lagonigro, Pietrola, D'Andrea, Veltri and Pilla2001; Ramunno et al. Reference Ramunno, Cosenza, Pappalardo, Longobardi, Gallo, Pastore, Di Gregorio and Rando2001a, Reference Ramunno, Longobardi, Pappalardo, Rando, Di Gregorio, Cosenza, Mariani, Pastore and Masinab). In the present work genotype AA, AF, A0 and F0 of CSN1S2 have been detected; both AA and AF displaying five spots of equal intensity in 2D-PAGE (Fig. 4). A0 genotype showed two spots as intermediate phenotype expression probably due to incomplete dominance of the strong A and null allele. Natale et al. (Reference Natale, Bisson, Monti, Peltran, Perono Garoffo, Valentini, Fabris, Bertino, Coscia and Conti2004) found that the prevalence of sensitization to αs2-CN fraction in cow milk was 90% in children younger than two years of age. The role of goat milk in preventing milk protein allergy is controversial: some studies revealed that goat can be considered a proper alternative to human milk due to ipoallergenic properties of its proteins (Bevilacqua et al. Reference Bevilacqua, Martin, Candalh, Fauquant, Piot, Roucayroll, Pilla and Heyman2001). Other studies showed that goat milk cannot be useful in all cases as alternative to human milk, because it can be as allergic as cow milk (Haenlein, Reference Haenlein2004). These controversial data could be ascribed to the high heterogeneity of the casein fraction in goat milk. Even though the principal proteins in goat milk are the same as in the milk of other species, the relative proportion of the four major caseins in goat milk varies widely between individual animals. It was found that genetic polymorphism of milk proteins also plays an important role in infant diet because milk from animals possessing mild alleles can be employed to produce milk for allergic subject (Roncada et al. Reference Roncada, Gaviraghi, Liberatori, Canas, Bini and Greppi2002). In the present survey Garganica population seems to have a potential for developing this selection line being weak allele F for CSN1S1 highly frequent and the null allele first observed, as well as A0 genotype for CSN1S2 being the most frequent. Selecting Garganica population for different casein genotypes, i.e. weak or null for αs1 and αs2-CNs, could therefore offer advantages in reducing risk of food allergy.
In conclusion, the variability of casein loci in Garganica goat milk could be exploited to differentiate the population on the basis of milk utilisation. Owing to its high polymorphism CSN1S1 was found to be able to cluster Garganica goat population into two groups distinguishable on the basis of total casein level.
Goat milk containing at least one null type genetic variant for CSN2 showed poorer coagulation properties; it could be therefore useful to select animals with strong alleles at CSN1S1 and CSN2 destined to produce milk for cheesemaking. Animals with weak or null alleles for CSN1S2 and CSN1S1 should be used in breeding programs aimed at producing milk with hypoallergenic properties. Complete definition of casein genotype and protein profile in Garganica goat milk is required for optimizing breeding programs for specific production, and could represent a suitable strategy for preserving genotype of this autochthonous breed.