Introduction
In 2000, depression was the leading cause of non-fatal disease burden in the world (Üstün et al. Reference Üstün, Ayuso-Mateos, Chatterji, Mathers and Murray2004) and is projected to remain among the top three causes of burden of disease in coming decades (Mathers & Loncar, Reference Mathers and Loncar2006). The lifetime risk of major depressive disorder (MDD) is nearly two times higher for women than for men (Kessler et al. Reference Kessler, McGonagle, Zhao, Nelson, Hughes, Eshleman, Wittchen and Kendler1994) and, within a woman's lifetime, the childbearing years represent a period of increased vulnerability (Burke et al. Reference Burke, Burke, Rae and Regier1991). The point prevalence of depression during pregnancy is similar to that during the postpartum period, with estimates ranging from 8 to 13% (O'Hara et al. Reference O'Hara, Zekoski, Philipps and Wright1990; Cox et al. Reference Cox, Murray and Chapman1993; Evans et al. Reference Evans, Heron, Francomb, Oke and Golding2001; Gavin et al. Reference Gavin, Gaynes, Lohr, Meltzer-Brody, Gartlehner and Swinson2005).
As in non-puerperal MDD, psychosocial stressors clearly associate with an increased risk for perinatal depressive symptoms (Paykel et al. Reference Paykel, Emms, Fletcher and Rassaby1980; O'Hara et al. Reference O'Hara, Rehm and Campbell1983, Reference O'Hara, Neunaber and Zekoski1984; Gotlib et al. Reference Gotlib, Whiffen, Wallace and Mount1991; Brett & Barfield, Reference Brett and Barfield2008). While there are several studies of biological factors associated with postpartum depression (Wisner & Stowe, Reference Wisner and Stowe1997; Bloch et al. Reference Bloch, Daly and Rubinow2003; Yonkers et al. Reference Yonkers, Vigod and Ross2011), fewer have addressed biomarkers for depression during pregnancy (Oretti et al. Reference Oretti, Hunter, Lazarus, Parkes and Harris1997; Bunevicius et al. Reference Bunevicius, Kusminskas, Mickuviene, Bunevicius, Pedersen and Pop2009; King et al. Reference King, Chambers, O'Donnell, Jayaweera, Williamson and Glover2010; Meltzer-Brody et al. Reference Meltzer-Brody, Stuebe, Dole, Savitz, Rubinow and Thorp2010). Numerous studies suggest that the impact of depression during pregnancy upon infant health, presumably mediated by in utero epigenetic programming, may exceed that of postnatal depression (Talge et al. Reference Talge, Neal and Glover2007; Brennan et al. Reference Brennan, Pargas, Walker, Green, Jeffrey Newport and Stowe2008; van den Bergh et al. Reference van den Bergh, van Calster, Smits, van Huffel and Lagae2008; Marcus et al. Reference Marcus, Lopez, McDonough, Mackenzie, Flynn, Neal, Gahagan, Volling, Kaciroti and Vazquez2010; Rothenberger et al. Reference Rothenberger, Resch, Doszpod and Moehler2011). Consequently, there is a great need for better understanding of the pathophysiology of antenatal depression and potential biomarkers. In light of the vast literature regarding a pathophysiologic link between depression and dysregulation of the hypothalamic-pituitary-adrenal (HPA) axis, and the substantial alterations in maternal HPA function across the course of normal gestation, Kammerer et al. (Reference Kammerer, Taylor and Glover2006) hypothesized that depression during pregnancy may result, at least in part, from altered HPA axis regulation in vulnerable women (Kammerer et al. Reference Kammerer, Taylor and Glover2006).
During pregnancy, circulating levels of maternal glucocorticoids increase in parallel with the rising gonadal steroids. In addition, cortisol produces feed forward effects on placental release of corticotropin-releasing hormone (CRH), which, in turn, further stimulates adrenal cortisol secretion. Several physiological mechanisms are in place to buffer the effects of increased maternal cortisol levels. For example, parallel increases in the prenatal expression of corticosteroid binding globulin largely sequester the substantial prenatal increase in circulating cortisol (Bloch et al. Reference Bloch, Daly and Rubinow2003); nevertheless, free cortisol concentrations continue to rise, necessitating other buffering mechanisms (Carr et al. Reference Carr, Parker, Madden, MacDonald and Porter1981). Elevated progesterone levels partially attenuate the effects of rising free cortisol levels via competitive inhibition at the glucorticoid receptor (GR) (Rousseau et al. Reference Rousseau, Baxter and Tomkins1972; Duncan & Duncan, Reference Duncan and Duncan1979; Keller-Wood et al. Reference Keller-Wood, Silbiger and Wood1988). Diminished GR sensitivity in the second and third trimesters, as indicated by dexamethasone suppression test (DST) results, also attenuates the effect of elevated free cortisol (Greenwood & Parker, Reference Greenwood and Parker1984; Smith et al. Reference Smith, Owens, Brinsmead, Singh and Hall1987; Allolio et al. Reference Allolio, Hoffmann, Linton, Winkelmann, Kusche and Schulte1990; O'Hara et al. Reference O'Hara, Schlechte, Lewis and Varner1991). Given the complexity of altered responses of the HPA axis during pregnancy, and the many levels of compensatory regulation, we hypothesize that small differences in mechanisms that compensate for elevated free cortisol during pregnancy could contribute to risk for development of maternal depressive symptoms.
Cortisol signaling through the GR is orchestrated by a series of chaperone proteins, co-chaperone proteins and transcription factors. Specifically, these molecules regulate the folding and maturation of the GR, its affinity for cortisol, intracellular transport and binding of the GR complex to DNA elements in target genes and the recycling of GR (for review see Grad & Picard, Reference Grad and Picard2007). The balance of function among these proteins modulates the downstream gene expression in target cells elicited by cortisol binding at the GR. Because the expression of some of these GR-regulating molecules can be induced by glucocorticoids and gonadal steroids (Tang et al. Reference Tang, Gannon, Andrew and Miller1995; Kumar et al. Reference Kumar, Mark, Ward, Minchin and Ratajczak2001; Hubler et al. Reference Hubler, Denny, Valentine, Cheung-Flynn, Smith and Scammell2003; Hubler & Scammell, Reference Hubler and Scammell2004), the levels of which are rising over the course of pregnancy, they are, on the one hand, prime candidates as mediators of gestational changes in GR-sensitivity and, on the other hand, putative molecular markers for depression-related changes in steroid receptor function.
Interestingly, the profile of increased cortisol release and relative GR insensitivity during pregnancy resembles the endocrine abnormalities often observed in non-puerperal MDD (Holsboer, Reference Holsboer2000; Pariante & Miller, Reference Pariante and Miller2001). The aims of the current study were to test whether: (i) whole blood gene expression of chaperones and co-chaperones of the GR or related transcription factors changes during pregnancy and whether such changes associate with maternal depressive symptoms; (ii) whether differences in plasma levels of cortisol or sex steroids accompany either depression-associated differences in gene expression or differences in GR sensitivity. The study focused on a clinical sample of women at high risk for depressive symptoms during pregnancy secondary to a lifetime history of mood or anxiety disorders.
Method
Subject ascertainment and assessment
Women with a lifetime history of a mood and/or anxiety disorder, recruited through self-referral or referral from community obstetrical or psychiatric practices, were enrolled in a longitudinal investigation at the Emory Women's Mental Health Program supported by the Specialized Center for Research on Sex and Gender Effects (P50 MH 68036). Inclusion criteria for this mRNA expression sub-study were: (1) enrollment between March 2005 and December 2007; (2) lifetime history of an Axis I mood or anxiety disorder as defined by the Diagnostic and Statistical Manual of Mental Disorders, Fourth Edition (DSM-IV; First et al. Reference First, Spitzer, Gibbon and Williams1995); (3) taking no psychotropic medication for at least 2 weeks before a minimum of one blood draw; (4) preconception or currently pregnant (<24 weeks gestation based on last menstrual period); (5) able to give written informed consent for research participation as approved by the Emory University Institutional Review Board. Women were excluded if they: (1) were actively suicidal; (2) exhibited current psychotic symptoms; (3) were severely anemic; (4) had a positive urine drug screen; (5) had an abnormal thyroid stimulating hormone; or (6) were abusing alcohol or drugs in the past 12 months. For ex-vivo GR sensitivity measures, women treated with a selective serotonin reuptake inhibitor at a stable dose for at least 2 weeks were also included.
A DSM-IV primary diagnosis and co-morbid diagnoses were established at enrollment using the Structured Clinical Interview (First et al. Reference First, Spitzer, Gibbon and Williams1995). The severity of depressive symptoms was assessed at each visit using the Beck Depression Inventory (BDI) (Beck et al. Reference Beck, Ward, Mendelson, Mock and Erbaugh1961). Consistent with our recent report establishing a BDI cut-point to identify patients likely to fulfill DSM-IV criteria for depression during pregnancy (Ji et al. Reference Ji, Long, Newport, Na, Knight, Zach, Morris, Kutner and Stowe2010), we utilized a BDI cut-point of ⩾15 in the current study.
Biological samples
Samples were collected by standard venepuncture and frozen at −20°C until RNA extraction or −80°C until plasma hormone assay. Fresh blood from a group of 29 women was processed immediately after collection for use in the ex vivo bioassay of GR sensitivity.
RNA extraction and quantification by real-time polymerase chain reaction
Blood for RNA extraction was collected directly into either PAXgene blood tubes (PreAnalytix, Switzerland) or Tempus blood RNA tubes (Applied Biosystems Inc., USA). RNA extraction was performed using a modified protocol (available upon request) from the Versagene RNA Purification Kit for Cell Culture in a 96-well format (Gentra Systems Inc., USA).
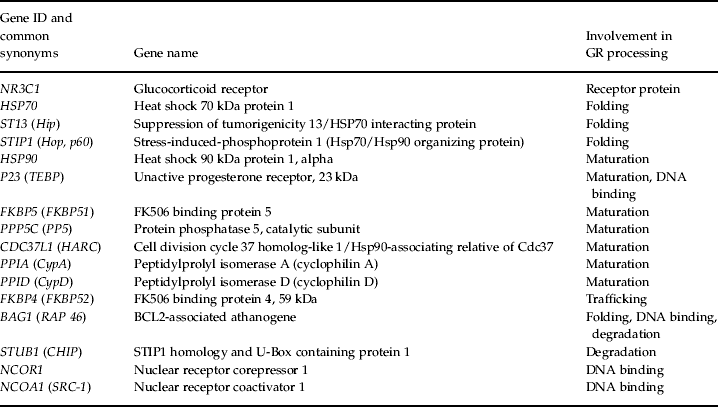
Total RNA was reverse transcribed according to the manufacturer's protocol using the cDNA Archive kit (Applied Biosystems Inc.) and the resulting cDNA was quantified using the Quant-it Picogreen Kit (Invitrogen, USA). Each sample was diluted to 0.5 ng/μl and plated in duplicate into 384-well plates for assay on a 7900HT real-time polymerase chain reaction (RT-PCR) system using Taqman human gene expression assays (Applied Biosystems Inc.) for transcripts listed in Table 1. The assay IDs used in this study were: BAG1-Hs00185390_m1; CDC37L1-Hs00215561_m1; FKBP4-Hs00427038_g1; FKBP5-Hs00188025_m1; NCOA1-Hs00186661_m1; HSP90AA1-Hs00743767_sH; HSPA1A;HSPA1B-Hs00271229_s1; NCOR1-Hs01094540_m1; NR3C1-Hs00230818_m1; PPIA-Hs99999904_m1; PPID-Hs00234593_m1; PPP5C-Hs00196577_m1; PTGES3-Hs00832847_gH, RPLP0-Hs99999902_m1, ST13-Hs00832556_sH, STIP1-Hs00428979_m1; STUB1-Hs00195300_m1; TFRC-Hs99999911_m1. For quality control, concordance of duplicates was assessed and samples with a crossing threshold (CT)>35 and s.d.>0.25 CTs apart in each duplicate pair were excluded from further analyses.
Transcripts of interest including their role in glucorticoid receptor (GR) processing

Raw fluorescence data were used to estimate the polymerase chain reaction (PCR) efficiency for each reaction using the LinRegPCR program (Ramakers et al. Reference Ramakers, Ruijter, Deprez and Moorman2003). Mean assay-specific efficiencies were then used in conjunction with the CT values to calculate relative ratios of the target mRNA to that of the endogenous control gene, RPLP0 (Ramakers et al. Reference Ramakers, Ruijter, Deprez and Moorman2003; Karlen et al. Reference Karlen, McNair, Perseguers, Mazza and Mermod2007). CT values were calculated using default settings within the RQ Manager version 1.2 software (Applied Biosystems Inc.). We observed a systematic difference in the magnitude but not the direction of gene-expression regulation over pregnancy in the positive control gene (TFRC) between samples collected in PAXgene versus Tempus tubes. To address this bias, we performed a Z score transformation on the raw data for each type of tube. This type of correction is commonly utilized in studies of gene expression data derived from different batches of extracted RNA or different assay platforms (Cheadle et al. Reference Cheadle, Vawter, Freed and Becker2003). All values were normalized first to the endogenous control gene, RPLP0, and subsequently normalized to the mean of the preconception values.
Selection of endogenous and positive control genes
In order to identify an appropriate endogenous control gene for the RT-PCR assays, we pooled four normalized cDNA samples each from women who were preconception, at 12 weeks, 21 weeks, 36 weeks gestation and between 0 and 8 weeks postpartum. These samples were run on the Taqman Human Endogenous Control Array (Applied Biosystems Inc.). The array contained the genes: ACTB; AVPR1B; B2M; CANX; CCT7; CPB1; GAPD; GUSB; HPRT1; HSPCB; 4342379–18S; IFITM2; JUNB; KCNMB1; LDHB; PFDN5; PGK1; PLN; PPIA; RPLP0; TAGLN2; TBP; TFRC; TGFBI. The CT values for RPLP0 were the least variable across all time points, ⩽0.15 CT difference. Therefore, this transcript was chosen as the endogenous control gene for this study. As expected based on prior studies, TFRC, which encodes the transferrin receptor, was highly regulated during pregnancy (Akesson et al. Reference Akesson, Bjellerup, Berglund, Bremme and Vahter1998; Choi et al. Reference Choi, Im and Pai2000) and was thus chosen as a positive-control transcript for pregnancy-dependent regulation.
Hormone measures
Plasma concentrations of cortisol, estradiol and progesterone were measured using direct radioimmunoassay kits from Diagnostic Systems Laboratories (USA). The sensitivity of these kits were 0.11 μg/dl, 4.7 pg/ml and 0.12 ng/ml and the inter-assay correlation of variation was 11.1%, 6.9% and 4.5% for cortisol, estradiol and progesterone, respectively.
GR Sensitivity
To assess GR sensitivity, we used an ex vivo assay that estimates the degree of suppression of interleukin-6 (IL-6) secretion by the synthetic glucocorticoid, dexamethasone, in peripheral leukocytes, as described by DeRijk et al. (Reference DeRijk, Petrides, Deuster, Gold and Sternberg1996) and modified by Miller et al. (Reference Miller, Rohleder, Stetler and Kirschbaum2005) . Altogether, 8 ml of blood were drawn into lithium-heparin anti-coagulating vacutainer tubes (Becton-Dickinson, USA) and diluted 10:1 with 0.9% saline solution within 60 min of collection. In total, 800 μl of the diluted blood were added to 100 μl of lipopolysaccharide (LPS; Sigma Chemical, USA) and 100 μl of dexamethasone (Sigma Chemical) in each of six wells in a 24-well flat bottom plate. The final concentration of LPS was 100 ng/ml, while the final concentrations of dexamethasone were 0, 1, 10, 100, 1000 or 10 000 nm. Following a 6-h incubation at 37°C in an atmosphere containing 5% CO2, the plate was centrifuged for 10 min at 1000 g. The plasma was then aspirated and stored at −20°C until assay of IL-6 using a commercial ELISA kit (Biosource Diagnosics, Belgium). The sensitivity of the ELISA kit was <2 pg/ml and the intra-assay coefficients of variation was 2.9%. Using Sigmaplot 10.0 (USA), a dose–response curve was determined for each sample from the ELISA results and the concentration of dexamethasone necessary to suppress 50% of the IL-6 expression (IC50) was calculated.
Data analysis
Gene expression analyses
To identify potential confounders, the following parameters were tested for associations with whole blood gene expression for all transcripts: age; years of education; marital status; race; gravidity; parity; primary maternal DSM-IV diagnosis. Primary diagnosis was significantly associated with mRNA levels for several genes of interest and thus entered into the full model.
To assess the impact of pregnancy on gene expression, we examined gene expression changes in samples of non-depressed women using a SAS version 9.1 (USA) mixed model analysis accounting for repeated measures and missing time points within subjects. For each gene, the dependent variable was the Z score for mRNA expression ratio. Predictors included trimester (preconception, first trimester, second trimester, third trimester) and DSM-IV primary diagnosis. Results for each subject were averaged within a trimester if more than one sample was collected during this time-frame.
The association of maternal depression with gene expression during pregnancy was tested using a mixed model analysis with maternal depression (dichotomous variable determined by BDI cut-point), trimester and maternal DSM-IV primary diagnosis as predictors.
Plasma hormone concentrations
Changes in plasma hormone levels of estradiol, progesterone and cortisol over pregnancy and in association with maternal depression were analyzed using a general linear model. We included estimated gestational age in weeks as well as time of day of the blood draw [coded as a trichotomous variable – morning (09:00–11:00 hours), noon and early afternoon (11:00–16:00 hours) and late afternoon (16:00–19:00 hours)] but none of the other above-mentioned covariates as they failed to demonstrate an association with the hormone measures.
GR sensitivity
Analyses of the effects of pregnancy and depression on GR sensitivity were performed using SPSS version 15 (USA) with IC50 measures as the outcome using general linear models and partial correlation analysis. To increase the resolution of this analysis, gestational age was entered as gestational days and not grouped into trimesters.
All statistical tests were two-tailed with α=0.05. No correction for multiple testing was applied. It has to be noted, however, that the expression levels across all samples of the 16 GR-related transcripts were all significantly correlated (Pearson's R ranging from 0.31 to 0.83) – so that methods for correction assuming independent tests would be overly conservative.
Results
Patient demographics, clinical characteristics and biological samples
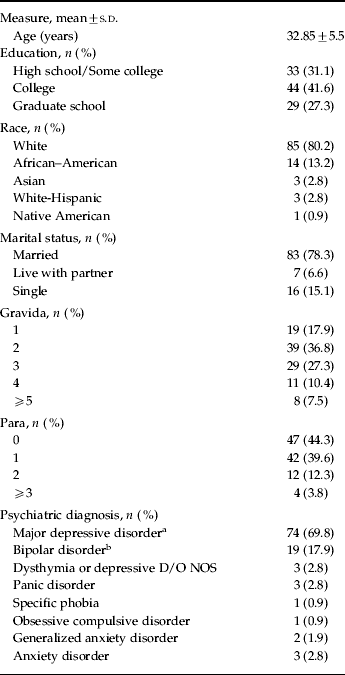
Altogether, 106 women, from whom 137 mRNA samples were collected, qualified for inclusion. Table 2 summarizes the demographic and clinical profile of the participants. In total, 46 (46.2%) women contributed two or more mRNA samples; 33.7% of the mRNA samples were collected when women were depressed. The mean (s.d.) BDI score for samples collected when women were non-depressed and depressed, respectively, was 6.7 (4.4) and 22.6 (6.2) for preconception, 8.8 (4.4) and 28.0 (8.7) for the first trimester, 7.7 (4.4) and 23.4 (5.8) for the second trimester and 8.4 (4.0) and 24.1 (7.6) for the third trimester. A total of 20 samples were collected preconception, 16 during the first trimester, 46 during the second trimester and 55 during the third trimester. Plasma for hormonal assay was collected from 61 of these subjects at the same time point as the mRNA (n=74 samples, 10 preconception, five in the first trimester, 28 in the second trimester and 29 in the third trimester). Of the 29 women participating in the ex-vivo GR sensitivity assay study, 11 were not part of the 106 women of the gene expression study. In addition, samples were taken later in pregnancy for this study in some of the 18 women participating in the gene expression studies, so that the GR sensitivity assays were performed when some women initially off medication were now treated.
Patient demographics and clinical characteristics of the 106 patients with mRNA measures

All diagnoses reflect lifetime diagnoses according to the SCID.
a 10 of the 74 patients with major depression had a co-morbid anxiety disorder.
b 14 (74%) of bipolar patients were bipolar type I.
Gene expression changes during pregnancy in non-medicated, non-depressed women
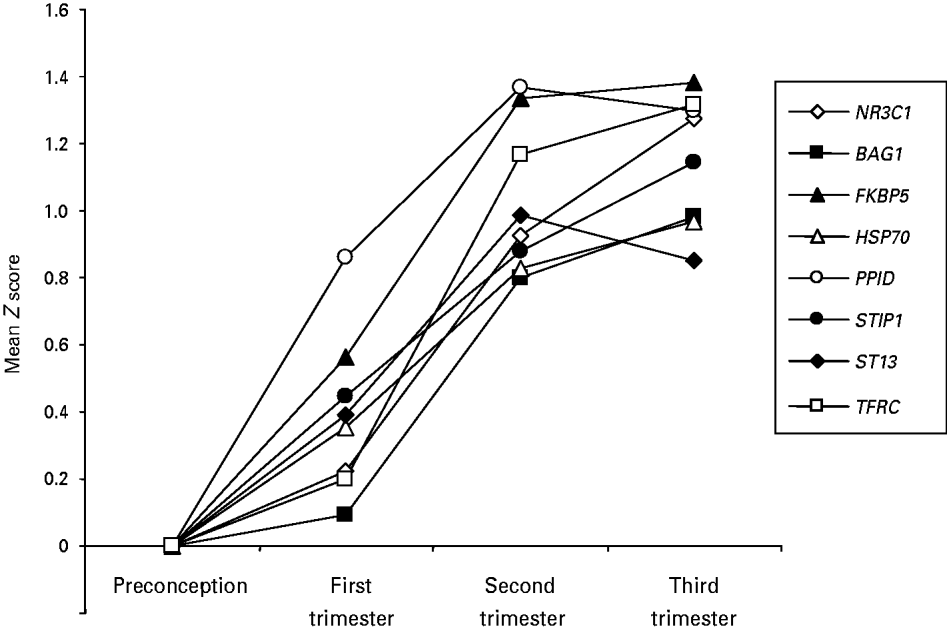
Results of the mixed model analysis of pregnancy-related gene expression, limited to samples collected when women were not depressed [BDI mean (s.d.)=7.3 (4.2)] (n samples=79) demonstrated a significant effect of trimester in up-regulating expression in eight of the 16 examined genes: BAG1 [F=5.27, degrees of freedom (df)=3,16; p=0.01], FKBP5 (F=6.58, df=3,16; p=0.004), HSP70 (F=3.62, df=3,15; p=0.038), NR3C1 (F=5.01, df=3,13; p=0.016), PPID (F=6.58, df=3,16; p=0.004), STIP1 (F=3.85, df=3,16; p=0.03), and ST13 (F=3.61, df=3,13; p=0.04) (see Fig. 1). The positive control gene TFRC was also significantly up-regulated over pregnancy (F=7.86, df=3,16; p=0.002).
Whole blood gene expression of glucorticoid receptor-regulating genes over pregnancy in non-depressed, non-medicated women. Data are expressed as Z scores and were first normalized to control gene expression and then the preconception group. All represented genes show significant regulation over pregnancy (p<0.05 for trimester effect).

Differential regulation of co-chaperone genes in non-medicated, depressed and non-depressed women during pregnancy
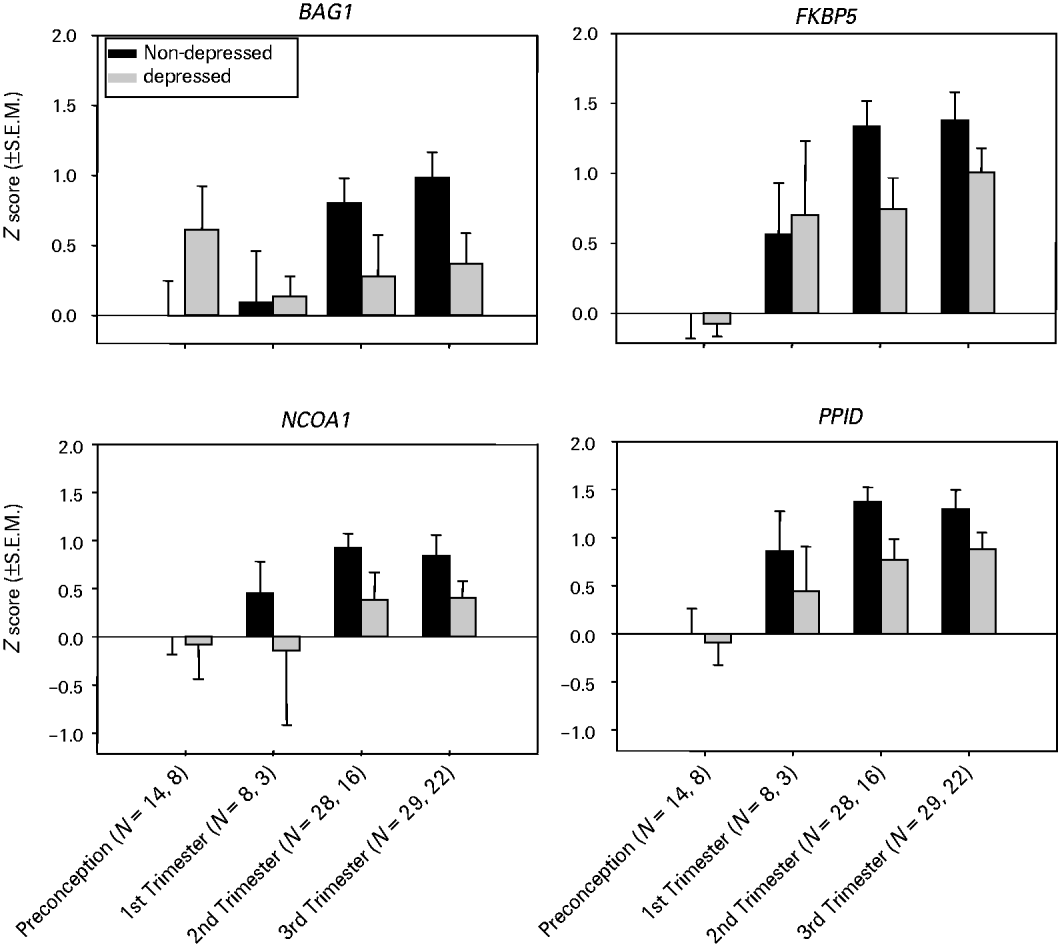
The mixed model analysis of the impact of both maternal depression and pregnancy on gene expression demonstrated no significant interactions between trimester and depression status for any of the genes, enabling interpretation of marginal main effects. We observed a significant main effect of depression on gene expression for BAG1 (F=4.51, df=1,23; p=0.04), FKBP5 (F=4.63, df=1,23; p=0.04), NCOA1 (F=4.43, df=1,22; p=0.05) and PPID (F=6.36, df=1,23; p=0.02) as well as a significant trimester effect for these four genes (see Fig. 2). While gene expression across pregnancy was up-regulated for these genes, the magnitude of the up-regulation was diminished when women were depressed relative to when they were not depressed.
Whole blood gene expression of glucorticoid receptor-regulating genes over pregnancy in non-medicated women, stratified by depression status. Data are expressed as Z scores and were normalized to control gene expression and the non-depressed preconception group. All represented genes show significant differences between the depressed versus non-depressed group (p<0.05). Ns are given for the non-depressed group first and then the depressed group.

Plasma concentrations of cortisol, estradiol and progesterone in pregnancy in depressed and non-depressed women
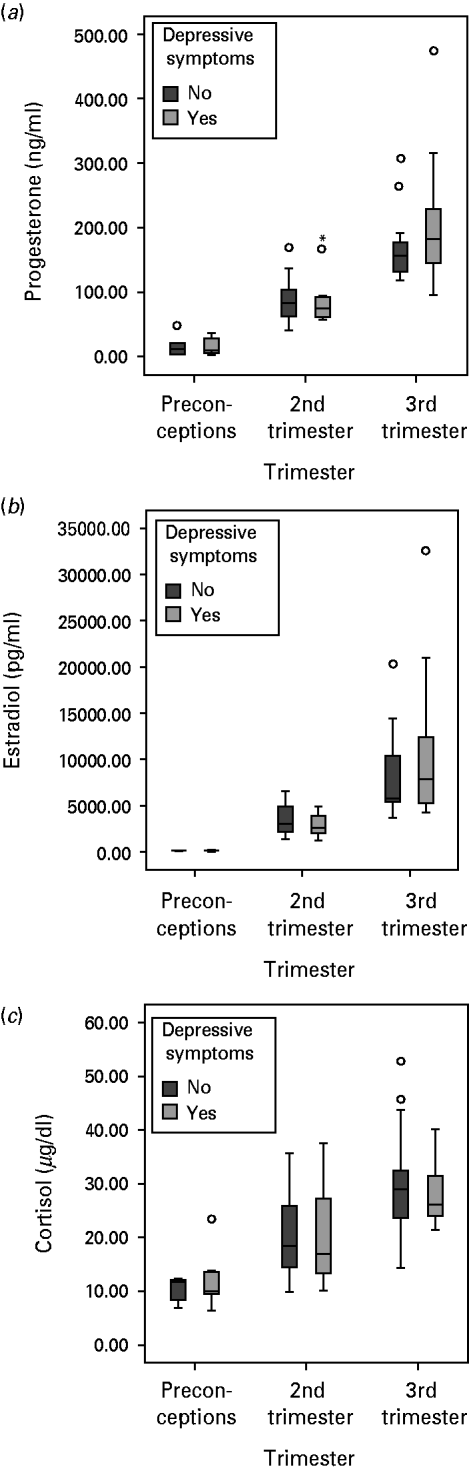
Mixed model analyses demonstrated a significant effect of trimester on estrogen (F=28.8; df=3,7; p<0.001), progesterone (F=9.37; df =3,7; p<0.01) and total cortisol levels (F=11.2; df=3,7; p<0.005), but no main effect of depression nor any interaction between trimester and depression (see Fig. 3). To control for potential effects of different estimated gestational ages as well as the time of day of the blood draw, we added these two variables into the model. As expected, estimated gestational age had a significant effect on all three hormones (p=0.024 for cortisol, p=0.003 for estradiol and p=0.005 for progesterone), but the addition of this covariate did not change the absence of significance of the main depression effect as well as the interaction between trimester and depression. The time of day of the blood draw did not have a significant effect on hormone measures across pregnancy.
Plasma hormone levels over pregnancy in depressed versus non-depressed non-medicated high risk patients. The first trimester group only included n=3 and n=2 for non-depressed and depressed and are not represented in the graph. Group sizes: preconception: n=5/5, second trimester: n=19/11 and third trimester: n=17/12. Data are presented as in box-plot showing the median and interquartile range as well as outliers. Hormone plasma concentrations are shown in ng/ml for progesterone, pg/ml for estradiol and μg/dl for cortisol.

GR sensitivity during pregnancy
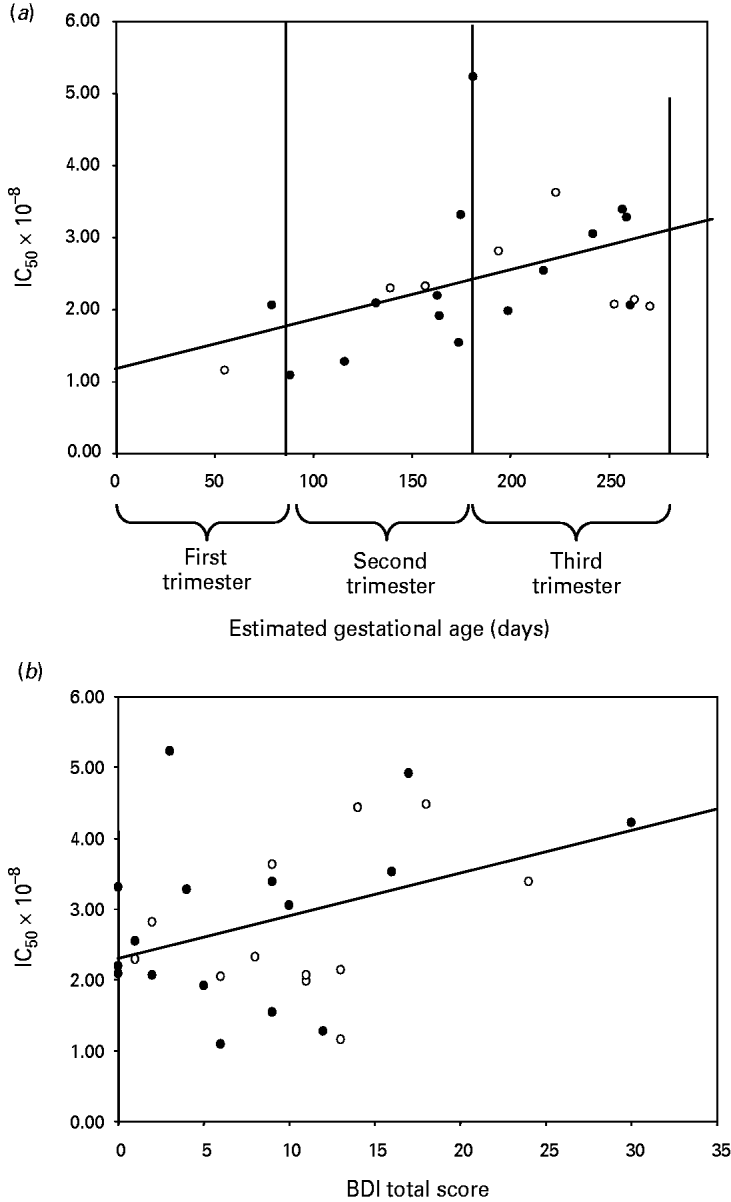
To test whether the observed depression-related gene expression differences are associated with differences in GR function, we examined GR sensitivity using an ex vivo assay in a group of 29 women. We first investigated the changes of GR sensitivity across pregnancy in 23 women without clinically relevant depressive symptoms [BDI mean (s.d.)=6.0 (4.5)]. Using a partial correlation between IC50 values and estimated gestational day and correcting for medication status and DSM-IV diagnosis, we observed a significant positive correlation with IC50 and estimated gestational age – i.e. GR sensitivity declined as pregnancy progressed (Fig. 4 a; r=0.474, df=19, p=0.030). We then examined whether we would observe an association of IC50 levels with depression severity and correlated IC50 values with the total score of the BDI in the whole group of women (n=29), controlling for medication, DSM-IV diagnosis and estimated gestational age. We observed a significant positive correlation between BDI scores and IC50 (r=0.422, df=22, p=0.032), supporting an additional decline of GR sensitivity with increasing depressive symptoms over and above that due to pregnancy (Fig. 4 b).
Glucorticoid receptor sensitivity in pregnancy and with peripartum depression. (a) Shows the correlation between IC50 (mol) of the dexamethasone suppression of lipopolysaccharide-stimulated interleukin-6 release and estimated gestational age in days in euthymic women (n=23). The line shows the linear trend for this correlation in non-depressed women, r=0.474, r 2=0.179, p<0.05; (b) shows correlation between IC50 and Beck Depression Inventory (BDI) scores in all 29 women. The line shows the linear trend for this correlation, r=0.422, r 2=0.132, p<0.05, corrected for gestational age and SCID diagnosis. In both (a) and (b), ○ represent data from patients off antidepressant medication and • represent data from patients on antidepressant medication.

We observed no difference in IC50 between the 12 women off and the 17 women on medication (t=–0.174, df=27, p=0.83).
Discussion
In this study, we present data showing up-regulation of expression of specific peripheral blood mRNAs encoding chaperone, co-chaperone and transcription factor proteins critical for GR function across pregnancy in women with a history of mood or anxiety disorders. These changes are paralleled by decreases of GR sensitivity in peripheral blood cells over pregnancy, confirming the results of investigations performed over two decades ago of GR sensitivity in pregnancy using the DST (Greenwood & Parker, Reference Greenwood and Parker1984; Smith et al. Reference Smith, Owens, Brinsmead, Singh and Hall1987). These findings need to be replicated in a healthy control group to extrapolate results for euthymic, unmedicated patients to the general population. It also has to be noted that no correction for multiple testing has been applied, underscoring the exploratory nature of the study.
Our data further suggest that maternal depression diminishes the pregnancy-related up-regulation of gene expression for BAG1, FKBP5, PPID and NCOA1. Consistent with some (Zonana & Gorman, Reference Zonana and Gorman2005; Brummelte & Galea, Reference Brummelte and Galea2009; King et al. Reference King, Chambers, O'Donnell, Jayaweera, Williamson and Glover2010) but not all (Evans et al. Reference Evans, Myers and Monk2008; Field et al. Reference Field, Diego, Hernandez-Reif, Figueiredo, Ascencio, Schanberg and Kuhn2008; O'Keane et al. Reference O'Keane, Lightman, Marsh, Pawlby, Papadopoulos, Taylor, Moore and Patrick2010) studies, our data did not demonstrate any impact of maternal depression or anxiety during pregnancy on circulating concentrations of cortisol or gonadal steroids. However, because our measures of plasma hormone levels only occurred at one time point during the day and represent total but not free hormone levels, we cannot exclude the possibility that differences in overall diurnal secretion of hormones or differences in free hormone levels contributed to the observed findings. Nonetheless, most studies report a higher cortisol level with depression in pregnancy (Evans et al. Reference Evans, Myers and Monk2008; Field et al. Reference Field, Diego, Hernandez-Reif, Figueiredo, Ascencio, Schanberg and Kuhn2008; O'Keane et al. Reference O'Keane, Lightman, Marsh, Pawlby, Papadopoulos, Taylor, Moore and Patrick2010), which should, at least for FKBP5, be associated with higher and not lower gene expression levels (Jaaskelainen et al. Reference Jaaskelainen, Makkonen and Palvimo2011).
Differences in chaperone and co-chaperone expression profiles could also be due to changes in the composition of the white blood cell subpopulations, which we cannot differentiate as we were using whole blood to assess both mRNA expression levels and GR function. However, data from a set of 45 non-pregnant individuals (69% women) indicate that transcript levels of the genes differentially regulated in depressed compared with non-depressed women as well as over pregnancy are not significantly correlated with the relative proportions of leukocyte subtypes (data not shown).
To minimize the effects of antidepressant therapy, gene expression and hormone assay analyses were conducted in samples from patients who denied taking psychotropic drugs for at least 2 weeks. We cannot exclude the possibility that drugs with longer half-lives (e.g. fluoxetine) or residual effects of psychotropic drugs could still influence gene expression. Further studies in drug-free women will be necessary to address whether any of the observed changes could be related to enduring effects of antidepressant exposure. The current study design also did not allow us to use transcription profiles for prediction of future depression, as most women received antidepressant medication at one point during pregnancy. While primary psychiatric diagnosis showed main effects on select transcripts, this variable did not influence the association of expression levels with trimester or maternal depressive symptoms. While psychiatric diagnosis is not likely a major confounder of the present analyses, the significant main effects are interesting and need to be investigated in larger samples that include healthy volunteers.
Interestingly, the relative decrease in gene expression of specific transcripts in association with depression during pregnancy, presented in this paper, parallels previously published results for postpartum depression using gene expression microarrays (Segman et al. Reference Segman, Goltser-Dubner, Weiner, Canetti, Galili-Weisstub, Milwidsky, Pablov, Friedman and Hochner-Celnikier2010). In the latter study, women developing persisting postpartum depression exhibited lower levels of a number of transcripts in whole blood sampled directly after delivery. Decreased gene expression with depressive symptoms in the peripartum period might thus reflect more general molecular mechanisms altering the dynamics of gene expression changes, such as global changes in transcription factor signaling or epigenetic modifications. Differences in epigenetic measures have been observed in peripheral blood cells of depressed patients (Iga et al. Reference Iga, Ueno, Yamauchi, Numata, Kinouchi, Tayoshi-Shibuya, Song and Ohmori2007).
GR sensitivity in peripartum depression
It has been hypothesized that decreased GR sensitivity during pregnancy protects from potential adverse sequelae of rapidly increasing plasma cortisol levels, such as a premature escalation in the placental release of CRH, which might alter the timing of delivery (McLean et al. Reference McLean, Bisits, Davies, Woods, Lowry and Smith1995; Smith & Nicholson, Reference Smith and Nicholson2007). In addition to confirming that GR sensitivity decreases during pregnancy, our data suggest that this change in GR sensitivity is paralleled by an up-regulation of several chaperone and co-chaperone genes regulating GR function. This regulation could be the consequence of the activation of sex-steroid response elements in these genes with rising hormone levels throughout pregnancy. Functional progesterone response elements have been described for FKBP5, for example (Hubler & Scammell, Reference Hubler and Scammell2004; U et al. Reference U, Shen, Oshida, Miyauchi, Yamada and Miyashita2004). Regulation of these transcripts might, in fact, constitute a read-out of pregnancy-related GR sensitivity changes.
Data from the ex vivo GR function assay suggest that, in addition to pregnancy, increased severity of depressive symptoms is associated with a further decrease in GR sensitivity. These data parallel what is seen in non-gravid depression, in which decreases in GR sensitivity are observed in a subset of patients with major depression (Holsboer, Reference Holsboer2000; Pariante & Miller, Reference Pariante and Miller2001). The current results, obtained from the study of peripheral blood cells, preclude direct extrapolation of these data to the function of the GR in other tissues, such as the brain. However, the brain and the immune system share many signaling pathways that both respond to GR-activation and several studies support the concept that changes in GR signaling in immune cells often parallels similar regulation of central GR function (Lowy et al. Reference Lowy, Reder, Antel and Meltzer1984, Reference Lowy, Reder, Gormley and Meltzer1988; Holsboer & Barden, Reference Holsboer and Barden1996; Pariante & Miller, Reference Pariante and Miller2001; Pariante, Reference Pariante2004).
Differences in GR sensitivity could also be related to placental dysfunction and associated changes in placental CRH release, which have been shown to impact obstetric outcomes. In our dataset, we did not observe a correlation of the expression levels of FKBP5, NCOA1, PPID or BAG1 in the third trimester on estimated gestational age at delivery, baby weight, APGAR at 1 and 5 min after delivery of days spent in the neonatal intensive care unit (data not shown, n=52). We therefore conclude that the observed associations of depression and peripheral gene expression are not strongly related to placental dysfunction.
Chaperone and co-chaperone mRNA transcription and GR function – cause or consequence?
The investigated chaperone and co-chaperone molecules play a dual role in GR signaling. While these molecules regulate steroid receptor function, their transcription is, in turn, regulated by activation of these receptors, forming a feedback system. Previous studies have shown that cortisol, estradiol and progesterone exposure alter the expression of a number of our genes of interest in vitro (Tang et al. Reference Tang, Gannon, Andrew and Miller1995; Kumar et al. Reference Kumar, Mark, Ward, Minchin and Ratajczak2001; Hubler & Scammell, Reference Hubler and Scammell2004). This steroid-dependent regulation of gene transcription is likely mediated via the interaction of these receptors with hormone response elements (HREs) located in the target genes. FKBP5, for example, contains functional HREs responsive to cortisol, progesterone and androgens (Hubler & Scammell, Reference Hubler and Scammell2004; Paakinaho et al. Reference Paakinaho, Makkonen, Jaaskelainen and Palvimo2010). The observed parallel increases of steroid-regulated transcripts with rising steroid hormone levels during pregnancy suggest that transcriptional regulation via steroid hormone receptor activation might represent a molecular mechanism for the observed up-regulation of gene transcripts during pregnancy.
Differences in mRNA levels between depressed and non-depressed women could thus be the consequence of differences in hormone receptor sensitivity or hormone receptor number. We have clearly observed differences in GR-sensitivity over pregnancy, as well as with depressive symptoms. However, we also observe an up-regulation of NR3C1 (the gene encoding the GR) mRNA, during pregnancy, but no mRNA differences with depressive symptoms. So while receptor number might play a role in pregnancy-related gene expression changes, this seems less likely for depression-related differences. This issue needs further confirmation using assays directly measuring GR-protein. We also cannot rule out additional contributions of differences in sex-steroid receptors or potential differences in epigenetic mechanisms as a source for this effect.
As stated above, the investigated chaperones and co-chaperones are not only regulated by steroid receptor activation, but, in turn, influence the function of these receptors. If up-regulation of chaperone and co-chaperone gene expression levels does contribute to decreases in GR sensitivity, one would expect that depressed women with less up-regulation display higher GR sensitivity, which is not the case in our sample. In addition, BAG1, FKBP5, NCOA1 and PPID – all differentially regulated with depressive symptoms – have proposed opposite roles in GR signaling (negative for BAG1 and FKBP5 and positive for NCOA1 and PPID) (Bimston et al. Reference Bimston, Song, Winchester, Takayama, Reed and Morimoto1998; Kullmann et al. Reference Kullmann, Schneikert, Moll, Heck, Zeiner, Gehring and Cato1998; Kimmins & MacRae, Reference Kimmins and MacRae2000; Kurihara et al. Reference Kurihara, Shibata, Suzuki, Ando, Kobayashi, Hayashi, Saito and Saruta2000; Morishima et al. Reference Morishima, Kanelakis, Silverstein, Dittmar, Estrada and Pratt2000; Schneikert et al. Reference Schneikert, Hubner, Langer, Petri, Jaattela, Reed and Cato2000; Davies et al. Reference Davies, Ning and Sanchez2002; Ratajczak et al. Reference Ratajczak, Ward and Minchin2003; Odunuga et al. Reference Odunuga, Longshaw and Blatch2004; Meijer et al. Reference Meijer, Kalkhoven, van der Laan, Steenbergen, Houtman, Dijkmans, Pearce and de Kloet2005). It is thus unlikely that their transcriptional levels directly relate to GR function in a simple linear manner. Their decreased up-regulation is most likely a marker of altered GR (or other steroid hormone receptor) sensitivity in pregnant women with depression. In fact, FKBP5 mRNA regulation has been proposed as a marker for GR activation and sensitivity in peripheral blood cells (Vermeer et al. Reference Vermeer, Hendriks-Stegeman, van Suylekom, Rijkers, van Buul-Offers and Jansen2004; Jaaskelainen et al. Reference Jaaskelainen, Makkonen and Palvimo2011). These GR chaperone and co-chaperones, especially FKBP5, have a dual role and (1) moderate GR activity and (2) their transcriptional regulation can serve as a molecular read-out of GR activation and sensitivity. Our data provide evidence for these genes as markers for GR-sensitivity, but do not allow us to infer whether their expression changes are causally involved in depression-related GR resistance.
Conclusions
Our data suggest that depressive symptoms during pregnancy are associated with differences in GR chaperone gene expression in whole blood. These differences in expression levels could be a molecular marker of GR-sensitivity, which is decreased in depression during pregnancy. Individual differences in sensitivity to glucocorticoids may contribute to differences in long-term outcomes associated with GR-mediated signaling, including a number of adverse fetal outcomes (Robinson et al. Reference Robinson, Emanuel, Frim and Majzoub1988; Goland et al. Reference Goland, Jozak, Warren, Conwell, Stark and Tropper1993; Karalis et al. Reference Karalis, Goodwin and Majzoub1996; Clark, Reference Clark1998; Patel & Challis, Reference Patel and Challis2002, Meaney et al. Reference Meaney, Szyf and Seckl2007). GR chaperone gene expression over pregnancy may serve as a marker for these changes in GR sensitivity in women at risk for depressive symptoms and may be of value in treatment planning for high-risk populations.
Acknowledgments
This work was supported by a Specialized Center for Research to Stowe (P50 MH 68036), a Pfizer Scholars Grant in Clinical Psychiatry (to Binder), the Doris Duke Charitable foundation (Career development award to Binder) and R21 MH076024–01 to Binder.
Declaration of Interest
Dr Newport has received research support from Eli Lilly, GSK, Janssen and Wyeth as well as NARSAD and NIH, and speaker's honoraria from Astra-Zeneca, Eli Lilly, GSK, and Pfizer. Dr Stowe has received research support from GSK, NIH and Wyeth, served on advisory boards for Wyeth, BMS and GSK and received speakers' honoraria from Eli Lilly, GSK, Pfizer and Wyeth. Dr Cubells has received grant support from NIDA, NIMH, NINDS, NARSAD, Roche and Schering-Plough. Dr Binder receives grant support from NIMH, The Behrens-Weise Foundation and PharmaNeuroBoost.