I. INTRODUCTION
The heavily doped Bi2Te3 alloys are one of the most important commercial thermoelectric (TE) materials that exist to date.Reference Goldsmid and Douglas1, Reference Bell2 Bi2Te3 compounds possess a rhombohedral symmetry with the space group  and they crystallize in a layered structure. The layered structure of Bi2Te3 is composed of five monatomic hexagonal networks alternatingly stacked in the sequence Te(1)-Bi-Te(2)-Bi-Te(1).Reference Bekebrede and Guentert3, Reference Greenaway and Harbeke4 The bonds between the quintet layers are van der Waals type, whereas the Bi-Te(2) and Bi-Te(1) bonds within the layer are mainly covalent, however, with a small fraction of ionic bonding.Reference Drabble and Goodman5 Such an anisotropic crystal structure and chemical bonds lead to strong anisotropy in the electrical resistivity (ρ) and the thermal conductivity (κ) but much less for the Seebeck coefficient (α). These are the material’s parameters that govern the dimensionless figure of merit, ZT, of a TE material (ZT = α 2T/ρκ, in which T is absolute temperature).Reference Delves, Bowley, Hazelden and Goldsmid6–Reference Ohsugi, Kojima, Sakata, Yamanashi and Nishida8
Anisotropy in the TE properties of commercial zone-melted p-type (Bi,Sb)2Te3 alloys has been studied by Scherrer and Scherrer,Reference Scherrer, Scherrer and Rowe9 wherein they show that the anisotropy ratios range from 2.5 to 3.0 in the resistivity, ρ, and from 2.1 to 2.5 in the thermal conductivity. The ZT values exhibit a smaller degree of anisotropy and exhibit a maximum value of ZT ≈1. Recently, a number of novel preparation procedures have been developed to fabricate Bi2Te3 nanocomposites with higher ZT values, such as the ball milling: hot-pressing procedure,Reference Poudel, Hao, Ma, Lan, Minnich, Yu, Yan, Wang, Muto, Vashaee, Chen, Liu, Dresselhaus, Chen and Ren10, Reference Ma, Hao, Poudel, Lan, Yu, Wang, Chen and Ren11 the hydrothermal synthesis: hot-pressing procedure,Reference Zhao, Ji, Zhang, Zhu, Tu and Zhang12, Reference Cao, Zhao, Zhu, Zhang and Tu13 and in our work the melt-spinning (MS): spark-plasma-sintering (MS-SPS) procedure.Reference Tang, Xie, Li, Zhao, Zhang and Niino14–Reference Xie, He, Kang, Tang, Zhu, Laver, Wang, Copley, Brown, Zhang and Tritt17 In utilizing these various novel process procedures, the ZT values have been subsequently increased by 40–50%. In the previous studies, any possible degree of anisotropy of these nanocomposites has not attracted very much attention. However, very recently, Yan et al.Reference Yan, Poudel, Ma, Liu, Joshi, Wang, Lan, Wang, Chen and Ren18 studied the anisotropy of ball-milled hot-pressed n-type Bi2(Te,Se)3 nanocomposites in the directions both perpendicular and parallel to the pressing direction. They found that the anisotropy ratio was ∼1.12 for the electrical conductivity and ∼1.17 for the thermal conductivity at room temperature, while the ZT values were about the same. Kim et al.Reference Kim, Kim, Heo and Kim19 investigated the impact of powder morphology on the anisotropy of spark-plasma-sintered p-type Bi0.5Sb1.5Te3. However, to the best of our knowledge, there lacks a systematic investigation of the sintering pressure on any possible anisotropy of p-type Bi2Te3 nanocomposites.
During a hot-pressing or spark plasma sintering process, a pressure is applied to the starting powders, which are contained typically in a graphite mold. Higher sintering pressures typically yield a higher packing density and presumably one might expect a higher degree of anisotropy in the Bi2Te3 materials. It is interesting to note that the ZT of single crystalline Bi2Te3 materials is lower than that of Bi2Te3 nanocomposites. This result highlights the importance of grain boundaries, however, in contradiction to what one would expect. Although currently there lacks a comprehensive theoretical model to delineate all the specific contributions, such as the relative orientation of grains. This orientation seems to be a prime factor that governs the grain boundary effects, and furthermore, it can be directly controlled by the sintering pressure. The present work constitutes at least in part an effort to clarify whether there is indeed an optimal range of anisotropy for Bi2Te3 nanocomposites. In particular, since to date most of the gains in ZT values of the nanocomposites are from the significant reduction of thermal conductivity, in this work, we focus on the impact of pressure on the anisotropy of the thermal conductivity.
Another motivation of the present work comes from the measurement point of view. In view of the tensor nature of all three TE properties that govern ZT, they must be measured in the same direction to have a reliable ZT value. However, the thermal conductivity measurement is often measured using a steady-state technique at low temperatures (T < 300 K) and a transient temperature technique or laser flash technique at elevated temperatures (T > 300 K). Because of the different requirements on the sample geometry for these techniques, the measurements are often performed in different directions of the samples, which may lead to questionable ZT values in anisotropic samples. The samples that result from the SPS technique typically have geometry of 2–3 mm in thickness and a diameter of 12.7, 15, or 25.4 mm. We typically use a 12.7-mm diameter sample. The constraint in that these samples would then fit directly into the sample holders that are used in our Netzsch 457 laser flash diffusivity system (Netzsch, Selb, Germany). This then would result in a thermal conductivity measurement that is parallel to the pressing direction. Samples for the steady-state technique would subsequently be cut into bars (8–10 × 2–3 × 2–3 mm3) from the initial SPSed pellet. The resistivity and Seebeck coefficient would also be measured in the same direction as that of the steady-state thermal conductivity measurement. Therefore, it is crucial to clarify whether and to what extent the thermal conductivity results measured in these different directions compare with each other, and furthermore, how these results might relate to the corresponding microstructure.
In this work, we prepared (Bi, Sb)2Te3 nanocomposite bulk materials by a MS-SPS procedure under four different sintering pressures between 20 and 60 MPa, with the SPS temperature and sintering time fixed. To derive the anisotropy, the thermal conductivity has been measured in the directions both perpendicular and parallel to that of the pressing direction.
II. EXPERIMENTAL DETAILS
The powders of zone-melted p-type Bi0.48Sb1.52Te3 ingot were placed into a quartz tube with a 0.5-mm diameter nozzle in 0.06 MPa Ar atmosphere. The ingot was inductively melted and ejected onto a copper roller rotating with a linear speed of 40 m/s. The resulting ribbons were ∼2-mm wide, 7- to 10-μm thick, and 1- to 2-cm length. The ribbons were hand ground for ∼10 min. Then the derived fine powders were consolidated into a densified pellet using a SPS technique at 500 °C for 5 min under 20, 30, 45, and 60 MPa. The powders were enclosed in ≈50-mm diameter graphite dies with a 12.7-mm diameter hole drilled through the center of the die. Graphite foil was placed between the powder and the 12.7-mm graphite rods that were used in applying the pressure. Thus, the resulting SPSed pellets are 12.7 mm in diameter and typically 2–3 mm in thickness, and in this study, we kept the thickness to be ≈2 mm.
The phase structure of products was checked by a Rigaku Miniflex x-ray powder diffractometer using Cu Kα radiation at each stage of the sample preparation process. Scanning electron microscopy (SEM; Hitachi S-4800, Hitachi, Tokyo, Japan) was utilized to investigate the microstructure of the resulting samples and the melt-spun ribbons. The thermal diffusivity was measured by the laser flash diffusivity method using the Netzsch LFA457 system above room temperature. Specific heat was determined by differential scanning calorimetry using a Netzsch DSC-404C (Netzsch, Selb, Germany). The resulting high-temperature thermal conductivity, κ, was calculated from the measured thermal diffusivity, D, specific heat, CP, and density, ρD, from the relationship: κ = DCPρD. Uncertainty in the thermal conductivity measurements is about ±5%. The packing densities of SPSed bulk materials are 6.84–6.85 gcm−3, which are 98–99% of the theoretical density of the samples. The low-temperature κ (T < 300 K) was measured using a custom-designed steady-state technique.Reference Pope, Zawilski and Tritt20 The comparison of the results of the low- and high-temperature thermal conductivity measurements is important and instructive as well, as we shall discuss in the following text.
III. RESULTS AND DISCUSSION
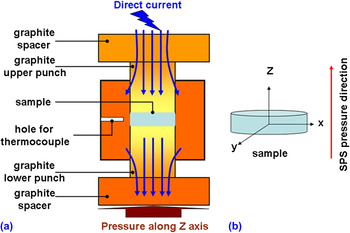
Before discussing the anisotropy of the thermal conductivity, we would like to briefly discuss and highlight the features of the SPS technique. For nanostructured materials, SPS has distinct advantages in that the rapid densification at relatively low-temperature sintering process is thereby able to preserve the metastable microstructures and internal interfaces. Furthermore, the SPS process is able to inhibit significant grain growth because of the short SPS time of only several minutes when compared with several hours in a hot-pressing procedure.Reference Zhan, Kuntz, Wan, Garay and Mukherjee21–Reference Liu and Naka25 The schematic of spark plasma sintering is shown in Fig. 1(a). During the SPS process, the combination of a low-voltage, high-intensity pulsed direct current and uniaxial pressure is simultaneously applied, which in turn offers the possibilities of using rapid heating rates and very short holding time to obtain highly dense bulk materials. In the SPS system when used for scientific research applications (not necessarily for commercial use), if the sample is too long or too wide, then the temperature distribution, stress field, and current density would be very difficult to achieve equilibrium from the upper section to the bottom section of sample. This would then most likely generate inhomogeneity in the microstructure and the resulting electrical and thermal transport properties.Reference Wang and Fu26–Reference Schmitz, Stiewe and Muller28 Therefore, to avoid any possible inhomogeneous radial or axial temperature distribution or stress field, we chose a small size graphite die (12.7 mm in diameter) to SPS, a bulk material with the thickness of 2 mm, as shown in Fig. 1(b).
(a) Diagram of the spark-plasma-sintering (SPS) process. A sample is placed in a graphite die, and a small initial force is applied via two (1/2” diameter) graphite rods, and a pulsed current is injected into the sample, which heats the sample through self-Joule heating. (b) Schematic diagram of SPSed bulk sample, in which the pressure direction of SPS processing is along the z-axis.

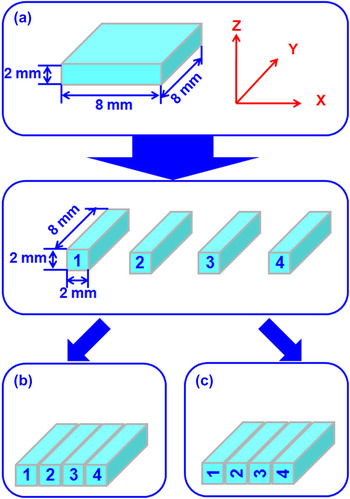
To investigate the thermal transport anisotropy in the MS-SPSed (Bi,Sb)2Te3 bulk materials, we have adopted a three-step measurement procedure to investigate and evaluate any possible anisotropy factor of the thermal diffusivity. First, the thermal diffusivity of SPSed (Bi, Sb)2Te3 bulk-A material (2 × 8 × 8 mm3, shown in Fig. 2) has been measured along the SPS pressure direction (direction “Z” in Fig. 2) from 300 to 420 K. Second, bulk-A has been cut into four bars with the dimension of 2 × 2 × 8 mm3. Then these four bars have been glued together using JB Weld (high temperature glue; J-B Weld Company, Sulphur Springs, TX) by two different configurations, namely bulk-B and bulk-C. Bulk-B is the same configuration as bulk-A, whereas in bulk-C, each of the bars is rotated 90° counterclockwise before being glued together. The purpose of making the bulk-B sample is to verify whether the cutting and the use of JB Weld (which creates an interface of a different material) would affect the thermal diffusivity. For comparison, the low-temperature thermal conductivity of a bar sample is measured from 15 to 310 K along the direction Y that is perpendicular to the pressing direction (“Z” direction). In our study, we found that there was no difference (beyond the instrument uncertainty) between the thermal diffusivities of bulk-A and bulk-B. The specific heat values of all SPSed samples are almost the same as each other. For the SPSed bulk material with SPS pressure of 20 MPa, the specific heat values are 0.182 and 0.188 Jg−1K− at room temperature and 450 K, respectively. Therefore, it is plausible to regard bulk-C as a sample with texture perpendicular to the press direction.
Three-step measurement procedures for the reorientation of the sample. In this figure, direction Z is parallel to the SPS pressing direction, and directions X and Y are perpendicular to the SPS pressing direction. The thermal diffusivity is along the Z direction, and low temperature thermal conductivity is along the Y direction.

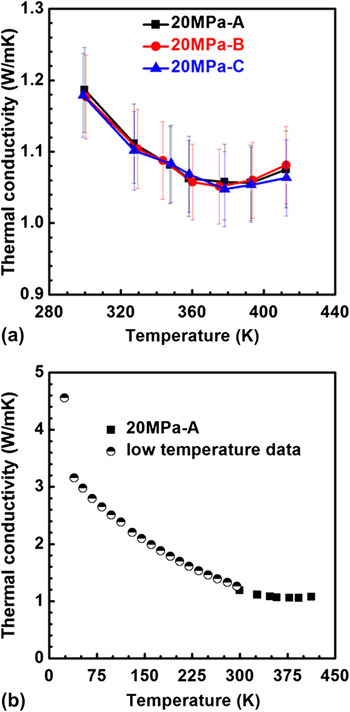
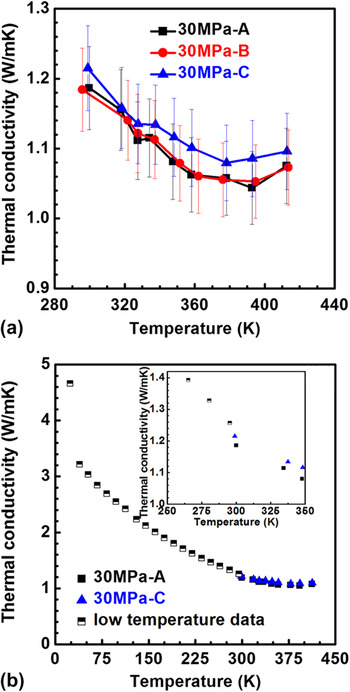
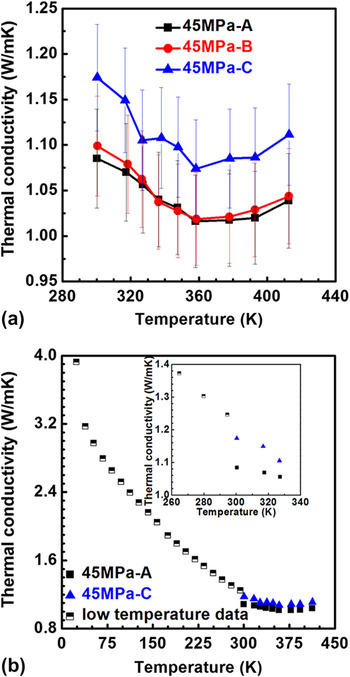
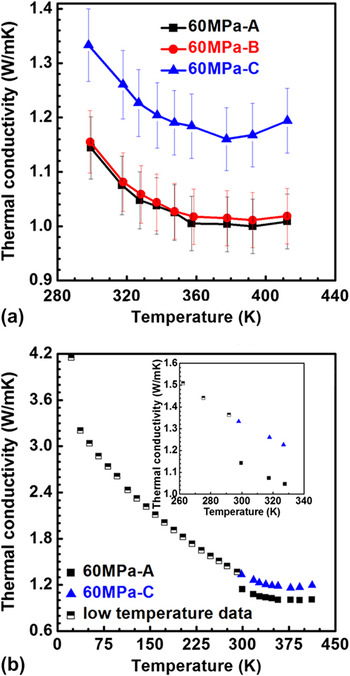
The total thermal conductivity of MS-SPSed bulk materials with different SPS pressures of 20, 30, 45, and 60 MPa are presented in Figs. 3–6, respectively. As shown in Figs. 3(a)–6(a), the thermal conductivities of bulk A and bulk-B for SPSed bulk materials with different SPS pressure were practically the same. It indicates that the JB weld does not affect the results of thermal diffusivity measurement. Then we can compare the thermal conductivity of bulk-A and bulk-C. For the sample sintered at 20 MPa, the thermal conductivity of bulk-C is almost the same when compared with that of bulk-A. We compare the thermal conductivity in the temperature range (20–300 K) and the higher temperature range (300–420 K), and these results are shown in Fig. 3(b). The results of the low- and high-temperature measurements match very well, and the thermal conductivity of the SPSed bulk material shows very smooth temperature dependence from 20 to 420 K. This indicates that there is not any anisotropy difference of the thermal diffusivity for the sample prepared at the SPS pressure of 20 MPa.
Thermal conductivity as a function of temperature for the 20-MPa sample. (a) High-temperature thermal conductivity behavior of bulk-A, bulk-B, and bulk-C; (b) please note the very good match between the high- and low-temperature measurements.

Thermal conductivity as a function of temperature for of the 30-MPa sample. (a) High-temperature thermal conductivity behavior of bulk-A, bulk-B, and bulk-C; (b) again note the good match between high- and low-temperature measurements.

Thermal conductivity as a function of temperature for of the 45-MPa sample. (a) High-temperature thermal conductivity behavior of bulk-A, bulk-B, and bulk-C; (b) the high- and low-temperature measurements start to show some discernible difference.

Thermal conductivity as a function of temperature of the 60-MPa sample. (a) High-temperature thermal conductivity behavior of bulk-A, bulk-B, and bulk-C; (b) the difference between high- and low-temperature measurements because of anisotropy of the sample is now quite apparent.

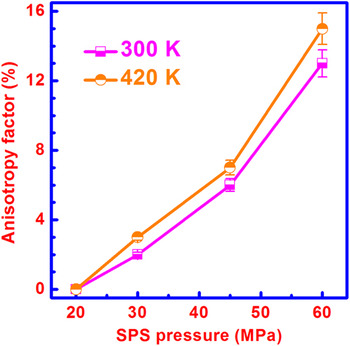
With an increase of the SPS pressure from 30 to 60 MPa, the difference between thermal diffusivity of bulk-A and that of bulk-C gradually increases, and the results are shown in [Figs. 4(a)–6(a)]. The difference is 2–3% for the 30 MPa sample, 6–7% for the 45 MPa sample, and eventually reaches 13–15% for the 60 MPa sample. It is interesting to notice that the low-temperature thermal conductivity matches well with the high-temperature results of bulk-C for all SPSed bulk materials with different SPS pressures, and the thermal conductivity also shows a smooth seamless variation from 20 to 420 K. The anisotropy factor (I ani) is defined by the following equation:
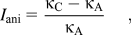
where κ A and κ C are thermal conductivity of bulk-A and bulk-C, respectively. Therefore, we can conclude that the anisotropy factors of the thermal conductivity between the perpendicular and parallel directions to that of the pressing direction for SPSed bulk materials with the SPS pressures of 20, 30, 45, and 60 MPa are 0, 2–3, 6–7, and 13–15%, respectively.
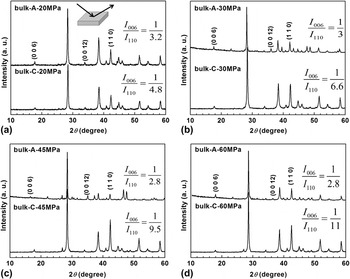
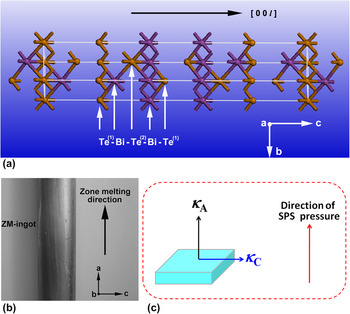
To understand the origin of anisotropy factor for the MS-SPSed bulk materials with the higher SPS pressure, the x-ray diffraction (XRD) patterns were checked at each stage of the sample preparation process. Figure 7 presents the XRD patterns of SPSed bulk materials with different SPS pressures. The intensity ratio (I 006/I 110) between peaks of (006) and (110) planes are calculated and also shown in Fig. 7. We notice that the ratio of I 006/I 110 of bulk-C decreases with an increase in the SPS pressure. For the randomly oriented Bi0.5Sb1.5Te3 compound, the ratio I 006/I 110 is about 1/3.8 given in the standard PCPDF with reference code of 00-049-1713. The ratio I 006/I 110 of sample bulk-C-20MPa is 1/4.8 [shown in Fig. 7(a)], which is about twice that of sample bulk-C-60MPa [shown in Fig. 7(d)]. These results seem to indicate that the high SPS pressure induces a preferred orientation, which is parallel to c-axis, along the direction of SPS pressure. The crystal structure of Bi2Te3 materials, zone melting (ZM) Bi2Te3 ingot, and sketch of MS-SPSed (Bi,Sb)2Te3 bulk material are shown in Fig. 8. In the Bi2Te3 single crystal shown in Fig. 8(a), the thermal conductivity parallel to [0 0 l] (or c-axis) is much lower than that of perpendicular to [0 0 l] (or c-axis), which is because phonon scattering is induced by stacking five monatomic hexagonal networks Te(1)-Bi-Te(2)-Bi-Te(1) along c-axis. In the zone-melted ingot shown in Fig. 8(b), the ingot has the orientation growth direction that is perpendicular to the [0 0 l] (or c-axis), resulting in the fact that the thermal conductivity parallel to the ZM direction is about 2–2.5 times of that of perpendicular to the ZM direction.Reference Scherrer, Scherrer and Rowe9 In this work, we found that the thermal conductivity of bulk-C sample is always higher than that of the bulk-A sample for the SPSed bulk materials with the higher SPS pressure. Our results are consistent with that of the zone-melted ingots.
X-ray diffraction patterns for the SPSed bulk materials (bulk-A and bulk-C) with different SPS pressures: (a) 20 MPa, (b) 30 MPa, (c) 45 MPa, and (d) 60 MPa.

(a) The crystal structure of Bi2Te3; (b) photograph of zone melting ingot; (c) sketch of MS-SPSed BiSbTe bulk material.

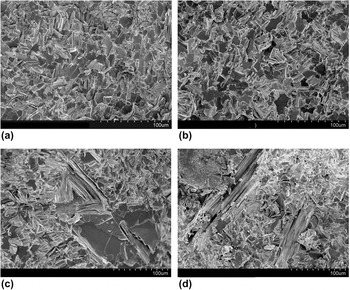
In view of the structure-physical property correlation, the observed anisotropy at high SPS pressures should most likely originate from the different microstructures. Therefore, we use SEM to investigate the microstructures of all four samples, and the results are presented in Fig. 9. The SEM images are observed parallel to SPS pressing direction. As shown in Figs. 9(a) and 9(b) for the 20 and 30 MPa samples, they possess a randomly oriented grain structure with a typical size of ∼10 μm. With the higher SPS pressures, the large grains with layered structures become apparent as shown in Figs. 9(c) and 9(d). The SEM images that are shown in Fig. 9 are representative of a large number of SEM micrographs that were taken, they agree with the observed development of the anisotropy of thermal conductivity as discussed above.
Scanning electron microscopy images for the SPSed bulk materials with different SPS pressures: (a) 20 MPa, (b) 30 MPa, (c) 45 MPa, and (d) 60 MPa.

Finally, we summarize the SPS pressure dependence of anisotropy in Fig. 10. The error bar for anisotropy factor was calculated by the following equations:


The SPS pressure dependence of the anisotropy factor in the total thermal conductivity at temperatures 300 and 420 K.

where the  ,
 ,
 , and
 are uncertainties for κ A, κ C, (κ C − κ A), and I ani, respectively. According to the measured thermal conductivity and their uncertainty (±5%), the calculated
 is about ±6%. With an increase of SPS pressure, the anisotropy factor increases considerably. According to the measured thermal conductivity, XRD results, and observed microstructure, we conclude that the grains with preferred c-axis orientation induced by the high SPS pressure are the origin of anisotropy in the thermal conductivity.
IV. CONCLUSIONS
In summary, we investigated the influence of the SPS pressure on the anisotropy factor in the total thermal conductivity both perpendicular and parallel to the pressing direction. The measurements show that with increasing SPS pressure, the anisotropy factor gradually increases. When the SPS pressure is ≤20 MPa, there is no anisotropy difference in the thermal conductivity for the SPSed bulk material; whereas when the SPS pressure is 60 MPa, the anisotropy factor in the thermal conductivity is as large as 13–15%. High SPS pressure induces the preferred orientation of grains, resulting in a higher anisotropy factor in the thermal conductivity perpendicular and parallel to the SPS pressing direction.
ACKNOWLEDGMENTS
We thank the support received from the National Basic Research Program of China (Grant No. 2007CB607501) and the Natural Science Foundation of China (Grant Nos. 50731006 and 50672118), along with 111 Project (Grant No. B07040). The work at Clemson University was supported by DOE/EPSCoR Implementation Grant (DE-FG02-04ER-46139) and the SC EPSCoR cost sharing program. W. Xie would also like to thank the China Scholarship Council (CSC) for support in the form of a partial fellowship (No. 2008695022).