

INTRODUCTION
When injured, the peripheral terminals of dorsal root ganglion (DRG) neurons can regenerate whereas the central terminals usually die unless provided with a conditioning lesion (Lu and Richardson, Reference Lu and Richardson1991; Wu et al., Reference Wu, Zhang, Bo, Huang, Xiao and Zhang2007). Thus, dissociated DRG cells are useful tools for studying factors and pathways that control neurite extension and recovery (Lindsay, Reference Lindsay1988; Kimpinski and Mearow, Reference Kimpinski and Mearow2001; Leclere et al., Reference Leclere, Norman, Groutsi, Coffin, Mayer and Pizzey2007). We have previously shown that prostaglandin E2 can stimulate neurite retraction in rat DRG neurons by activating EP3 receptors (Wise, Reference Wise2006). To determine whether the EP3 receptor-dependent response was mediated through coupling to Gi/o or G12/13 proteins, we pretreated the DRG cell cultures with pertussis toxin (PTX) to inhibit Gi/o proteins. When DRG cell cultures were repeatedly removed from the cell culture incubator for quantifying neurite lengths, we noticed that the number of neurons expressing neurites in PTX-treated cells decreased one hour after the start of the experiment. The current study was designed to investigate the nature of this PTX-dependent neurite retraction response observed in DRG neurons.
Gi/o proteins are one of the most abundant proteins in neuronal growth cones suggesting an important role for Gi/o proteins in regulating neurite outgrowth and growth-cone guidance (He et al., Reference He, Neves, Jordan and Iyengar2006). However, while activation of Gi/o-dependent pathways by cannabinoid CB1, dopamine D3 and serotonin-1B receptor agonists can stimulate neurite extension (Swarzenski et al., Reference Swarzenski, O'Malley and Todd1996; Lotto et al., Reference Lotto, Upton, Price and Gaspar1999; He et al., Reference He, Gomes, Nguyen, Jayaram, Ram and Devi2005) and constitutively active Gαo expressed in PC12 and N1E-115 cells can increase the number of neurites per cell (Strittmatter et al., Reference Strittmatter, Fishman and Zhu1994), the activation of Gi/o-dependent pathways by mastoparan and GP55 caused growth-cone collapse and inhibition of neurite outgrowth, respectively (Igarashi et al., Reference Igarashi, Strittmatter, Vartanian and Fishman1993; Clarke and Moss, Reference Clarke and Moss1997).
DRG neurons consist of three main subpopulations separated by their biochemical and functional differences (Gavazzi et al., Reference Gavazzi, Kumar, McMahon and Cohen1999; Julius and Basbaum, Reference Julius and Basbaum2001). Large diameter neurons express phosphorylated heavy-chain neurofilament (NF200) with myelinated axons, and express tyrosine kinase neurotrophin receptors (TrkA, B and C) that can selectively bind nerve growth factor (NGF), brain-derived neurotrophic factor and neurotrophin-3, respectively (Priestley et al., Reference Priestley, Michael, Averill, Liu and Willmott2002). These large diameter neurons are responsible of proprioception and sensation of light touch. Small diameter neurons have unmyelinated or lightly myelinated axons and are responsible for nociception (Priestley et al., Reference Priestley, Michael, Averill, Liu and Willmott2002). Small diameter neurons can be further separated into two different subpopulations: (1) peptidergic neurons, which respond to NGF and express neuropeptides such as substance P and calcitonin-gene-related peptide (CGRP) (Snider and McMahon, Reference Snider and McMahon1998) and (2) non-peptidergic neurons, which respond to glial cell line-derived neurotrophic factor (GDNF) (Molliver et al., Reference Molliver, Wright, Leitner, Parsadanian, Doster and Wen1997; Bennett et al., Reference Bennett, Michael, Ramachandran, Munson, Averill and Yan1998; Snider and McMahon, Reference Snider and McMahon1998). In addition, neurons are identified by binding of lectins such as Griffonia simplicifolia isolectin B4 (IB4); IB4-positive (IB4+ve) neurons are GDNF-responsive (small diameter) and the IB4-negative (IB4−ve) neurons are NGF-responsive (large and small diameter) (Julius and Basbaum, Reference Julius and Basbaum2001).
In addition to neurons, DRG cell preparations contain non-neuronal cells such as satellite glial cells, Schwann cells and fibroblasts. Satellite glial cells normally form a tight sheath surrounding the sensory neurons and control the neuronal environment (Hanani, Reference Hanani2005), whereas myelin-expressing S100β-positive Schwann cells and glial acidic fibrillary protein (GFAP)-expressing Schwann cells ensheath the neurons (Campana, Reference Campana2007). Current studies provide evidence of bidirectional influence between neurons and these glial cells (Fields and Stevens-Graham, Reference Fields and Stevens-Graham2002; Nave and Trapp, Reference Nave and Trapp2008). Indeed, glial cells of the central nervous system are now viewed as a crucial third element of the synapse, and may be similarly important in the peripheral nervous system (Vesce et al., Reference Vesce, Bezzi and Volterra2001; Watkins et al., Reference Watkins, Hutchinson, Milligan and Maier2007; Filippo et al., Reference Filippo, Sarchielli, Picconi and Calabresi2008). Given the heterogeneous nature of a typical preparation of DRG cells, this study aimed to identify whether the PTX-dependent neurite retraction response was specific to any one of the three subpopulations of neurons and to determine whether the non-neuronal cells were involved in regulating this response.
OBJECTIVES
The primary goals of this study were:
• To investigate the observation that neurites of PTX-treated DRG cells retracted over a period of 2 h following the initial stimulus of removal from the cell culture incubator.
• To determine whether PTX-dependent retraction of DRG neurites was due to inhibition of Gi/o proteins.
• To determine whether a specific subset of DRG neurons was particularly susceptible to PTX treatment.
EXPERIMENTAL PROCEDURES
Preparation of primary cultures of adult rat DRG cells
The dorsal root ganglia were removed from all levels of the spinal cord of male Sprague–Dawley rats (150–200 g) and cultures were prepared as described previously (Rowlands et al., Reference Rowlands, Kao and Wise2001). All experiments were performed under licence from the Government of the Hong Kong SAR and endorsed by the Animal Experimentation Ethics Committee of the Chinese University of Hong Kong. Briefly, rats were anaesthetized and dorsal root ganglia were dissected into Ham's F14 medium (Ham's Nutrient Mixture F14 medium; JRH Bioscience, Kansas, USA) containing 4% Ultroser G (USG; Pall Life Science, France), penicillin (100 units/ml) and streptomycin (100 µg/ml)), followed by incubation with 0.125% collagenase (Roche Applied Science, Hong Kong), then 0.25% trypsin (Roche Applied Science, Hong Kong) in serum-free Ham's F14 medium. The dorsal root ganglia were resuspended in DNase I (90 µg/ml; Sigma, St. Louis, MO, USA) and soybean trypsin inhibitor (100 µg/ml; Sigma, St. Louis, MO, USA) and dispersed by trituration. The cell suspension was centrifuged through a cushion of bovine serum albumin (15%) to eliminate much of the cellular debris. The cell pellet was resuspended in Ham's F14 medium containing arabinoside C (10 µM) to inhibit non-neuronal cell proliferation. This mixed cell preparation was plated at 3000 neurons per well onto glass coverslips precoated with poly-dl-ornithine (500 µg/ml; Sigma, St. Louis, MO, USA) and laminin (5 µg/ml; Sigma, St. Louis, MO, USA) in six-well tissue culture plates, and assayed after 40 h in culture in an atmosphere of 5% CO2 at 37°C.
Preparation of neuron-enriched cell cultures
For neuron-enriched preparations, the mixed cells were plated on poly-dl-ornithine-coated tissue culture dishes (two rats per 6 cm dish), according to Lindsay (Reference Lindsay1988). After overnight incubation, the loosely attached neuronal cells were gently removed from the more firmly attached non-neuronal cells. Neuron-enriched cultures were plated at 3000 neurons per well, as described for the mixed cell preparation, and assayed after another 24 h in culture.
Cell selection
Subpopulations of DRG neurons were selected using magnetic bead-assisted cell sorting, as described by Tucker et al. (Reference Tucker, Rahimtula and Mearow2005). Briefly, streptavidin-coated Dynal beads (CELLection binding kits; Invitrogen, Hong Kong) were incubated with biotinylated IB4 (Sigma-Aldrich, St. Louis, MO, USA) immediately prior to use. Washed beads were incubated with the neuron-enriched cell preparation at 4°C for 30 min and then IB4+ve cells were captured with a Dynal magnetic separator. These cells were washed and then incubated with 1 ml of DNase I solution (200–300 U) for 10 min to release the selected IB4+ve cells from the beads. Both IB4+ve and IB4−ve cells were plated at 3000 neurons per well onto poly-dl-ornithine and laminin-coated glass coverslips in six-well tissue culture plates. Cells were assayed after 1 day (IB4−ve) or 2 days (IB4+ve), to allow time to establish neurite outgrowth comparable with neurons in the mixed cell preparation.
The remaining non-neuronal cells were harvested using trypsin (2.5% in phosphate-buffered saline (PBS)) and plated with 6000 cells per well onto poly-dl-ornithine and laminin-coated six-well tissue culture plates to prepare conditioned medium, or added back (3000 cells per well) into purified neuronal cell cultures.
Neurite retraction assay
Culture medium was replaced with Ham's F14 medium without AraC, and cells were incubated with PTX or PTX-B oligomer (100 ng/ml; List Biological Laboratories, Campbell, CA, USA) for 16 h before assay. Neurite-bearing neurons were defined as neurons with a neurite longer than the diameter of the cell body (Wise, Reference Wise2006; Franklin et al., Reference Franklin, Davies and Wyatt2009). One hour before stress induction (marked as time −1 h, basal), phase-contrast images of cells were captured over a period of 10 min per dish, using a stereoscopic microscope TMS-F with digital sight camera system TDS-L1 (Nikon). After approximately 40 min, cells were removed from the incubator for 20 min as the stress stimulus, then neurite-bearing cells were counted at time 0 h. The proportion of neurite-bearing neurons at subsequent time points (time 1, 2, 4 and 6 h) was also determined. The data were then normalized against the proportion of neurite-bearing neurons in each well at the start of the experiment (i.e. time −1 h). Photos were analyzed using Scion Image (Scion Corporation, Frederick, MD, USA) and Infraview (Austria). Six photos per well were chosen randomly, and the proportion of neurite-bearing neurons was calculated by counting a minimum of 100 neurons/well. The number of large diameter neurons (diameter >30 µm) and small diameter neurons (diameter <30 µm), as defined by Wewetzer et al. (Reference Wewetzer, Lausch and Christ1999), was also determined from these images.
Immunocytochemistry
Cells cultured on glass coverslips were preserved in kyrofix (ethanol:H2O:PEG 300 at 7.9:7.4:1) at 4°C until immunocytochemistry was performed (Raye et al., Reference Raye, Tochon-Danguy, Pouton and Haynes2007). Following washing with PBS, then fixing in ice-cold acetone–methanol (1:1) for 30 min, cells were then permeabilized with 0.03% Triton X-100 and blocked with 3% donkey serum (Jackson ImmunoResearch Laboratories, West Grove, PA, USA). For identification of neurons, antibodies against β-III tubulin (TUJ-1; 1:1000, abcam, Cambridge, MA, USA) were used. To identify neuronal subpopulations, we used biotinylated IB4 (1:250, Sigma, St. Louis, MO, USA) and antibodies against CGRP (1:1000, Sigma, St. Louis, MO, USA), TrkA (1:1000, Sigma, St. Louis, MO, USA), and heavy neurofilament NF200 (SMI32; 1:250, Covance, Berkeley, CA, USA). Glial cells were identified with anti-GFAP antibodies (1:100, Sigma, St. Louis, MO, USA). Cells were incubated with the primary antibodies at 4°C for 16–20 h, followed by fluoroscein isothiocyanate (FITC)- or Cy3-conjugated secondary antibodies (1:500, Jackson ImmunoResearch Laboratories, West Grove, PA, USA) for 1 h at room temperature. For IB4 detection, AMCA-streptavidin (1:250, Vector Labs, Burlingame, CA) was used. For nucleus staining, 0.2 µg/ml Hoechst 33342 (Invitrogen, Hong Kong) was added together with secondary antibody. The coverslips were mounted with glycerol (90%) on glass slides and imaged using a Zeiss Axioskop II Plus microscope with AxioCam digital camera. Bright field or phase contrast images and fluorescent images were merged using SPOT software (Diagnostic Instruments Inc., Sterling Heights, MI, USA). The number of immunoreactive neurons was determined by counting a minimum of 100 neurons in each of three to four independent experiments.
Adding back experiment
Purified non-neuronal cells were added to IB4+ve and IB4−ve cells to mimic the quantity of non-neuronal cells in mixed cell cultures. Therefore, 3000 neurons and 3000 non-neuronal cells were plated onto poly-dl-ornithine and laminin-coated glass coverslips in six-well tissue culture plates, and cultured for a further 40 h before assay.
Conditioned medium experiment
Purified non-neuronal cells were seeded onto poly-dl-ornithine and laminin-coated six-well tissue culture plates at 6000 non-neuronal cells per well and incubated for 16 h in Ham's F14 medium. On the day of neurite assay, non-neuronal cells were left at room temperature for 20 min to mimic the stress response of the mixed cell cultures. Medium was collected from both stressed and non-stressed non-neuronal cells. Medium from the IB4+ve and IB4−ve neuron cultures was aspirated and replaced with non-neuronal cell conditioned medium at time 0 h. The proportion of neurite-bearing neurons was determined from −1 to 2 h as described above.
Statistical analysis
Values reported are means±SEM. Comparisons between groups were made using ANOVA (analysis of variance) with Bonferroni's or Dunnett's post-tests, as appropriate, using GraphPad Prism software version 5.0 (GraphPad Software Inc., San Diego, USA). Statistical significance was taken as P < 0.05.
RESULTS
Characterization of different DRG cell cultures
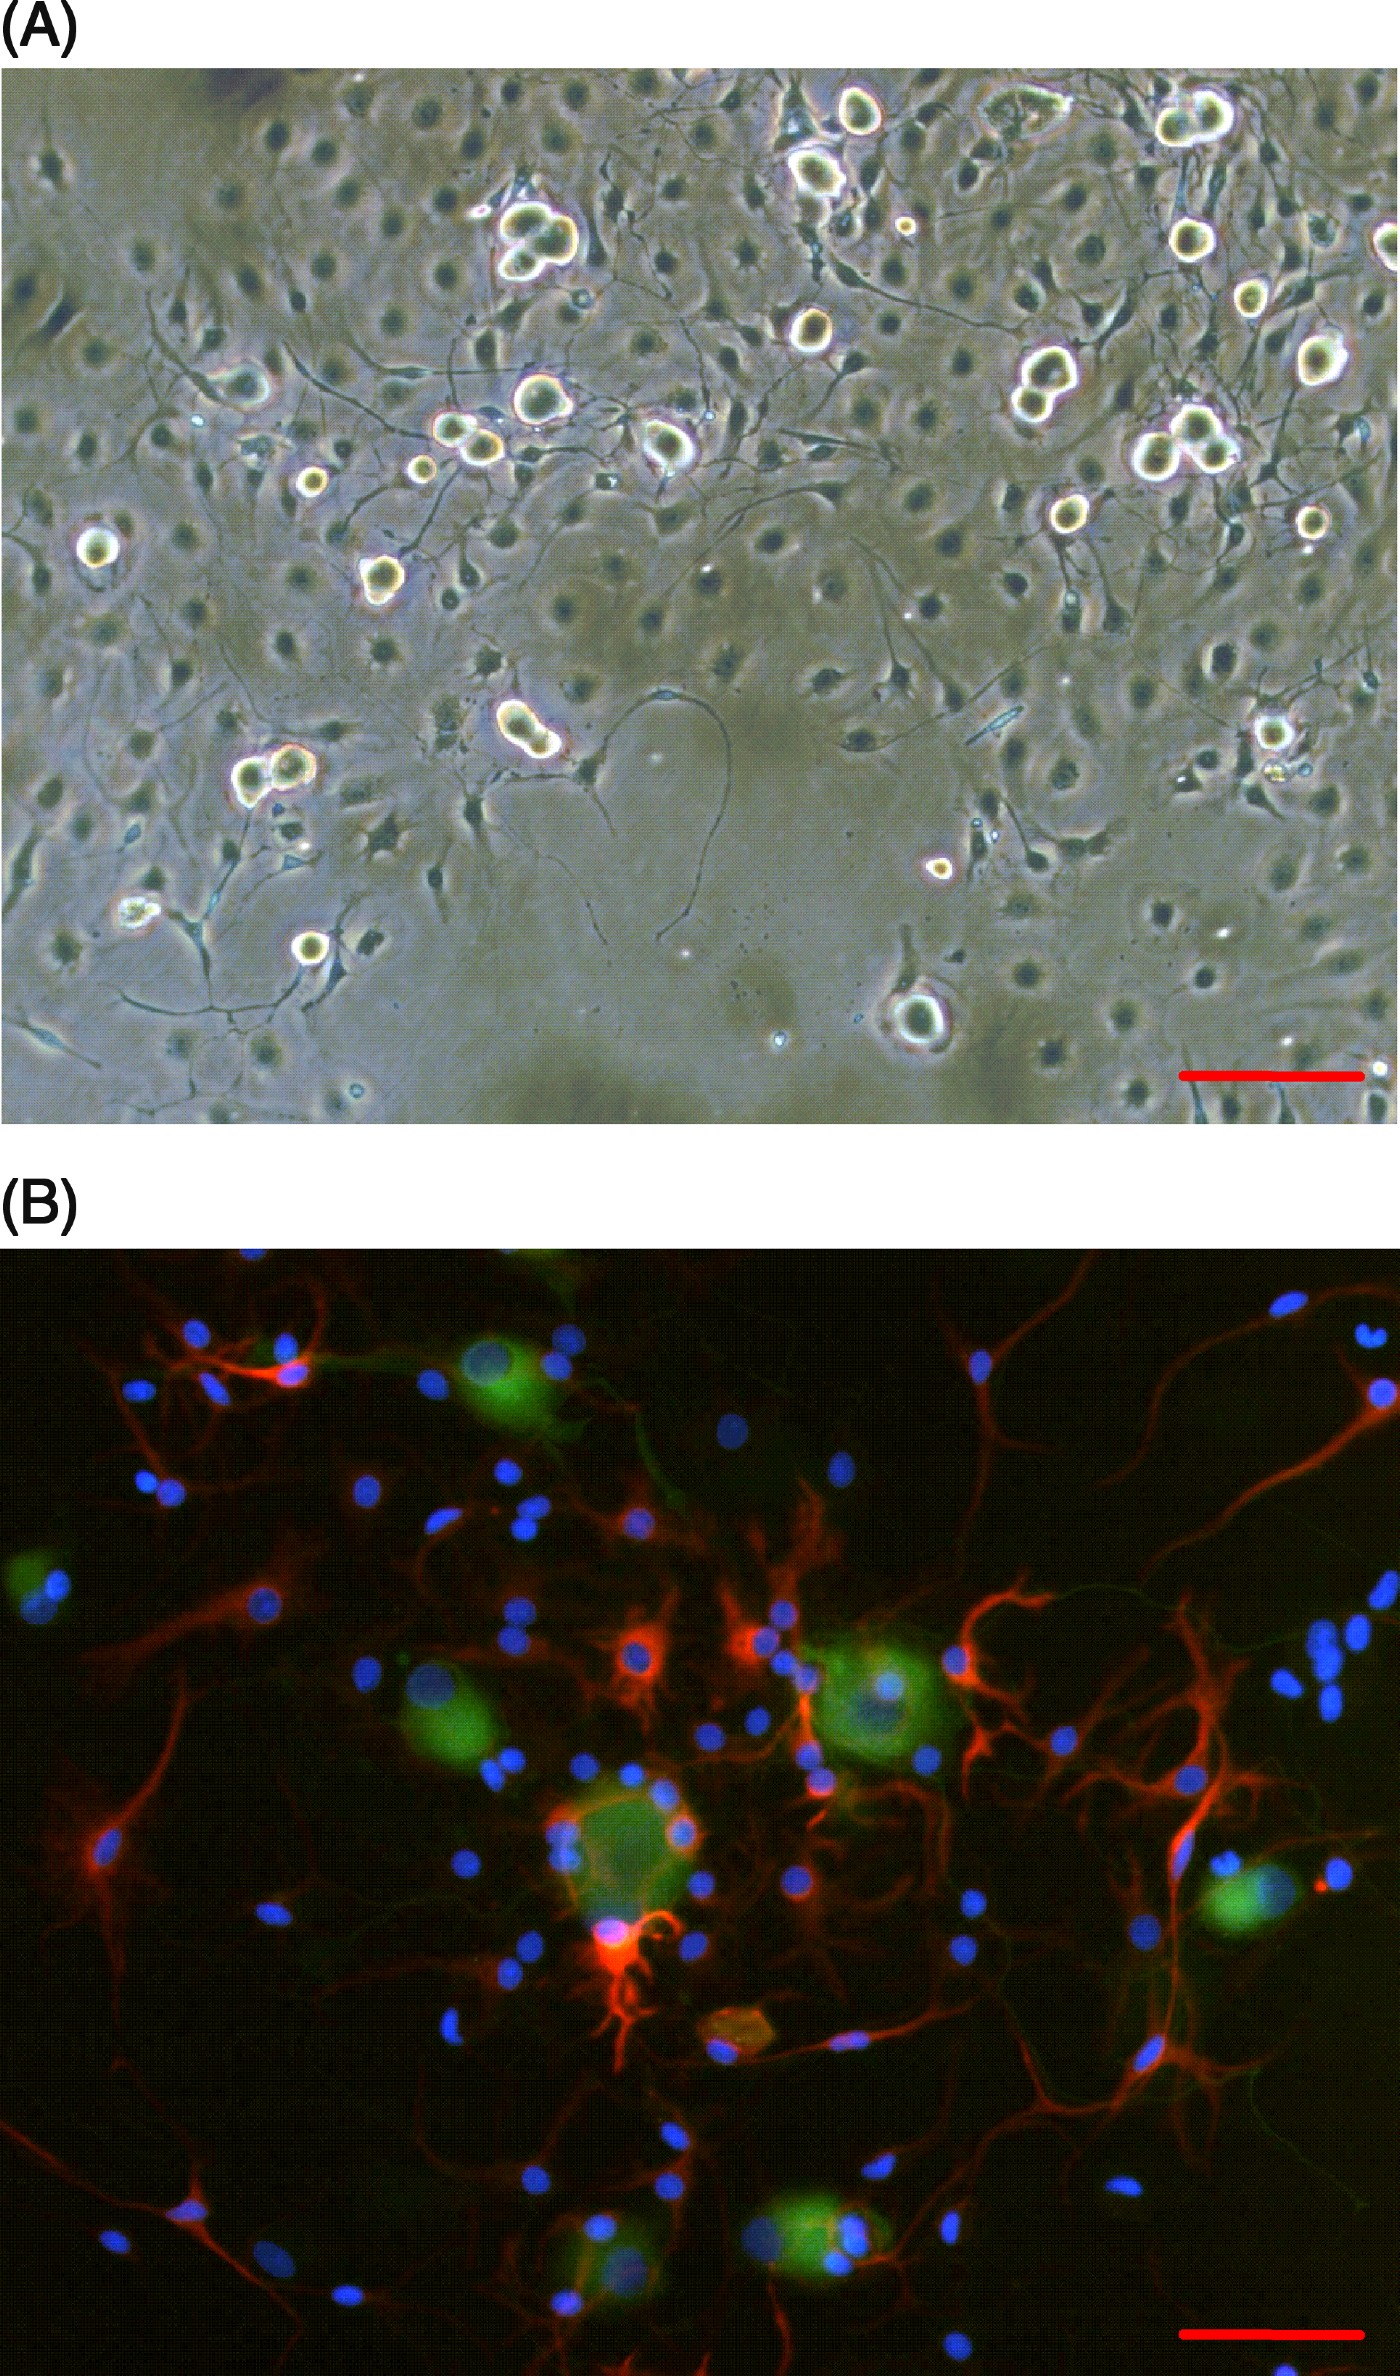
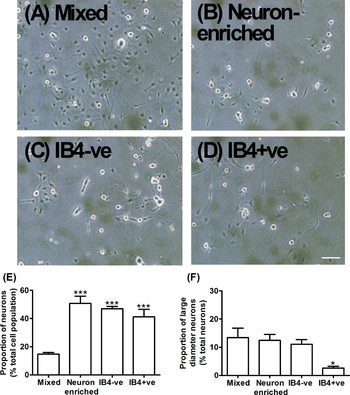
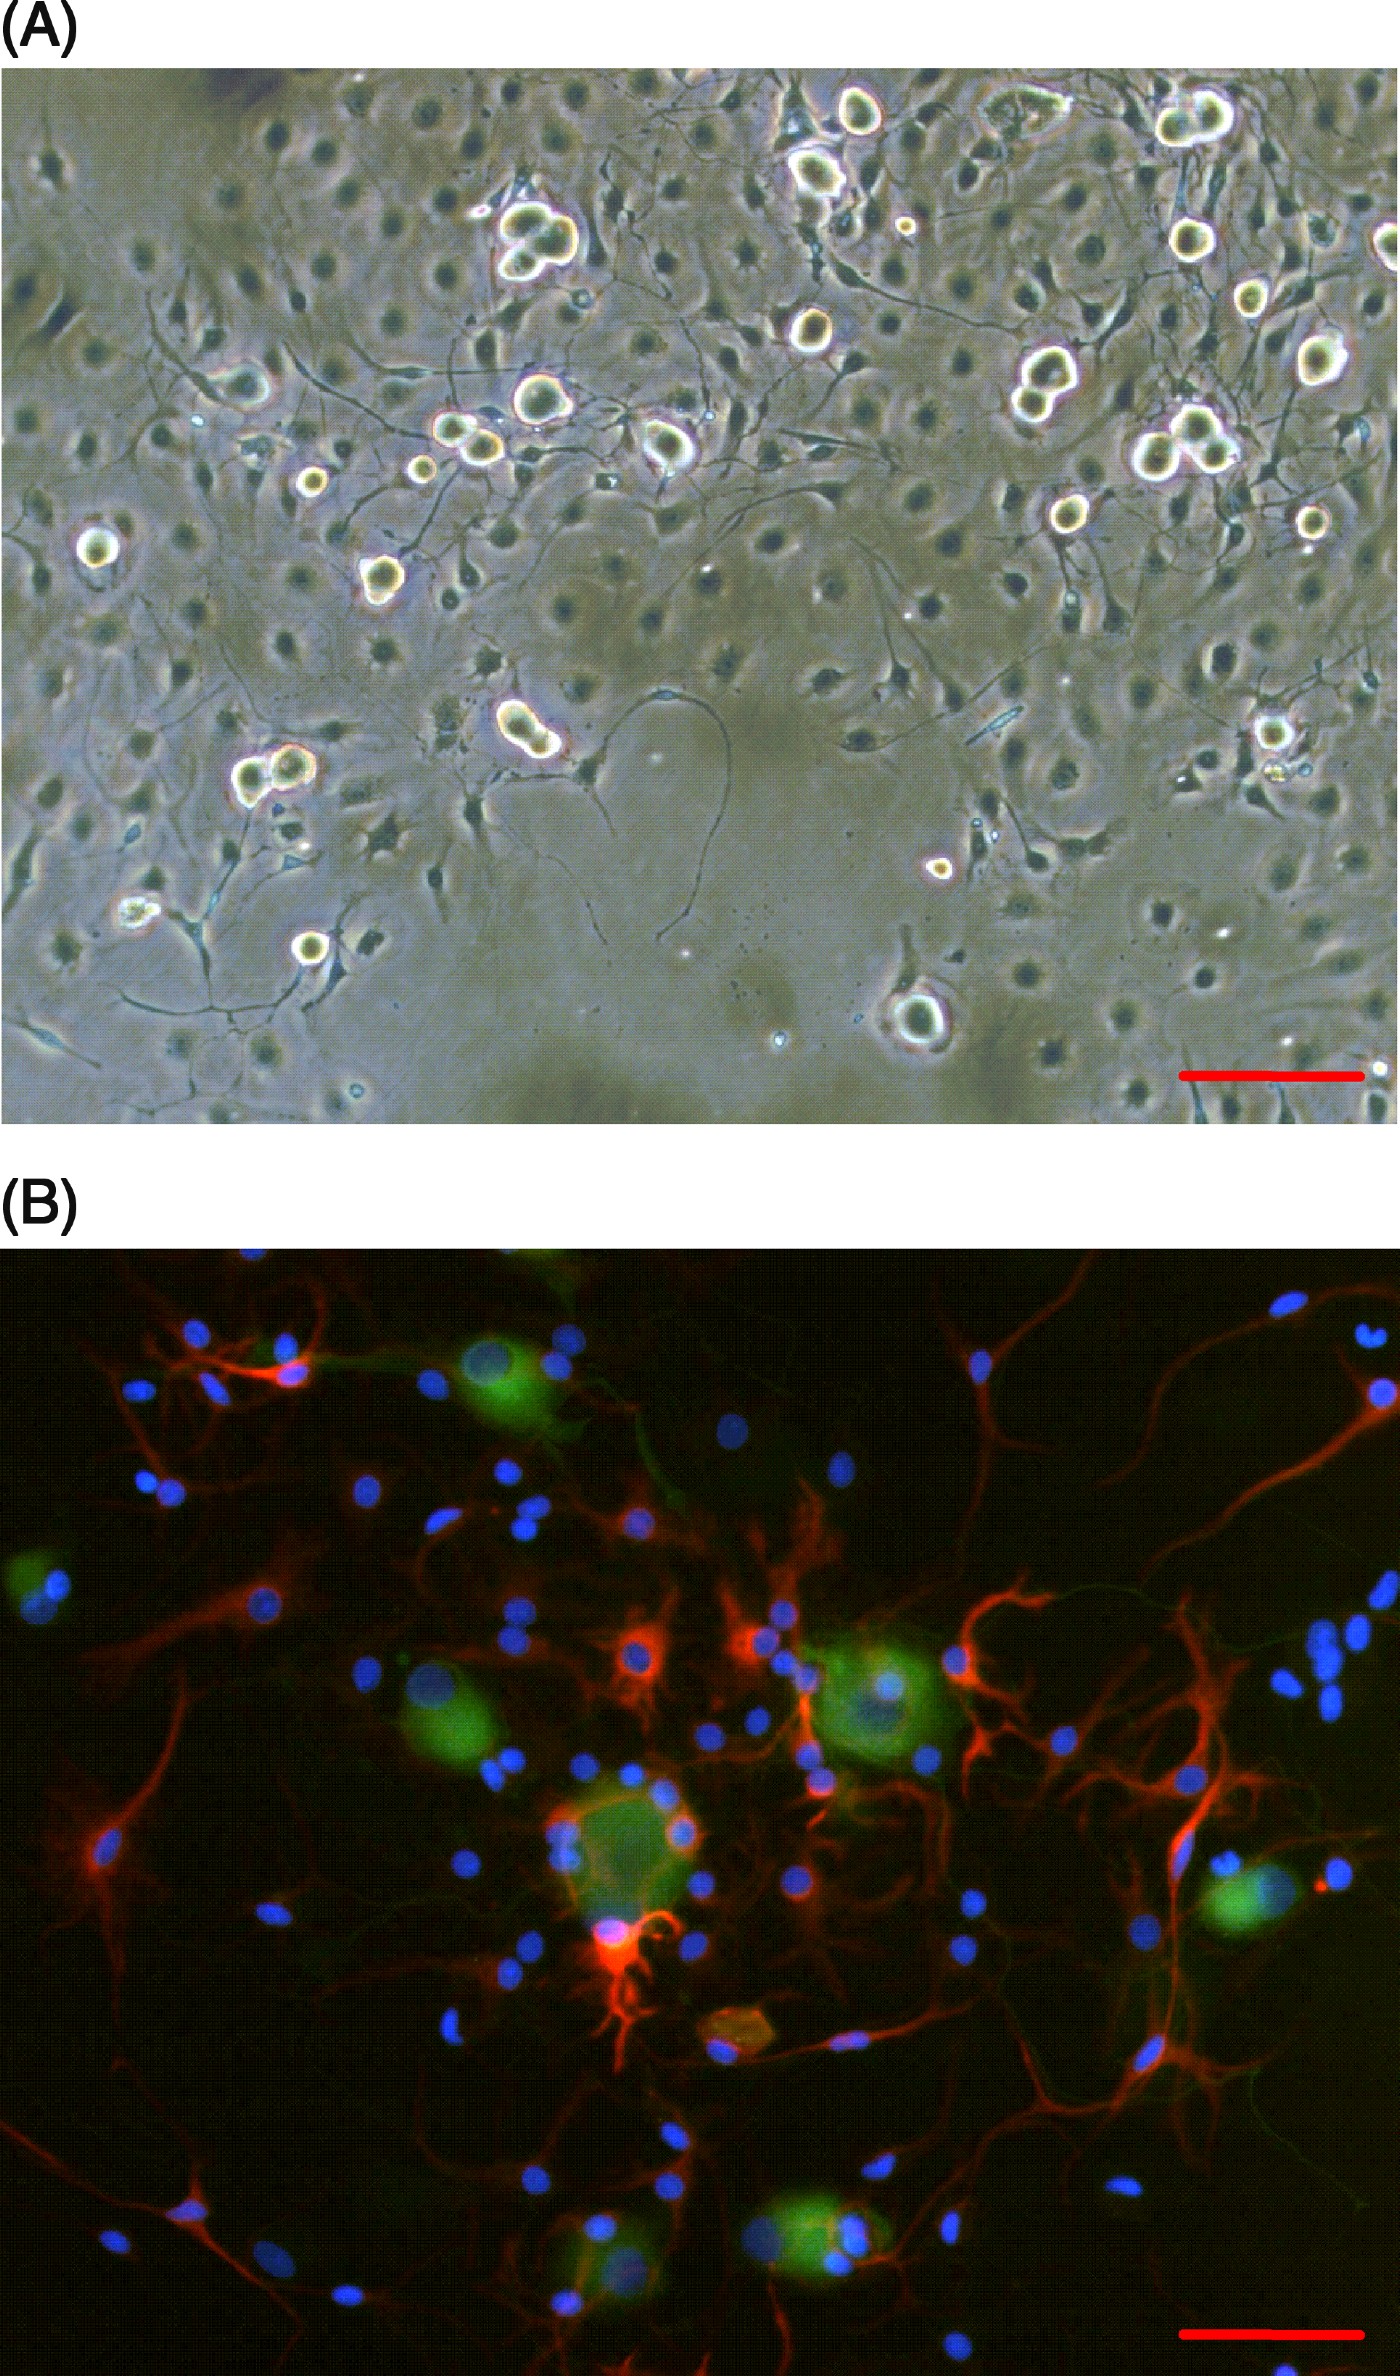
A typical mixed DRG cell preparation consisted of phase bright neurons surrounded by phase dark non-neuronal cells (Fig. 1A). The non-neuronal cells are likely to include glial cells (Schwann cells and satellite glial cells) and fibroblasts. Analysis by fluorescence microscopy showed TUJ-1-positive neurons surrounded by GFAP-positive glial cells (Fig. 1B). Some GFAP-negative non-neuronal cells were present, which are likely to be fibroblasts or non-myelinating Schwann cells (Campana, Reference Campana2007). The differential adhesion process decreased the proportion of contaminating non-neuronal cells (Fig. 2A–D), increasing the proportion of neurons in cell cultures from 15 to 51% of total cells (Fig. 2E). In mixed DRG cell preparations, 12±3% neurons had cell bodies >30 µm, and this proportion was significantly decreased to 3±1% in the IB4+ve cell preparation (Fig. 2F).
Mixed cultures of DRG cells contain neurons and non-neuronal cells. (A) Representative phase contrast microscopic field of typical dissociated DRG cultures on day 2, with neurons (phase bright) and non-neuronal cells (phase dark). (B) Representative fluorescence microscopic field of typical dissociated DRG cultures on day 2. Neurons were visualized with anti-TUJ-1 antibodies (green), glial cells with anti-GFAP antibodies (red) and nuclei with Hoescht stain (blue). Scale bars are 100 µm (A) and 25 µm (B).
Differential adhesion increased neuronal purity and MACS eliminated large diameter neurons from IB4+ve cell fraction. Phase contrast images of (A) mixed DRG cell culture, (B) neuron-enriched culture, (C) IB4−ve and (D) IB4+ve cell cultures. Scale bar is 100 µm. Quantification of neuronal cell purity (E) and proportion of large diameter neurons (F) of each DRG culture on day 2, from six independent experiments. *P < 0.05, ***P < 0.001 compared with mixed cells.

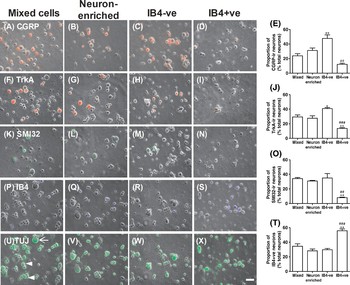
In the IB4−ve cell preparation, approximately 89% of neurons were small diameter neurons (Fig. 2F). As expected therefore, fluorescence microscopy (Fig. 3) indicated that the proportion of CGRP-ir neurons was also significantly greater in the IB4−ve cell preparation compared with the IB4+ve cell preparation (P < 0.01; Fig. 3E), demonstrating the enrichment of neuropeptide-containing neurons in the IB4−ve cells. Similarly, more of the IB4−ve cells expressed TrkA compared with IB4+ve cells (P < 0.001; Fig. 3J). In the IB4+ve cell preparation, the proportion of cells binding IB4 increased significantly from the mixed DRG cell culture (35±6 and 56±2% for mixed and IB4+ve cells, respectively; Fig. 3T), and the proportion of SMI32-positive cells decreased significantly (34±1 and 8±1% for mixed and IB4+ve cells, respectively; Fig. 3O). Thus, our IB4−ve and IB4+ve cell preparations represent IB4-depleted and IB4-enriched fractions, respectively.
Different DRG cell preparations express different neuronal cell markers. Neurons were identified on day 2 with phase contrast microscopy and TUJ-1 staining, and the number of neurons expressing CGRP (A–D, red), TrkA (F–I, red), SMI32 (K–N, green) or binding IB4 (P–S, blue) was determined. TUJ-1 staining in neurons corresponding to panels P–S is shown in panels U–X, with small diameter neurons (cell body <30 µm) marked with an arrowhead, and a large diameter neuron (cell body >30 µm) marked with an arrow (panel U). Scale bar is 25 µm. Data in panels E, J, O and T are means±SEM of three to four independent experiments. *P < 0.05, **P < 0.01 compared with mixed cells; ##P < 0.01, ###P < 0.001 compared with IB4−ve cells.

PTX-dependent neurite retraction response in mixed DRG cell cultures
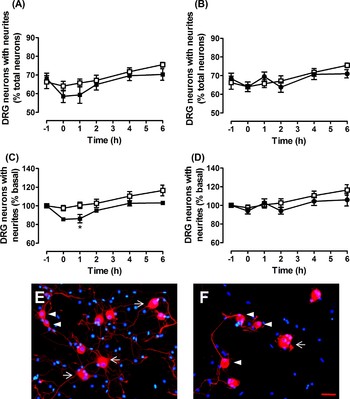
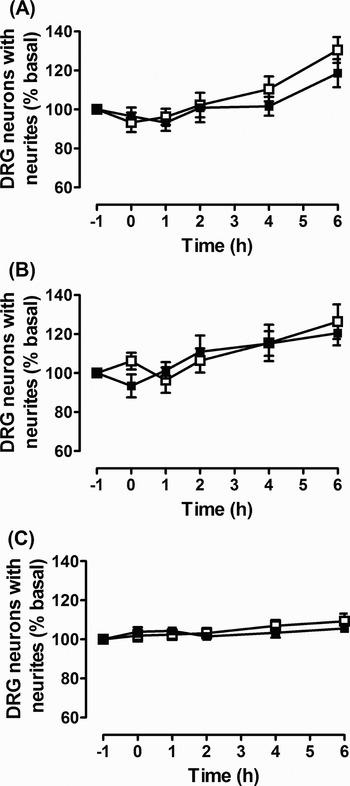
Overnight pretreatment of mixed DRG cell cultures with PTX or PTX-B had no effect on neurite outgrowth (Fig. 4A,B). The proportion of neurite-bearing neurons was 67±3% for the control group, 69±3% for PTX and 68±3% for PTX-B group. One hour after stress induction, there was a significant decrease in the proportion of neurite-bearing neurons in the PTX-treated cells (14±4% basal) which then recovered over the remaining 5 h of observation (Fig. 4A,C,E,F). In contrast, no neurite retraction response was observed in the PTX-B-treated cells (Fig. 4B,D).
PTX-treatment causes neurites to retract in mixed DRG cell cultures. Cells were incubated in control solution (Ham's F14 medium, □), with or without PTX (100 ng/ml, ■) or PTX-B (100 ng/ml, •) added 16 h before start (time = −1 h). Cells were removed from incubator at 20 min before time 0 to induce stress (time = 0 h). The proportion of cells with neurites was determined over the following 6 h. (A,B) Raw data showing the proportion of neurons expressing neurites, and (C,D) data normalized for each well of cells related to their initial values at time −1 (% basal). Data are means±SEM of ten wells from five independent experiments. *P < 0.05 compared with control group. (E,F) Representative images of control and PTX-treated cells, respectively, at time = 1 h. Neurons were visualized with anti-TUJ-1 antibodies (red) and nuclei were stained with Hoechst stain (blue). Small diameter neurons (cell body <30 µm) are marked with an arrow head, and large diameter neurons (cell body >30 µm) are marked with an arrow. Scale bar is 25 µm.

No PTX-dependent neurite retraction response in purified cultures
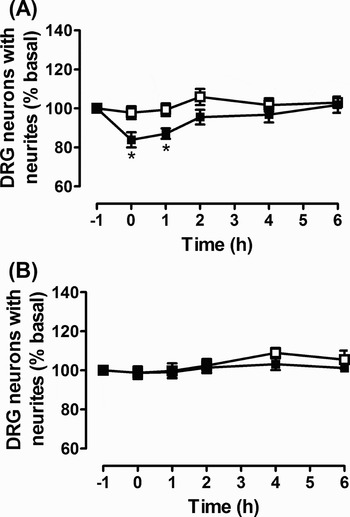
To determine whether all three major neuronal subtypes were affected by PTX, we prepared neuron-enriched DRG cell cultures which were further purified into IB4−ve and IB4+ve cells. However, none of these neuron-enriched DRG cell preparations displayed the PTX-dependent neurite retraction response observed previously in the mixed DRG cell cultures (Fig. 5). From analysis of phase contrast microscopy images, these purified cultures contained fewer phase dark non-neuronal cells compared with the mixed DRG cell cultures (Fig. 2). On the assay day, the proportion of neurons in these purified cultures (51±5, 47±2 and 41±5% for neuron-enriched, IB4−ve and IB4+ve cells, respectively) were significantly higher than that of the mixed DRG cell culture (15±1%; Fig. 2E).
No neurite retraction response was observed in neuron-enriched cultures of DRG cells. The time course effect of stress on neurite retraction by DRG neurons in purified neuron-enriched fraction of cells: (A) neuron-enriched cells, (B) IB4−ve cells and (C) IB4+ve cells. Cells were incubated in control solution (Ham's F14 medium, □), with or without PTX (100 ng/ml, ■) added 16 h before start (time = −1 h). The proportion of neurons with neurites has been normalized for each well of cells related to their initial values at time −1 (% basal). Initial values for control and PTX-treated cells, respectively, were 53±4 and 56±5% for neuron-enriched cells, 52±4 and 48±4% for IB4−ve cells and 70±4 and 67±4% for IB4+ve cells. Data are means±SEM of 12 wells from six independent experiments.

Reoccurrence of PTX-dependent neurite retraction response in IB4−ve cells supplemented with non-neuronal cells
In previous experiments, only neurons in mixed DRG cell cultures with large quantities of non-neuronal cells showed a PTX-dependent neurite retraction response. We therefore hypothesized that non-neuronal cells were essential for the PTX-dependent neurite retraction response. In order to mimic the non-neuronal cell environment of mixed DRG cells, 3000 non-neuronal cells were added back into the IB4−ve and IB4+ve cells. The proportion of neurite-bearing neurons decreased by 16% (P < 0.05) in PTX-treated IB4−ve cells supplemented with non-neuronal cells, but no response was observed in the non-neuronal cell supplemented IB4+ve cell preparations (Fig. 6).
PTX-dependent neurite retraction response reoccurred in IB4−ve cells supplemented with non-neuronal cells, but not in IB4+ve cells. (A) IB4−ve cells and (B) IB4+ve cells were supplemented with non-neuronal cells to mimic conditions in Fig. 7. Cells were incubated in control solution (Ham's F14 medium, □), with or without PTX (100 ng/ml, ■) added 16 h before start (time = −1 h). The proportion of neurons with neurites has been normalized for each well of cells related to their initial values at time −1 (% basal). Initial values for control and PTX-treated cells, respectively, were 73±5 and 75±2% for IB4−ve cells, and 69±4 and 65±4% for IB4+ve cells. Data are means±SEM of six wells from three independent experiments. *P < 0.05 compared with control group.

Conditioned medium from non-neuronal cells also facilitates the PTX-dependent neurite retraction response of IB4−ve cells
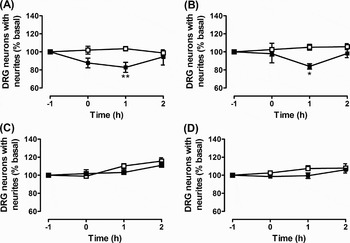
To determine whether physical contact between neurons and non-neuronal cells was essential for the PTX-dependent neurite retraction response, we tested the effect on IB4−ve and IB4+ve cells of medium conditioned by non-neuronal cells (Fig. 7A,C). In addition, we subjected only the non-neuronal cells to the stress stimulus and added conditioned medium from these cells to the IB4−ve and IB4+ve cells (Fig. 7B,D). Data in Fig. 7 show that conditioned medium from both non-stressed and stressed non-neuronal cells allowed for the PTX-dependent neurite retraction response in IB4−ve cells (Fig. 7A,B), but not in IB4+ve cells (Fig. 7C,D). The proportion of neurite-bearing IB4−ve cells decreased significantly after 1 h by 17 and 16% in the presence of conditioned medium from non-stressed and stressed non-neuronal cells, respectively.
Non-neuronal cells constitutively release factor/s facilitating PTX-dependent neurite retraction. The time course effect of non-neuronal cell conditioned medium on neurite retraction by DRG neurons in IB4−ve (A,B) and IB4+ve cell cultures (C,D). Cells were incubated in control solution (Ham's F14 medium, □), with or without PTX (100 ng/ml, ■) added 16 h before start (time =−1 h). Non-stress conditioned medium (A,C) and stress-conditioned medium (B,D) allowed PTX-dependent neurite retraction only in IB4−ve cells. The proportion of neurons with neurites has been normalized for each well of cells related to their initial values at time −1 (% basal). Initial values for control and PTX-treated cells, respectively, were 70±2 and 75±2% for IB4−ve cells, and 67±5 and 78±1% for IB4+ve cells. Data are means±SEM of seven to nine wells from three independent experiments. *P < 0.05, **P < 0.01 compared with control group.

The PTX-dependent neurite retraction response is only observed in large diameter IB4−ve neurons
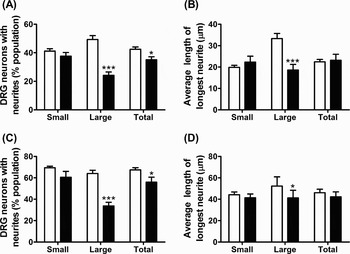
Size analysis of cells used in Fig. 7A,B showed that the proportion of large diameter IB4−ve cells expressing neurites decreased significantly from 49±3 to 24±2%. Therefore, the PTX-dependent neurite retraction response was only observed in large diameter (>30 µm) neurons (Fig. 8A). Furthermore, we determined that the average length of the longest neurite was significantly decreased (from 33±2 to 19±3 µm) only in the large diameter IB4−ve neurons (Fig. 8B). As these data were taken from IB4-depleted cell populations with medium conditioned by non-neuronal cells, we performed a similar analysis on mixed populations of cells and obtained a similar profile of responses (Fig. 8C,D). Only large diameter neurons showed a significant decrease in the expression of neurites (64±3 to 34±3%) and a significant decrease in the average length of the longest neurite (52±9 to 41±7 µm) following PTX-pretreatment.
Only large diameter neurons display PTX-dependent neurite retraction. Size analysis shows the proportion of small and large neurons expressing neurites and the length of the longest neurite in (A,B) IB4−ve cells (data from Fig. 7A), and (C,D) mixed cell populations (data from Fig. 4A). Data at time −1 h (open bars) and at 1 h (filled bars). Data are means±SEM of eight wells (for A and B) and 4 wells (for C and D) from three independent experiments with a minimum of 100 cells counted per well. *P < 0.05, ***P < 0.001 at time 1 h compared with time −1 h of each group.

CONCLUSIONS
• Pretreatment of mixed DRG cell cultures with PTX, but not with PTX-B, causes retraction of neurites when cells undergo the ‘stress’ of removal from the cell culture incubator.
• Neurite retraction is not seen in neuron-enriched cell cultures.
• Condition medium from non-neuronal cells facilitates PTX-dependent neurite retraction.
• Large diameter IB4−ve neurons are most responsive to PTX-pretreatment.
DISCUSSION
PTX inhibits Gi/o-proteins by ADP-ribosylation of the Gαi-subunit (Tamura et al., Reference Tamura, Nogimori, Murai, Yajima, Ito and Katada1982) and is therefore a useful tool to investigate the role of Gi/o-dependent cell signaling pathways. When used to determine whether the EP3 receptor-dependent retraction of DRG neurites was mediated through coupling to Gi/o or G12/13 proteins (Wise, Reference Wise2006), we noticed that the number of neurons expressing neurites was reversibly decreased in PTX-treated cells. The current study was designed to investigate this PTX-dependent neurite retraction response and to determine whether this response was specific to any particular subset of DRG neurons. Our data clearly show that neurites retract in approximately 15% of PTX-treated cells, and that this effect appears to be reversible. Moreover, PTX-treatment alone is not sufficient to generate this response, as the proportion of neurite-bearing neurons was unchanged at the start of the experiment. The stimulus for this PTX-dependent neurite retraction response was simply removing the cells from the incubator in order to monitor neurite outgrowth over time. And, while the cells responded to the initial stimulus, they appeared to become resistant to subsequent stimuli over the course of 6 h of observation. Although it is possible that the cells which retracted their neurites subsequently died, thus leaving the viable neurons to continue to express neurites, we saw no evidence of substantial cell death in these experiments. We have therefore referred to this stimulus simply as a stress response as we have not presently investigated the multifactorial process involved in what is otherwise a routine laboratory procedure. PTX consists of two subunits; the B-oligomer helps to anchor the toxin to the cell surface allowing for internalization of the A-promotor and subsequent ADP-ribosylation of Gαi-subunits (Wong and Rosoff, Reference Wong and Rosoff1996). The PTX-B-oligomer is not inert and has been shown to block growth-cone collapse in embryonic chick DRG cells (Kindt and Lander, Reference Kindt and Lander1995). However, because the B-oligomer had no effect on neurite extension in the current study, we conclude that the PTX-dependent neurite retraction response involves direct inhibition of Gαi-proteins.
To investigate whether this response was specific to any particular subset of DRG neurons, we prepared neuron-enriched cultures. Full characterization of our DRG cell preparations showed that the cell size distribution (i.e. proportion of small and large diameter neurons) and the expression of neuron-specific markers (CGRP, TrkA and SMI32 immunoreactivity, and IB4-binding) were similar in mixed DRG cell cultures and neuron-enriched cell preparations. The use of MACS technology, as described by Tucker et al. (Reference Tucker, Rahimtula and Mearow2005), generated a cell population enriched in IB4+ve neurons. In agreement with previous reports (Molliver et al., Reference Molliver, Wright, Leitner, Parsadanian, Doster and Wen1997; Bennett et al., Reference Bennett, Michael, Ramachandran, Munson, Averill and Yan1998; Snider and McMahon, Reference Snider and McMahon1998; Stucky and Lewin, Reference Stucky and Lewin1999), the IB4+ve neurons were predominantly small diameter non-peptidergic neurons. In contrast, the IB4−ve cells were predominantly small diameter peptidergic neurons and large diameter non-peptidergic neurons expressing heavy neurofilament (Figs 2 and 3). Although the selection procedure clearly enriched the proportion of small diameter, IB4-expressing neurons, we were unable to generate cell populations in excess of 60% purity. Our data would suggest that IB4+ve neurons represent a small fraction of total DRG neurons as the percentage of IB4+ve neurons was similar in the neuron-enriched and IB4−ve cultures. Furthermore, morphometric analysis showed that only 10% of neurons in the IB4−ve population were >30 µm in diameter, yet approximately 35% were NF200-positive. This discrepancy might be due to binding of anti-heavy neurofilament antibodies to IB4+ve neurons (Leclere et al., Reference Leclere, Norman, Groutsi, Coffin, Mayer and Pizzey2007).
DRG neurons from adult rats do not require exogenous growth factors (Lindsay, Reference Lindsay1988), and as a significantly greater proportion of IB4−ve cells expressed TrkA-immunoreactivity, this is likely responsible for the more rapid neurite extension observed in these cells. In contrast, the GDNF-responsive IB4+ve cells required an extra day in culture to generate a comparable number of neurite-bearing neurons. The slower extension of neurites by GDNF-responsive cells compared to NGF-responsive cells has been previously reported (Tucker et al., Reference Tucker, Rahimtula and Mearow2006; Leclere et al., Reference Leclere, Norman, Groutsi, Coffin, Mayer and Pizzey2007).
In contrast to our observations of a PTX-dependent neurite retraction response in mixed DRG cell cultures, no such response was seen in any of the three neuron-enriched cell cultures. We used a differential adhesion and replating method to prepare these neuron-enriched cell cultures, but this procedure is unlikely to alter the general properties and responsiveness of neurons (Heblich et al., Reference Heblich, England and Docherty2001). Neurite outgrowth was similar in mixed and neuron-enriched cell cultures, therefore we hypothesized that the removal of ‘contaminating’ non-neuronal cells had caused the loss of the PTX-dependent neurite retraction response in the neuron-enriched cell cultures. Studies have shown that glial cells contribute to the normal function of neurons, such as substance P release, bradykinin evoked inward currents and pain behavior (Heblich et al., Reference Heblich, England and Docherty2001; Dublin and Hanani, Reference Dublin and Hanani2007; Tang et al., Reference Tang, Li and Nakata2007). Therefore, to verify this hypothesis, non-neuronal cells were added back to the purified neuronal cell cultures. Interestingly, after supplementation with non-neuronal cells, the PTX-dependent neurite retraction response was restored, but only in the IB4−ve cell fraction. This result confirmed our hypothesis and has identified an important role for non-neuronal cells in facilitating PTX-dependent neurite retraction.
Our non-neuronal cell fraction consists primarily of glial cells (Schwann cells and satellite glial cells). Neurons and glial cells are known to communicate with each other through the release of factors such as adenosine triphosphate (ATP) (Zhang et al., Reference Zhang, Chen, Wang and Huang2007) or by direct interaction with specific cell adhesion molecules on glial cell membranes (Fields and Stevens-Graham, Reference Fields and Stevens-Graham2002); both such interactions were possible in our assays. Our studies clearly demonstrated that direct cell–cell contact was not required for the effect of non-neuronal cells, as addition of medium conditioned by non-neuronal cells also allowed for detection of the PTX-dependent neurite retraction in IB4−ve cells. Furthermore, there was no difference in the extent of this effect if the stress stimulus was applied directly to the non-neuronal cells rather than to the neuronal cells. Therefore, the initial removal of cells from the incubator for 20 min (at time −1 h) was sufficient to initiate the neurite retraction response. The stress stimulus appears to directly affect the neuronal cells, but under control conditions no dramatic effect is observed on cell morphology. However, when Gi/o-proteins were inhibited by PTX then factor/s constitutively released by non-neuronal cells caused retraction of neurites following this stress stimulus. At the present time, we are unable to separate the satellite glial cells and Schwann cells to produce the pure cell preparations needed to identify the source of such constitutively released factor/s.
Of the two readily separable neuronal cell populations, only the IB4−ve cells display this PTX-dependent neurite retraction response. The IB4−ve cell fraction includes large diameter proprioceptive neurons and small diameter peptidergic nociceptors (Julius and Basbaum, Reference Julius and Basbaum2001; Fang et al., Reference Fang, Djouhri, McMullan, Berry, Waxman and Okuse2006). Cell size analysis showed that the large diameter IB4−ve cells were the principal cell types responsive to PTX. Interestingly, large diameter NF200-positive neurons are more susceptible to injury as they require both peripheral and central neurotrophic factors to survive. NF200-positive neurons were reduced substantially after either dorsal rhizotomy (central) or peripheral axotomy, whereas IB4+ve neurons decreased only after combined injury (Guseva and Chelyshev, Reference Guseva and Chelyshev2006). While our large diameter IB4−ve neurons may lack a crucial neurotrophic factor, this is unlikely to be the primary cause of the PTX-dependent neurite retraction response because our cells lose this response over time and there is no evidence of cell death. Furthermore, it is therefore likely that non-neuronal cells release ligands for Gi/o-coupled receptors located specifically on large diameter IB4−ve cells, and this hypothesis is currently under investigation. It has been suggested that the characteristics of satellite glial cells correlate with the size and function of the neuron they envelope (Nascimento et al., Reference Nascimento, Santiago, Marques, Allodi and Martinez2008); therefore, it is conceivable that neurite extension/retraction by the large diameter IB4−ve neurons is mediated by a specific subset of satellite glial cells. In addition, these responsive neurons might also be identifiable by their sensitivity to specific neurotrophins. However, investigations such as these first requires the ability to produce much purer cell preparations of subsets of DRG neurons and glial cells.
In conclusion, we have identified a regulatory response, mediated by Gi/o-proteins, which prevents retraction of neurites in large diameter IB4−ve cells of adult rat DRG. The non-neuronal cells of adult rat DRG constitutively release factor/s that can stimulate neurite retraction of a subset of isolated DRG neurons, but this property of non-neuronal cells is only observed when the Gi/o-proteins of large diameter IB4−ve cells are inhibited.
ACKNOWLEDGEMENT
This work was supported by a grant from the Research Grants Council of the Hong Kong Special Administrative Region (CUHK4516/06M).
Statement of interest
None