Our knowledge of the welfare of the Russian population in the past is extremely unsatisfactory. Peasant living standards in pre-revolutionary times have traditionally been seen as very low, their trend as stagnant or falling. Shackled by the archaic institutions of serfdom and communal land tenure, peasants were squeezed between growing exploitation from above and growing population pressure from below. The abolition of serfdom in 1861 accomplished little, in this view. It may even have made things worse by reinforcing the commune, reducing the size and quality of household land allotments, and disguising an increased burden of payments to landowners and the state.
Such views have been widely influential in the West. They underlie Alexander Gerschenkron's account of Russian industrialization based on the forcible transfer of resources from agriculture under both Tsars and Soviets, for example. Soviet researchers pushed this interpretation even further. Ideologically motivated to uncover evidence of a Marxist law of the relative and absolute impoverishment of the working classes, Soviet historians found decline wherever they looked—even in the Middle Ages. Stanislav Strumilin went so far as to claim that real wages in the metallurgical industry declined by 60 percent from 1647 to 1860, then fell to only 15 percent of 1860 levels by 1913. The same author's estimate that 1913 real wages were higher in Russia than in Western Europe implies quite extraordinary living standards for seventeenth-century Russians.Footnote 1
The evidence for claims about peasant living standards is quite weak, however. In some cases the problem is with the sources. For example, the Descriptions of Seigniorial Estates compiled prior to the Emancipation overstated the value of peasant obligations because landowners hoped for more generous settlements. Meanwhile, the oft-cited grain harvest data reported by provincial governors in the late eighteenth and early nineteenth centuries were understated, in order to forestall unwelcome taxation or military requisitions.Footnote 2 In other cases, such as parish records and population censuses that might yield reliable long-run estimates of demographic rates, data are simply scarce.Footnote 3 Studies of individual estates, such as Steven Hoch's investigation of Petrovskoe or Tracy Dennison's study of Voshchazhnikovo, have yielded detailed data on peasant demographic behavior, consumption, involvement in the market, and harvests. But a central message of these studies is the diversity of local peasant experience and the perils of generalization.Footnote 4
For the later part of the nineteenth century, official data are both more abundant and more reliable, first-world statistical sophistication in a third-world context, as Stephen Wheatcroft has put it.Footnote 5 The interpretation of these data has been the subject of some debate, however. Increases in indirect tax revenue, redemption tax arrears, and migratory labor have been interpreted alternatively as indicators of both distress and success in the peasant economy.Footnote 6 On balance, though, recent work by quantitative researchers such as Wheatcroft, James Simms, Boris Mironov, and Paul Gregory is moving the consensus on late Tsarist economic development away from agrarian crisis interpretations and toward a cautiously optimistic assessment.Footnote 7
For earlier periods, weaker source material and relative neglect have left matters in a less satisfactory state. Even on basic issues such as the supply of staple food crops, uncertainty reigns. In the 1960s Ivan Koval'chenko, doyen of Soviet quantitative historians, maintained that per capita consumption was falling over the first half of the nineteenth century, because agricultural output failed to keep up with population growth.Footnote 8 In the West, meanwhile, the equally authoritative Jerome Blum claimed that grain was abundant in Russia in this period, even in oversupply, compared with most of Europe. A generation later, such issues have not been resolved, the (generally optimistic) results of recent estate studies notwithstanding. “All attempts to measure Russian peasants' levels of consumption have been fraught with difficulty,” concludes a survey of the literature.Footnote 9
In this context, the study of human heights has the potential to generate fresh insights into historical living standards in Russia. Relatively abundant data largely bypass the problems of reliability and representativeness that plague other sources (though not being entirely free of problems of their own). Several constituencies collected, analyzed, and published anthropometric data in late tsarist Russia as well as in the Soviet period, including public health specialists, anthropologists, the clothing industry, and of course, the military. The army measured the heights of new recruits to record a basic identifying characteristic and to verify that they satisfied a minimum height requirement.Footnote 10 Military records documenting stature reach right back to the first half of the eighteenth century and offer comprehensive coverage: all types of peasants (state, crown, seigniorial), with all types of feudal obligations (obrok cash dues, barschina labor services), from city and country, and from all regions of Russia.
An individual's stature reflects both genetically determined potential height, which is randomly distributed in a population, and environmentally determined net nutritional status during the growing years. Differences in mean height in a population, over time or across groups, reflect differences in net nutrition, which is the balance between the intake of nutrients and the demands on them represented by basal metabolism, work, and disease. Mean height is thus an aggregative measure of living conditions, sensitive not just to per capita income but also such factors as quality of diet, work effort, disease exposure, and inequality. This inclusiveness is a great advantage for the researcher interested in overall quality of life, or inclined to interpret factors such as malnutrition-induced susceptibility to disease as an endogenous reflection of economic conditions. For the researcher seeking a “clean” indicator of per capita income, it is instead a confounding factor, necessitating the collection and evaluation of complementary evidence on specific aspects of living conditions.Footnote 11
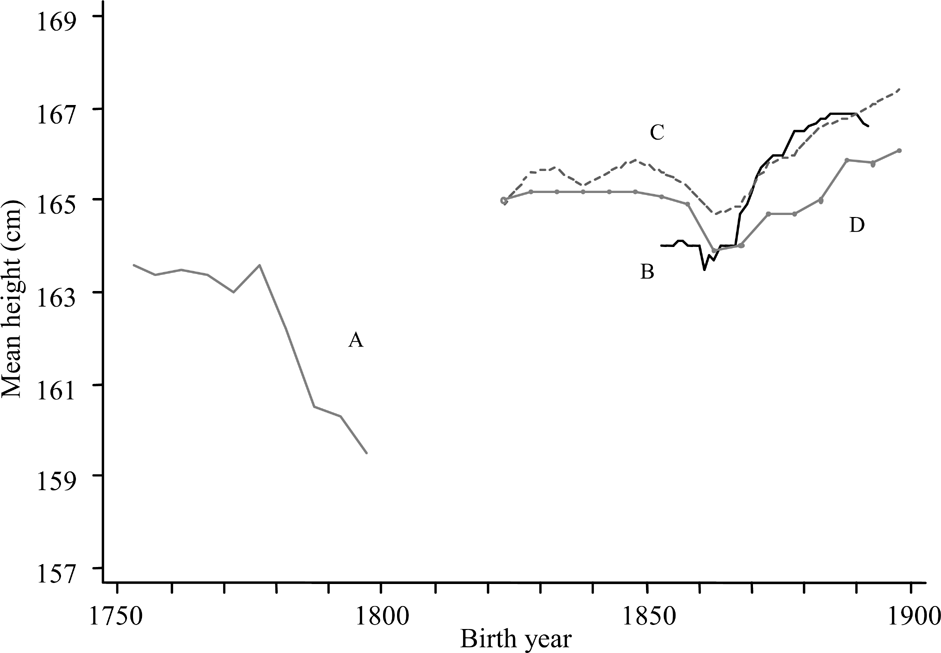
Recent papers by Mironov have highlighted the potential of anthropometric research for reevaluating Russian and Soviet living standards. A 1999 study relies on mean heights and height distributions reported in late-nineteenth- and early-twentieth-century published sources. Three series from that paper are plotted in Figure 1, with data for army conscripts (Series B), Moscow workers (Series C), and rural workers in central Russia (Series D). Heights are stable at a surprisingly high level across the middle decades of the century, and grow rapidly towards its end. There is no sign of a drawn-out agrarian crisis either leading to or resulting from the emancipation of 1861. (The apparent decline in the 1860s can be attributed to workers born in that decade being measured in the early 1880s, before reaching their final height.) A more recent (2005) study is based on a large sample of individual heights drawn from archival records on navy and artillery conscripts in the eighteenth century. Mean heights in this series display a remarkable 4 cm decline from the 1750s to the 1790s (Figure 1, Series A). Mironov attributes this dramatic deterioration in living conditions to a growing burden on the peasantry of feudal dues and taxes.
PREVIOUS ESTIMATES OF ADULT MALE HEIGHT IN RUSSIA

These intriguing results must be regarded as preliminary, however. An obvious gap in Figure 1 is a complete absence of data for the early nineteenth century that might link the very low heights of the 1790s with the surprisingly tall statures in the 1820s and 1830s. The accuracy of the eighteenth-century estimates is open to question as well, for they are sample averages that correct only crudely for variation in age and do not account for truncation induced by (varying) enforcement of (changing) minimum height requirements. The nineteenth-century estimates have their own problems. The military data, based on enlisted recruits, suffer from truncation. The data on workers in Moscow city and rural central Russia are cobbled together from separate studies conducted between the 1880s and the 1920s. The earliest estimates, for the 1820s, may be biased upward due to survival effects among individuals aged 60 and above when they were measured in the early 1880s.Footnote 12
This article introduces a large new dataset of nearly 20,000 recruits from the province of Saratov, born between the mid-eighteenth and the mid-nineteenth centuries. It refines the statistical analysis of earlier work through the application of maximum likelihood techniques to both the new individual-level data and a complementary dataset of aggregated height frequencies that extend the period under study to the end of the nineteenth century.
SARATOV PROVINCE: A HISTORICAL SKETCH
Saratov gubernia (province) was chosen for study on the basis of its excellent data availability and typical patterns of agricultural production and peasant life. The city of Saratov is located on the Volga River in Russia's Southeast. Comprising districts on both sides of the Volga until 1851, the province had an area larger than modern Belgium.Footnote 13 Ecologically, the region is a transition zone between the forested and the open steppe; along a gradient running from northwest to southeast through the territory, rainfall and forest cover diminish, with decidedly dry conditions prevailing east of the Volga. Fertile chernozem (black earth) soil prevails through much of the province and average temperatures are warmer than in central and northern Russia, making conditions favorable for wheat cultivation when rainfall is adequate.Footnote 14
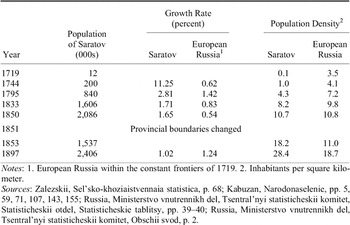
Saratov city was founded in 1590 as a fortified outpost on the military frontier, like its riparian neighbors Samara and Tsaritsyn (later Stalingrad). Only in the 1720s did the establishment of a secure defensive perimeter of fortifications and Don Cossack military settlers afford the region real stability. From this point, in-migration accelerated and population grew rapidly, from just 12 thousand in 1719 to approximately one million in the early 1800s (Table 1). Migration took several forms. There were small numbers of fugitives, religious dissidents, Cossacks, non-Russians, and military settlers, especially in the early years. Foreign immigration was encouraged at times; the troubled history of the Volga Germans began with Catherine the Great's recruitment of 30,000 German colonists for Saratov in the 1760s.
POPULATION OF SARATOV PROVINCE

Notes:
1. European Russia within the constant frontiers of 1719. 2. Inhabitants per square kilometer.
Sources:
Zalezskii, Sel'sko-khoziaistvennaia statistica, p. 68; Kabuzan, Narodonaselenie, pp. 5, 59, 71, 107, 143, 155; Russia, Ministerstvo vnutrennikh del, Tsentral'nyi statisticheskii komitet, Statisticheskii otdel, Statisticheskie tablitsy, pp. 39–40; Russia, Ministerstvo vnutrennikh del, Tsentral'nyi statisticheskii komitet, Obschii svod, p. 2.
But the vast majority of immigrants were ordinary peasants from central Russia. Seigniorial peasants were resettled by their noble owners who received land grants in the province or purchased land from the state. State and crown peasants moved in response to incentives such as grants, loans, and temporary exemptions from taxation or conscription. Official policy was to facilitate the resettlement of those households suffering most from land scarcity and poverty, and there is evidence that postemancipation migrants also self-selected from the poorer strata of peasant society.Footnote 15
Because the data under study are for Saratov residents, rather than natives, it would be useful to know the share of immigrants in the population of young men eligible for conscription. Comparing rates of population growth with those of European Russia as a whole (Table 1), and assuming similar rates of natural increase, we can infer immi-gration's contribution to population increase in Saratov. From the mid-eighteenth to the mid-nineteenth century, immigration contributed about as much as natural increase. After this date, by which time the frontier had moved further east and south, its net contribution was apparently zero. Many immigrants were offered incentives such as exemptions from conscription, while others would simply have been too old at the time of resettlement. Still, up until the mid-nineteenth century, a non-trivial number of conscription-aged men in Saratov must have been born and spent part of their growing years in the more densely populated provinces of central Russia.Footnote 16
Peasant immigrants recreated the institutions and used the techniques of central Russia: village communes, repartitional land tenure, and the three-field system with scattered strips.Footnote 17 In this sense, peasant life in Saratov was typical of Russia more broadly, despite an initially superior per capita resource endowment. Saratov was also typical in the composition of its peasantry; by the 1760s the proportions of state, crown, and church peasants were similar to those elsewhere in Russia.Footnote 18 The province's rural character was also typical. In the 1850s the urban share of the population was in the same range as for European Russia as a whole, between 9 and 10 percent; in 1897 the shares were an identical 12.9 percent.Footnote 19
More information on Saratov's pattern of development can be gleaned from Koval'chenko and Leonid Borodkin's taxonomy of provinces circa 1900, which is based on a formidable array of variables including land tenure, crop production, real wages, migration, and literacy. Using cluster analysis, the authors group European Russia's 50 provinces into distinct groups, including the Baltic, steppe, central non-black-earth industrial, and central black-earth agricultural provinces. Saratov falls into the last of these, in which agricultural real wages and harvests of grain and potatoes along with cattle holdings per head of the rural population were above the Russian average, while the literacy rate and off-farm earnings per peasant were below. Insofar as one can generalize about a country as large and diverse as Russia, Saratov can be considered a typical agricultural province.
RUSSIAN ARMY CONSCRIPTS AND THEIR HEIGHTS
Muster lists of new recruits from Saratov province are preserved in the Saratov Oblast State Archive, the Russian State Archive of the Navy, and the archive of the Museum of the Artillery, Engineering, and Signal Corps.Footnote 20 These rolls contain over 19,000 individual records, with information on age, birth year, year of conscription, marital status, literacy, social estate (soslovie), religion, province and district of residence, rural or urban residence, and of course, height. Heights were recorded in the Russian units vershok (4.445 cm) and arshin (16 vershki), with measurement to the nearest eighth of a vershok. These individual data cover soldiers born from 1755 to 1877. To bring the record up to the end of the nineteenth century, they have been supplemented with tabulated or aggregate data on Saratov conscripts enlisted 1874–1913 (born 1853–1892) from the Russian State Historical Archive in St. Petersburg. The aggregate data are annual, and give the distribution of statures for each year's entire class of recruits across 11 height intervals.
The Russian army was a conscript army. Prior to a reform of 1874, two of feudal Russia's five social estates were liable for conscription: the peasantry, which made up 85–90 percent of the population, and the lower stratum of townspeople (meschanstvo), comprising a further 5–9 percent. The nobility served as officers on a voluntary basis, while the clergy were not obliged to serve, and the few members of the urban merchant guilds had the right to purchase exemptions. The Saratov sample is approximately 95 percent peasants, 5 percent townsfolk.
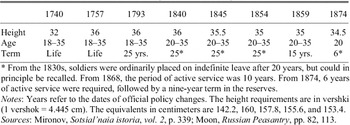
The long term of service—25 years or more until 1859—meant that the army did not have to resort to large annual flows of new conscripts to maintain troop strength. Conscription was irregular, dominated by episodic levies in response to military exigencies. Men from 18 or 20 up to 35 years of age were liable for conscription in this period (Table 2). Subject to the approval of the recruiting office, individuals were chosen for conscription at the local level, by the village commune. Among serfs belonging to the state or the crown, this process was first by rotation among households, later by lottery. Among manorial serf communities more discretion was exercised by village elders and sometimes by estate owners or their agents. Both had an interest in maintaining the viability of households as production units (hence only sons and sole breadwinners were often exempt) and in getting rid of troublemakers. In some cases, communal officials sought to discriminate against poor households deemed likely to default on their share of collective taxes and dues, though they appear to have been opposed in this by estate owners.Footnote 21 Well-off peasant households were often able to purchase exemptions or substitutes, or influence the outcome of medical examinations by paying bribes. For these reasons, it is likely that the most prosperous peasants are under-represented in the conscript sample.
REGULATION MINIMUM HEIGHTS, ELIGIBLE AGES, AND TERM OF SERVICE

* From the 1830s, soldiers were ordinarily placed on indefinite leave after 20 years, but could in principle be recalled. From 1868, the period of active service was 10 years. From 1874, 6 years of active service were required, followed by a nine-year term in the reserves.
Notes:
Years refer to the dates of official policy changes. The height requirements are in vershki (1 vershok = 4.445 cm). The equivalents in centimeters are 142.2, 160, 157.8, 155.6, and 153.4.
Sources:
Mironov, Sotsial'naia istoria, vol. 2, p. 339; Moon, Russian Peasantry, pp. 82, 113.
In 1874 a modern system of mass conscription by lottery was introduced, with universal liability for military service. Men could be drafted in the calendar year following their twentieth birthday. Because the draft was typically conducted in the fall, after the harvest, the modal age at the time of measurement and enlistment was 21. A system of deferments allowed some individuals called to arms to be enlisted at a later date (and older age). The age composition of the aggregate data is unknown, but among the 716 individual records available for the post-1874 recruitment period, 61 percent are aged 21 and 22 percent are aged 22.Footnote 22
As described previously, the army imposed a minimum height requirement (MHR). Because only the heights of recruits actually enlisted were reported, the Saratov sample is truncated from below. Making use of the fact that adult heights are well described by a Gaussian distribution, knowledge of the MHR allows us to model the sample data as being drawn from a truncated-normal distribution, the mean of which is a linear function of variables correlated with average net nutritional status. The variables available in the dataset are age, birth cohort, marital status, residence (urban or rural), literacy, and in some cases, social estate. The model parameters—the standard deviation of heights and the coefficients relating the explanatory variables to the mean—can be estimated by maximum likelihood.Footnote 23
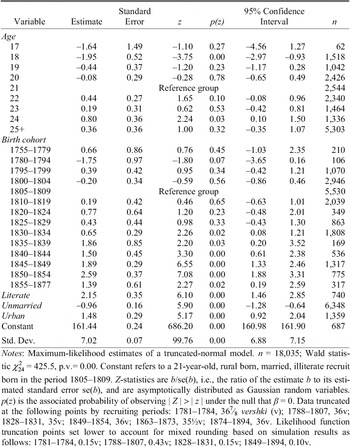
As indicated in Table 2, the MHR was changed three times during the period under study. In itself, this poses no problem for estimation, as the likelihood function can be modified appropriately for the relevant subsamples. More important is that a “clean” truncation point be identified. As is common in military records, clean truncation at the MHR is more the exception than the rule in the Saratov data because enforcement of the statutory minimum varied over time. Height measurements were also subject to rounding, with significant proportions of heights rounded to the quarter, half, or whole vershok (4.45 cm). In this circumstance, the likelihood function must be modified to reflect rounding, and the truncation point chosen must be a multiple of the dominant rounding unit.Footnote 24 The truncation points identified for each recruiting period are listed in the notes to Table 3.
DETERMINANTS OF MEAN HEIGHT (CM), SARATOV PROVINCE INDIVIDUAL DATA

Notes:
Maximum-likelihood estimates of a truncated-normal model. n = 18,035; Wald statistic χ224 = 425.5, p.v.= 0.00. Constant refers to a 21-year-old, rural born, married, illiterate recruit born in the period 1805–1809. Z-statistics are b/se(b), i.e., the ratio of the estimate b to its estimated standard error se(b), and are asymptotically distributed as Gaussian random variables. p(z) is the associated probability of observing |Z| > |z| under the null that β = 0. Data truncated at the following points by recruiting periods: 1781–1784, 36⅞ vershki(v); 1788–1807, 36v; 1828–1831, 35v; 1849–1854, 36v; 1863–1873, 35½v; 1874–1894, 36v. Likelihood function truncation points set lower to account for mixed rounding based on simulation results as follows: 1781–1784, 0.15v; 1788–1807, 0.43v; 1828–1831, 0.15v; 1849–1894, 0.10v.
Modeling of the aggregate data again proceeds from the truncated Gaussian density as a description of the distribution of individual heights. The probability of an individual height falling in any particular height interval (or “bin”) is calculated from the truncated-normal cumulative distribution function in a straightforward way. Next, the aggregation process must be modeled. The probability of drawing any particular sequence of individual heights falling into particular bins is simply the product of their individual, independent probabilities. The likelihood function for any set of bin frequency counts is then given by the multinomial distribution. In the absence of any data on covariates of height and with a clean and unchanging truncation point of 34.5 vershki throughout, the likelihood is simply maximized each year with respect to the mean and standard deviation of the underlying normal distribution of heights.
NEW ESTIMATES OF MEAN HEIGHTS
Table 3 presents maximum likelihood estimates of the determinants of mean height for the individual data. The regression constant refers to a 21-year-old, rural born, married, illiterate recruit born in the period 1805–1809. As all variables are dummies, the estimated coefficients should be interpreted as group differences from the reference category. The number of cases corresponding to each condition is given in the rightmost column. For ease of comparison with other studies, estimates have been converted to centimeters. The regression as a whole is highly statistically significant, as are the estimates for several of the age dummies, many of the birth cohort effects, and all three measures of socioeconomic status. The estimated standard deviation of 7.02 cm is close to the figure of 6.86 cm that has been suggested as a rule of thumb for adult males in modern populations.Footnote 25 The important features of the results in Table 3 are robust to changes in explanatory variables, estimation techniques, and sample periods.
Although our interest here centers on the level and time trend in average heights, the estimated effects of cross-sectional control variables offer insights into both average living conditions and social differentiation. Estimates of age effects indicate continued growth into the early 20s, which is typical of historical experience in conditions of relative deprivation, even if 2–3 cm is less than might have been expected.Footnote 26 The advantage of more than 2 cm estimated for literate soldiers (4 percent of the overall sample, but rising over time) is also typical, and consistent with access to education being limited to relatively privileged households. Also plausible is the 1 cm penalty for unmarried soldiers, in a world of early and near universal marriage. Early success for taller men in the village marriage market more likely reflects the economic status of their families than their stature per se.
The 1.5 cm height advantage of city dwellers matches expectations for prereform Saratov. Urban residents in the sample were overwhelmingly members of the meschanstvo, or townsfolk, social estate, who enjoyed relatively favorable treatment in terms of taxation and other feudal dues. Furthermore, urban places in Saratov province retained a semirural character even in the mid-nineteenth century, were well-provisioned with fresh food, and did not suffer a chronic public health disadvantage relative to the countryside.Footnote 27 Controls for social estate could not be included in the basic regression specification due to changing definitions and a lack of data for some periods. For a subsample born around 1800, however, estimates indicate a statistically significant height advantage for most social groups relative to seigniorial peasants. For peasants of the state and crown, as well as for townsfolk, the advantage was roughly 2 cm.Footnote 28 Other groups known to have benefited from favorable tax treatment or exemption from burdens, such as descendants of military settlers, freed peasants, and various officially sponsored settlers, all enjoyed similar height advantages.
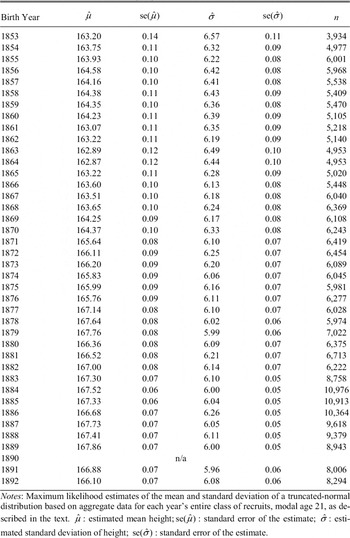
Table 4 presents maximum likelihood estimates of the mean and standard deviation of the height of 21-year-old recruits based on the aggregate data, which cover birth years 1853–1892. Estimates have again been converted to centimeters and are accompanied by information on sample sizes. For the 1850–1854 birth cohort, the only overlapping period with an adequate sample size in the individual data, the two sets of estimates are close at 164.0 and 163.5 cm, respectively. Careful examination of the aggregate-data estimates reveals disconcerting jumps of just over 1 cm in several years (1861, 1871, 1877, 1880, and 1887). These shifts, which alternate in sign, can be ascribed to alternations in rounding procedures used to compile the data.Footnote 29
ESTIMATED MEAN HEIGHT (CM), SARATOV PROVINCE AGGREGATE DATA

Notes:
Maximum likelihood estimates of the mean and standard deviation of a truncated-normal distribution based on aggregate data for each year's entire class of recruits, modal age 21, as described in the text. μ: estimated mean height; se(μ): standard error of the estimate; σ: estimated standard deviation of height; se(σ): standard error of the estimate.
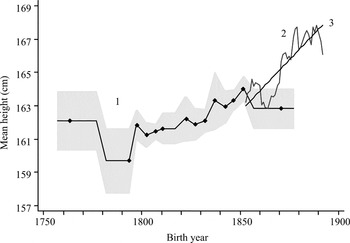
Both the individual- and aggregate-data estimates of mean height are plotted in Figure 2. Birth years are indicated on the horizontal axis, with markers placed at the sample mean birth year for each cohort (for example, 1763.5 for the 1755–1779 cohorts). The individual-data series is plotted within a two-standard-error band indicating the degree of uncertainty jointly associated with estimates of the constant and the cohort effects. This visually reinforces the message of the standard errors in Table 3; the overall upward trend in the first half of the nineteenth century is statistically significant, but most short-run fluctuations are not. Much the same can be said of the aggregate data. Though enormous samples make for standard errors too small to be conveniently plotted, short-run movements in the series are dominated by spurious, rounding-induced jumps. An attempt has been made to mitigate their visual impact by adding to the chart a simple linear time trend.
ESTIMATED MEAN HEIGHT OF 21-YEAR-OLD MALES, SARATOV PROVINCE

The new individual-data estimates plotted in Figure 2 do a remarkable job of filling in the gap in the existing record of military height data. Rising from roughly 160 cm in the 1790s to 164 cm in the 1850s, they neatly link Series A and B graphed in Figure 1. The apparently higher level and larger decline of the all-Russian series (A) in the 1700s are, at least in part, an artifact of the methods used in its construction, as discussed in the introduction; minimum height requirements bias sample means upward, while variation in their enforcement distorts the trend. In principle the same problem affects the late-nineteenth-century all-Russian data (Figure 1, Series B), but the bias is much smaller in this period due to a lower MHR and higher mean.Footnote 30 The near perfect overlap of the new and previously available estimates therefore tells us that mean heights in Saratov followed the same trend as in the rest of Russia in this period, and were at about the same level, or perhaps slightly lower. The Moscow and rural central Russian mean height estimates (Figure 1, Series C and D) now appear anomalous in both level and trend across the middle decades of the nineteenth century.
The “big picture” is then one of falling heights in the late eighteenth century, recovery in the early nineteenth century, followed by initially slow, but gradually accelerating growth into the 1880s, and a possible slowdown in the years leading up to 1892. In its broad outline, this picture is not unlike that of a number of other European countries. France, Austria-Hungary, and Italy, among others, all saw mean heights fall in the late eighteenth century followed by a turnaround sometime in the first half of the nineteenth century.Footnote 31 Saratov is somewhat unusual in the quickness of its recovery, the low level of mean heights even after this recovery, and the strength of growth in the middle and later decades of the century.
Mean height for the large (n > 5,000) reference cohort born 1805–1809 is 161.4 cm, which is quite low in international comparison. Estimates of average stature for 21-year-old recruits in the late eighteenth and early nineteenth centuries range widely, from highs in excess of 166 cm (in the 1780s, for countries including Sweden, England, and Bavaria) to lows between 161 and 162 cm (for Galicia and Lower Austria in the 1830s).Footnote 32 Differences in underlying data sources and methods of estimation make international comparisons perilous, and even ordinal rankings must be taken with a grain of salt. But the new estimate for Saratov is clearly at the low end of the spectrum.
As impressive as the low level of heights in the first decade of the nineteenth century is their subsequent growth. The cumulative increase from the 1810s to the 1890s amounted to at least five centimeters, bringing Saratov into the middle of the European pack in terms of height. Mean heights in the range of 166–167 cm for conscripts born in the 1880s and 1890s fall short of the figures for Scandinavia in the same years, but are similar to heights in France, Belgium, Bavaria, or Switzerland, and exceed those of Italy, Spain, or Portugal.Footnote 33 It seems appropriate to speak of a convergence in Saratov's living conditions towards Western European levels.
EXPLAINING SARATOV HEIGHTS
The factors influencing Saratov heights include the environment and natural resources, the degree of exploitation, agricultural productivity, and the development of the nonpeasant and nonagricultural economy. This section evaluates the (scant) available evidence to assess which factors can contribute to an explanation of the trend in heights. Beginning with the natural environment, it is important to note that exogenous changes in the disease environment can be ruled out, at least in explaining the improvement in heights during the nineteenth century. In neighboring Tambov province, mortality showed little or no improvement from 1830 to 1912. Three sources of mortality dominated there: chronically high (and rising) gastrointestinal disease among infants; regular outbreaks of infectious disease among older children; and occasional epidemics of cholera and smallpox. None of the three showed any decrease in the nineteenth century. A reliable overall mortality rate for Saratov is available only for the last decades of the century, when its level is quite high in international comparison. Its fall from 42 to 34 per thousand is surely evidence of improving peasant health, but this cannot easily be related to exogenous improvements in the disease environment or to public health measures.Footnote 34
Nor is it possible to invoke Malthusian population pressure to explain the trend in heights in Saratov. As heights fell in the late eighteenth century, the province remained almost empty by Western European standards, with a population density below even the already low Russian average (Table 1). Strongly rising heights in the late nineteenth century coincide with much higher densities and decreasing peasant land allotments per capita.Footnote 35 Population pressure outside Saratov province may have played a role, however, due to the presence of large numbers of immigrants from the poorer households of Russia's most densely populated central provinces. This may partially explain the low level of mean heights in Saratov, particularly if intergenerational transmission of health status built inertia into the adjustment to local living conditions. A decreasing share of first and second generation immigrants could help explain a rising trend in the mid-nineteenth century.
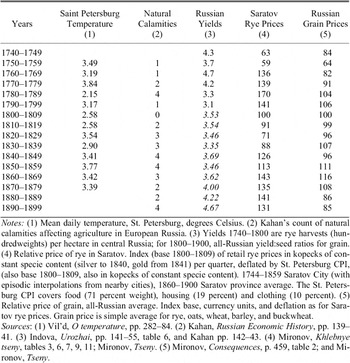
Finally, variations in the climate may have influenced harvests, though the relationship is difficult to identify empirically because of the unreliability of harvest data and the near absence of meteorological data. Despite these limitations, the 1780s can be identified as a period of low temperatures and unstable weather, poor yields, and high relative prices for grain (Table 5).Footnote 36 Low temperatures could also have affected heights by raising metabolic requirements and, in the Russian context, increasing disease exposure through the confinement of people and livestock indoors for a greater part of the year.Footnote 37 Climate may also have played a role in the apparent stagnation of heights in the early 1890s. Saratov and the rest of the mid-lower Volga region were hit by a series of droughts that led ultimately to a serious famine and, whether through malnutrition or social upheaval, a cholera epidemic.Footnote 38 But apart from these two episodes, it is difficult to assign a leading role to climate, particularly in explaining the steady improvement in heights across the central decades of the nineteenth century.
CLIMATE, GRAIN YIELDS, AND PRICES

Notes:
(1) Mean daily temperature, St. Petersburg, degrees Celsius. (2) Kahan's count of natural calamities affecting agriculture in European Russia. (3) Yields 1740–1800 are rye harvests (hundredweights) per hectare in central Russia; for 1800–1900, all-Russian yield:seed ratios for grain. (4) Relative price of rye in Saratov. Index (base 1800–1809) of retail rye prices in kopecks of constant specie content (silver to 1840, gold from 1841) per quarter, deflated by St. Petersburg CPI, (also base 1800–1809, also in kopecks of constant specie content). 1744–1859 Saratov City (with episodic interpolations from nearby cities), 1860–1900 Saratov province average. The St. Petersburg CPI covers food (71 percent weight), housing (19 percent) and clothing (10 percent). (5) Relative price of grain, all-Russian average. Index base, currency units, and deflation as for Saratov rye prices. Grain price is simple average for rye, oats, wheat, barley, and buckwheat.
Sources:
(1) Vil'd, O temperature, pp. 282–84. (2) Kahan, Russian Economic History, pp. 139–41. (3) Indova, Urozhai, pp. 141–55, table 6, and Kahan pp. 142–43. (4) Mironov, Khlebnye tseny, tables 3, 6, 7, 9, 11; Mironov, Tseny. (5) Mironov, Consequences, p. 459, table 2; and Mironov, Tseny.
A factor that likely played a more important role was exploitation, by which we mean not only the imposition of feudal dues on Russian peasants through the institution of serfdom (primarily quitrent (obrok) and labor services (barschina)), but also taxation and conscription. Russia's pursuit of imperial ambitions in the late eighteenth century resulted in a seemingly endless succession of wars against Prussia, Poland, Sweden, France, Persia, and the Ottoman Empire. A direct effect on the peasant economy was the subtraction of large numbers of able-bodied adult males from the labor force for a 25-year term of military service. An indirect and more important effect operated through the strain on government finances. In addition to foreign loans, indirect tax increases, and the issue of unbacked paper currency, the government raised direct taxes on all subjects and the quitrent owed by state and crown serfs.
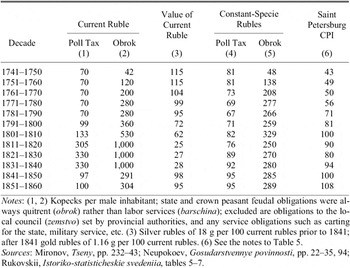
Increases in the poll tax barely compensated for the rapid depreciation of the paper ruble, and failed to keep pace with inflation measured in terms of constant-specie rubles (Table 6). Quitrents, by contrast, increased nearly sixfold in constant-specie rubles between the 1740s and the 1770s, far outpacing the 30 percent increase in (constant-specie) prices over the same period. It is not entirely coincidental that Russia's greatest peasant insurrection (Pugachev's rebellion, during which Saratov was occupied) occurred in this decade. Things did not go better for the serfs of private landowners. Quitrents for seigniorial peasants are estimated to have tripled in constant-specie terms between the 1750s and the 1790s. Average labor service requirements doubled from 0.75 to 1.50 desiatinas of land to be worked between the 1760s and 1790s.Footnote 39 In the absence of reliable data on output, it is difficult to express the burden of taxes and feudal dues as a share of peasant income. There is no doubt that it was heavy, however, with plausible guesses not less than 20 percent.Footnote 40
POLL TAX AND QUITRENT (OBROK) OWED BY SARATOV STATE AND CROWN PEASANTS, 1740–1860

Notes:
(1, 2) Kopecks per male inhabitant; state and crown peasant feudal obligations were always quitrent (obrok) rather than labor services (barschina); excluded are obligations to the local council (zemstvo) set by provincial authorities, and any service obligations such as carting for the state, military service, etc. (3) Silver rubles of 18 g per 100 current rubles prior to 1841; after 1841 gold rubles of 1.16 g per 100 current rubles. (6) See the notes to Table 5.
Sources:
Mironov, Tseny, pp. 232–43; Neupokoev, Gosudarstvennye povinnosti, pp. 22–35, 94; Rukovskii, Istoriko-statisticheskie svedeniia, tables 5–7.
In conjunction with climate-induced declines in yields, this intensification of exploitation was especially burdensome in the late eighteenth century. Yet, like climate, exploitation is not capable of explaining the recovery and early growth of heights in the nineteenth century. The government did reform the administration regulating the lives of state and crown peasants under Pavel Kiselev, and decreed a series of laws aimed at protecting the rights and increasing the freedom of seigniorial peasants beginning around 1800, but the burden of obrok remained. Though falling in real terms from its 1760–1790 peak, it never returned to anything like its previous low levels. And for seigniorial peasants in Saratov, quitrent was considerably higher, according to contemporary estimates for 1849.Footnote 41
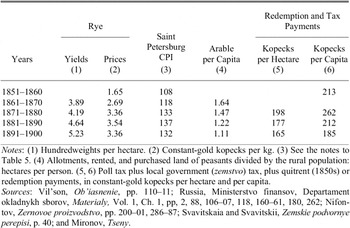
In the wake of the Emancipation, the burden of quitrent or labor service became the burden of redemption payments. There is no evidence that this change disguised an increase in total payments in Saratov. An estimate of direct taxes and redemption payments per capita in the 1870s indicates no increase, once inflation is taken into account, relative to direct taxes and obrok in the 1850s (Table 7).Footnote 42 Neither was there any decrease over these two decades, however. Though the estimates in Table 7 do fall in the 1880s and 1890s, this is, at least in part, due to a shift from direct to indirect taxation in the 1880s as the poll tax was eliminated and taxes on consumption goods (especially tobacco and sugar) were raised. Like climate, exploitation is convincing as a contributing factor in late-eighteenth-century declines in peasant living standards, less so in their accelerating improvement over the nineteenth century.
PEASANT AGRICULTURE IN SARATOV PROVINCE, 1850–1900

Notes:
(1) Hundredweights per hectare. (2) Constant-gold kopecks per kg. (3) See the notes to Table 5. (4) Allotments, rented, and purchased land of peasants divided by the rural population: hectares per person. (5, 6) Poll tax plus local government (zemstvo) tax, plus quitrent (1850s) or redemption payments, in constant-gold kopecks per hectare and per capita.
Sources:
Vil'son, Ob'iasnenie, pp. 110–11; Russia, Ministerstvo finansov, Departament okladnykh sborov, Materialy, Vol. 1, Ch. 1, pp, 2, 88, 106–07, 118, 160–61, 180, 262; Nifontov, Zernovoe proizvodstvo, pp. 200–01, 286–87; Svavitskaia and Svavitskii, Zemskie podvornye perepisi, p. 40; and Mironov, Tseny.
Productivity growth in agriculture can influence height though its effect on the relative price and per capita availability of food. Direct evidence is hard to come by, for the statistics on agricultural production and yields are the least reliable of all available data. Uncertainty continues about the most basic facts. Hoch has asserted, for example, that the consensus that Russian yields were lower than anywhere else in Europe “is quite simply incorrect.”Footnote 43 Such evidence as we do have suggests that Saratov had become a consistent grain exporter by the turn of the nineteenth century. Rye prices in the province were not more than two-thirds Moscow levels, and even lower relative to St. Petersburg. Though land-abundant relative to central Russia, the province does not appear to have been unusual in the yields it achieved or the share of output marketed.Footnote 44
Over the following decades, Nikolai Rubinshtein's estimates indicate that net harvests of grains and potatoes per capita did rise, but at a glacially slow pace, from 652 to 692 kg between 1787–1794 and 1857–1863, or less than 1 percent per decade.Footnote 45 Slowly growing or even stagnant productivity is broadly consistent with available data on yields.Footnote 46 It also fits the extensive form of growth still feasible in Saratov at mid-century; a military statistical survey of 1852 lamented that because of labor scarcity, new land was constantly being brought under the plow without sufficient attention to working and improving the soil.Footnote 47 The province remained a grain exporter at mid-century, with annual marketable surpluses over local consumption and distillation requirements estimated at over 500,000 tons.Footnote 48
It is only in the postemancipation period that Saratov agriculture experienced significant and sustained productivity growth. Table 7 presents data for peasant farming, in which rye yields per hectare rose by almost 35 percent between the 1860s and the 1890s. The historical literature does not cite major innovations such as enclosure, the application of chemical fertilizers, or the use of mechanical equipment. (These came later, in the 1890s and 1900s). Instead, improvements took the form of incremental changes in response to changing opportunities. As land became relatively scarce (Table 7), labor inputs per hectare were increased and the long fallow system was abandoned for two- and three-crop rotations. When information on new crops (for example, potatoes) diffused, their cultivation was taken up, and as national and international markets became integrated, specialization along the lines of comparative advantage (in Saratov's case out of rye and into wheat) followed. As knowledge of the province's variable conditions accumulated, peasants selected appropriate crop varieties (for example, hard wheats on the right bank of the Volga, soft on the left) and cultivation techniques (for example, shallow plowing to conserve moisture).Footnote 49
Increasing yields per hectare are neither necessary nor sufficient for increased food availability per capita. The official data, if they are to be believed, indicate that yields did not grow rapidly enough to offset population growth, which drove down hectares of arable per head of the peasant population (Table 7). Productivity growth may well have been greater on large commercially oriented estates; certainly most observers considered the level of productivity to be higher there. Still, some decline in grain supplies per capita might have taken place if not for a reduction in exports. Exports can be estimated from data on water-borne traffic, because a direct rail connection to Moscow and central Russia was not constructed before 1871, and shipping grain by rail remained prohibitively expensive even afterwards.Footnote 50 Grain shipments by water decreased fully 37 percent between 1859–1862 and 1875. They subsequently recovered, but only partially. 1884 shipments remained 16 percent below those of 25 years earlier.Footnote 51
How then did peasant families improve living conditions to a degree consistent with the observed increases in mean height? How did they command the purchasing power to retain more grain in the province? By abandoning traditional isolation and self-sufficiency and turning to market opportunities outside the household. Increased mobility in the aftermath of emancipation allowed peasants to boost household income through employment, not only as wage laborers on the estates of large landowners near and far (where productivity growth may have been significant), but also in the growing transportation, construction, and industrial sectors. The annual issue of internal passports giving the right to leave the village in search of employment increased by a factor of ten (from 15 to 150 thousand) between the 1860s and the 1890s. Annual earnings of agricultural laborers rose from 55 to 62 rubles in the two decades from the 1870s to the 1890s (while the price level was stable). Towards 1901 some 27 percent of Saratov's peasantry had been drawn into nonagricultural pursuits, deriving additional income estimated at nine rubles per capita.Footnote 52 Among prosperous peasants, the accumulation of savings became a real possibility. In the years 1881–1884, workers and peasants in Saratov province opened 500 new savings accounts per year at the state savings banks, a rate that rose to over 7,000 per year in 1898–1900. By 1900 they had 16,245 accounts worth 3.4 million rubles, or 212 rubles per savings book.Footnote 53 The development of the nonpeasant and nonagricultural economy appears to have been the key to rising living standards in the postemancipation period.
CONCLUSION
The new estimates of mean height in Saratov fill in the early nineteenth-century gap in the record and put the anthropometric history of Russia on a firmer methodological footing. They offer support for previous research indicating that Russian heights were falling in the late eighteenth century, rising in the second half of the nineteenth century, and connect these episodes by means of a rapid recovery followed by sluggish growth across the middle decades of the nineteenth century. The new estimates indicate that Saratov heights were low by international standards in the early years of the nineteenth century, but had risen to average European levels by its end. This convergence in living conditions has not previously been noted.
The increase in heights over the nineteenth century appears to reflect economic development. An exogenous improvement in the disease environment can be ruled out, while climatic shocks, feudal dues and taxation, and population pressure on resources can only contribute to explaining developments at the beginning or end of the period under study. It is rather productivity growth in agriculture and the development of opportunities in other sectors of the economy that were the key to rising living standards in Saratov. According to the official data, there was little or no agricultural productivity growth before the 1860s, after which it accelerated only enough to partly offset increasing land scarcity, at least in peasant agriculture and through the 1890s. The new estimates of mean stature, which clearly indicate improvement in peasant living conditions throughout the period, offer a further reason for skepticism about official harvest figures.
Prominent in Soviet and older western historiography is the notion of a nineteenth-century agrarian crisis. This crisis preceded and motivated the abrogation of serfdom in some accounts, followed from it as capitalism developed and industrialization proceeded in others. The anthropometric record in Saratov province offers no evidence whatsoever of such a crisis. To the extent that Saratov can be considered representative of Russia more broadly, the new evidence on heights strengthens the case of scholars such as Gregory, Hoch, Simms, or Wheatcroft who have argued for a more positive assessment of the peasant economy in the nineteenth century.