One of the goals of sociolinguistics is understanding what Hymes (Reference Hymes, Pride and Holmes1972) termed communicative competence: the ability of speakers to not only produce well-formed structures in their language, but to know how and when to use them for communicative effect. Communicative competence is partially revealed through intergroup linguistic differences, which must be learned by speakers (e.g., Johnson, Reference Johnson2006). Interspeaker differences, however, are partly driven by differences in input: people tend to talk like the people to whom they talk (see Bloomfield's [Reference Bloomfield1933:476] “Principle of Density”), and the people to whom they talk likely share their social characteristics. This makes it difficult to tease apart the sociolinguistic knowledge of the speaker per se (e.g., Ann prefers variant X because that is how a member of group Y is supposed to speak) and the effect of sheer input (e.g., Ann prefers variant X because it occurs more often in the speech to which she is exposed).
A more reliable behavioral clue to sociolinguistic knowledge is intraspeaker, or stylistic variation. Stylistic variation may be analyzed as a response to factors such as task type (Labov, Reference Labov1972; Trudgill, Reference Trudgill1972), audience (Bell, Reference Bell1984; Rickford & McNair-Knox, Reference Rickford, McNair-Knox, Biber and Finegan1994), topic (Blom & Gumperz, Reference Blom, Gumperz, Gumperz and Hymes1972; Coupland, Reference Coupland1980), or physical setting (Hindle, Reference Hindle1979)—that is, an automatic shift into linguistic behavior associated with a particular context, possibly attributable to more general priming effects (as in Hay, Nolan, & Drager, Reference Hay, Nolan and Drager2006). “Third wave” variationists (Eckert, Reference Eckert2012), however, argued that speakers actively use linguistic variation to construct complex and fluid social identities (e.g., Eckert, Reference Eckert2000; Kiesling, Reference Kiesling1998; Lawson, Reference Lawson2011) and to achieve other social ends (Podesva, Reference Podesva2006). The development of communicative competence thus involves learning both the rules of grammatical well-formedness and the socioindexical links that characterize one's language.
To the extent that a person's patterns of style-shifting reflect both their social identity and the sociolinguistic input to which they are exposed, we would expect style-shifting behavior to continue evolving throughout the life span. Stable variables like (ing) show age-graded patterns, with nonstandard variant usage peaking in adolescence, then falling as teens enter higher education or adulthood (e.g., Wagner, Reference Wagner2012). In communities undergoing a change in progress, speakers who change over the life span will typically do so in the direction of the community change for both categorical variables (e.g., Sankoff & Blondeau, Reference Sankoff and Blondeau2007) and phonetic shifts (Harrington, Palenthorpe, & Watson, Reference Harrington, Palethorpe and Watson2000), unless the innovative variant becomes stigmatized (Buchstaller, Reference Buchstaller2015).
The fact of continued change over the adult life span suggests that the phonological system is more malleable than was traditionally thought. Demonstrating changes in the overall use of linguistic variables, however, is not sufficient to establish that a broader change in socioindexical knowledge has occurred. A speaker might acquire (or increase their use of) certain variants after being exposed to the relevant input, but an assessment of overall usage cannot tell us whether new form-meaning links have been made or whether the speaker is able to exploit these new meanings in interaction.
Mobile speakers can provide a crucial window onto the later development of sociolinguistic knowledge and the ability to use it: for speakers with the right residential history, we can more or less pinpoint when a person came to be exposed to community usage of a “new” variable or variant and then observe whether that person now uses that variant and whether they style-shift in a way that suggests they have also acquired locally relevant socioindexical links.
Place identity and stance
In addition to a change in linguistic input, people who move from one region to another potentially experience a complex and fluid place identity. Place may define the scope of sociolinguistic study, delimiting an island (Labov, Reference Labov1963), a neighborhood (Labov, Reference Labov1966), a city (Trudgill, Reference Trudgill1974), a state (Nagy, Reference Nagy2001), or some other region in which data are collected. Yet place is also a state of mind, imbued with social meaning: while physical location may be fixed, orientation to that place may not be (Eckert, Reference Eckert and Fought2004; Johnstone, Reference Johnstone and Fought2004), and different aspects of place identity become salient as talk unfolds (Myers, Reference Myers2006). Speakers in a particular place may come to associate specific linguistic variants with that place and use those variants to affirm their identity as authentic residents (Becker, Reference Becker2009; Johnstone & Kiesling, Reference Johnstone and Kiesling2008; Labov, Reference Labov1963; Schilling-Estes, Reference Schilling-Estes2004; Zhang, Reference Zhang2008). By observing how mobile speakers use both first dialect (D1) and new dialect (D2) features as they talk about their old and new regions, we can learn how speakers negotiate multiple place identities through linguistic means. To the extent that mobile speakers express varied sentiments regarding their D1 and D2 regions, we can also begin to disentangle the roles of input and socioindexical knowledge. If we see that a mobile speaker uses more D2 variants when expressing something positive about the D2 region and fewer when expressing a negative sentiment, this would be stronger evidence that the speaker has not only learned the D2 form but is using it to do social work.
A theoretical notion that captures the intuitive idea of sentiment is stance, which, as described by Kiesling (Reference Kiesling2011), “creates relationships of speaker to some discursive figure,” such as the speaker's interlocutor or some idea or person represented in talk. This paper uses two types of stance described in Kiesling, Onuffer, and Hardware (Reference Kiesling, Onuffer and Hardware2012) to understand phonetic patterns in mobile speaker data. Affective stance refers essentially to whether the discursive object is liked or disliked by the speaker. Alignment reflects distance from or closeness to the stance object. If speakers have linked certain linguistic variables to their home and/or adopted region per se, we might expect them to use those variables to convey these stances. D1 variants should be particularly common when expressing positive evaluations of or alignment with the D1 region, but suppressed to some extent when expressing negative affect or distance from this region. Similarly, D2 variants should be more common when speaking positively about or expressing solidarity with the D2 region and less common when expressing negativity about or distance from this region.
METHODS
Speakers and data collection
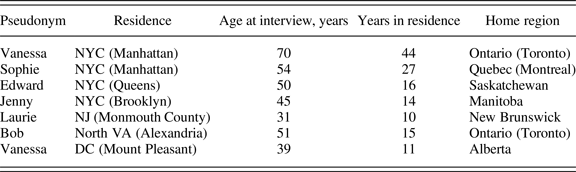
The analysis draws on conversational interviews with seven native speakers of Canadian English, born and raised in Canada, who moved to the United States after age 21 and had been living in their new location for at least 10 years before data collection (Table 1). Five speakers settled in the New York City (NYC) region and were interviewed in 2008 (see Nycz, Reference Nycz2011). The other two live in the DC region and were interviewed in 2016 by the author. Interview questions focused on experiences growing up in Canada, moving to the United States, adjusting to life in a new country, and impressions of the people, culture, and communication patterns of their native and adopted homes. All interviews were recorded to 44.1 kHz, 16-bit wav files using Audio-Technica lavalier mics and either an Edirol R-09 or Zoom H4N solid state recorder. Interviews took place in the interviewee's home, the author's office, or a quiet cafe.
Speakers represented in this analysis

Data extraction and linguistic coding
Each interview was transcribed in ELAN (2018) using the FAVE guidelines for transcription (Rosenfelder, Reference Rosenfelder2011). Transcript and wav files were submitted to FAVE-Align python scripts (Rosenfelder, Fruehwald, Evanini, & Yuan, Reference Rosenfelder, Fruehwald, Evanini and Yuan2011) to generate time-aligned, word- and phoneme-segmented Praat text grid files (Boersma & Weenink, Reference Boersma and Weenink2017). FAVE-Extract scripts were then used to extract Lobanov-normalized formant measurements (rescaled to hertz) from all stressed vowels longer than 50 msec. The FAVE-Extract output also included coding for a number of linguistic context variables, including details of preceding and following segment. Default configuration settings for FAVE-Extract were used, with maximum formant set automatically according to gender of the speaker. Vowel (i.e., word class) codes assigned by the CMU dictionary were hand-checked and corrected as needed.
Style coding
Topic and stance variation was hand-coded by the author using the text transcripts exported from ELAN. Interviews were divided into sections of talk lasting anywhere from 1 min to several minutes, with the beginning of each section reflecting a new topic or subtopic (typically signaled by phrasing such as “so anyway,” or “oh let me tell you about …”). For each section, a “point” to the talk was identified—that is, the main takeaway claim of that section. In nearly all cases, the point was equivalent to an actual utterance made by the speaker at the beginning or end of a section and corresponded to something like a summary and/or an evaluation of the situation, events, person, or concept just discussed or about to be discussed.
To avoid any influence of phonetic content, only information available in the text—content of utterances and the questions that prompted them—was used to code style variables; transcribed channel cues such as laughter were ignored. Moreover, only topics and stances made explicit by the speaker in a given section of talk were coded for that section. Each section of talk was coded for the following variables.
Stance
One stance was identified for each section/point. This variable took one of six values reflecting both the type of stance conveyed in a segment (alignment or affect) and the valence of that stance. Aligned was used for stances expressing solidarity or closeness with the nation or locality being discussed; sections with this code contained utterances conveying a speaker's feelings of fitting in, getting along with, or otherwise thinking of themselves as being a part of a given community. Nonaligned stances express distance—feelings of not belonging or not getting along with a community. Positive and negative stances express positive or negative evaluation of a place, respectively, without expression of alignment or nonalignment as identified. Ambivalent was used for points that contained both positive and negative elements. Where no explicit affective or alignment stance was expressed by a speaker, the neutral code was used; often these were purely information-giving responses to questions from the interviewer. Examples of section points and their corresponding stance coding are given in (1) to (6).
(1) Aligned
Back in Canada I had all these friends and stuff (Jenny, re: Canada)
I fit in so nicely here (Sophie, re: NYC)
(2) Nonaligned
Here nobody knew me (Jenny, re: NYC)
Nobody did anything with their lives; I just didn't fit in there (Sophie, re: Montreal)
(3) Positive
Forest Hill was a wonderful mélange of people (Vanessa, re: Toronto)
I was back in Canada a few times and loved it (Jenny, re: Canada)
(4) Negative
It all goes back to no one likes Americans, they're going to shoot me if I do something wrong (Laurie, re: the United States)
The worst place to be in April is Toronto (Bob, re: Toronto)
(5) Ambivalent
New York is more spread out than other cities, so while there's great stuff it can be hard to find (Edward, re: NYC)
(6) Neutral
My parents originally came from Poland (Sophie, no place topic)
Nation
This code reflects either the country explicitly discussed or the national context of the topic. For example, a participant's discussion of Canadian identity would be coded Canada, as would their description of experiences in elementary school, since it concerns events that took place in Canada; descriptions of how they view the United States, or, for example, their current job at time of interview, would be coded US.
Locality
Coded similarly to nation, though reflecting the province-, state-, or city-level context of the topic (e.g., Manitoba, Toronto, NYC). When speakers discussed America (or Americans) or Canada (or Canadians) in general, this variable was coded NA.
Variables
Upgliding diphthongs (aw) and (ay)
Perhaps the most salient feature of Canadian English is raising in the mouth lexical set, in which the nucleus of the diphthong in words like south and about is raised before voiceless consonants (Joos, Reference Joos1942). The shibboleth out and about, often performed with exceedingly high nuclei, is a common response when Americans or Canadians are asked to name a feature of Canadian English. Indeed, speakers across regions sampled in the Phonetics of Canadian English survey show significant mouth-raising, producing on average a 142 Hz difference between prevoiceless and elsewhere allophones (Boberg, Reference Boberg2008). Labov, Ash, and Boberg (Reference Labov, Ash and Boberg2006:205) set a lower bar, counting speakers with at least a 60 Hz difference between allophones as “Raisers.” By either metric, the NYC region does not exhibit raising in this word class (Labov et al., Reference Labov, Ash and Boberg2006), nor does the DC region.Footnote 1
Canadian raising also occurs in the price vowel, though price-raising is not salient as a Canadianism. Indeed, none of the seven interviewed for this study ever mentioned raising in price in their metalinguistic commentary, though all readily described raising in mouth. The lack of association with Canadian English is likely due to the more widespread presence of price-raising in North American English: it is also found in, for example, Detroit (Eckert, Reference Eckert2000) and Philadelphia (Labov, Reference Labov1994), though not, crucially, in NYC or DC.
mouth and price thus constitute a “minimal pair” that allows us to discern the effect of salience and place-linked meaning on both second dialect acquisition and the stylistic use of variation. For a Canadian English speaker to accommodate to NYC or DC realizations of either variable, the same sort of phonetic change is required: lowering of prevoiceless mouth and price. But raised mouth (henceforth, awT) is a stereotype of Canadian English, subject to conscious awareness and potential manipulation, while raised price (ayT) is merely an indicator—a variable that distinguishes groups of speakers for linguists and other researchers but does not serve any social function for users themselves (Labov, Reference Labov1994:78). As such, we expect these variables to pattern differently: only the place-linked variable (awT) should vary stylistically, particularly when speakers are talking about place and place identity. (ayT), a variable not explicitly linked to place, is not expected to show stylistic variation. This difference should also give rise to an apparent difference in overall accommodation toward the D2: exposure to lower US variants of prevoiceless mouth and price should result in lower variants of both allophones as compared to those produced by nonmobile Canadians, but this overall lowering may be attenuated in the case of mouth due to the continued presence of high, Canada-affirming variants.
Low back vowels (oh) and (o)
The structure of the low back vowel space also distinguishes Canadian English from the varieties spoken in and around NYC and DC. Canadian English is largely characterized by a three-way merger of the word classes represented by thought, cloth, and lot, with the single vowel in that space realized as somewhat higher than [ɑ], with a similar backness (Hagiwara, Reference Hagiwara2006). NYC-area and DC-area English distinguish thought/cloth (oh) from lot (o), with the symbols [ɔ] and [ɑ] typically used to represent the qualities of these two classes; the New Yorkers sampled in the Atlas of North American English show a robust distinction between (oh) and (o), with an average difference of 334 Hz in F1 and 460 Hz in F2 (Labov et al., Reference Labov, Ash and Boberg2006). In DC the distinction is also present, if less robust, as some younger speakers show evidence of the merger (Lee, Reference Lee2016). While unconditioned mergers and distinctions per se are typically below the level of conscious awareness and not subject to evaluation (Labov, Reference Labov1994), speakers may notice and assign meaning to individual vowels implicated in the contrast; this is certainly the case for (oh), whose raised variants are associated with NYC and accordingly stigmatized (Labov, Reference Labov1966). The quality of (o), meanwhile, is typically not remarked upon vis-à-vis this region. In DC neither vowel is the object of speaker commentary (Lee, Reference Lee2016).
Because of this, (oh) and (o) provide another analytical minimal pair: while both word classes are expected to show movement toward more US-like variants (with (oh) being higher compared to the productions of nonmobile Canadians, and (o) being lower and more front), we would only expect to see stylistic variation in (oh), the vowel to which social evaluation attaches. Moreover, such stylistic variation is only expected in NYC Canadians, with raised variants of (oh) correlating with positive discussion of NYC and NYC identity.
Statistical analysis
Linear mixed effects regression models of formant variation were built using the lme4 package in R (Bates, Maechler, Bolker, & Walker, Reference Bates, Maechler, Bolker and Walker2015). Two stages of analysis were carried out for each variable. First, models were fit to determine whether (and the extent to which) speakers distinguished relevant categories defined by allophone or word class.Footnote 2 For the diphthongs, the category factor divides prevoiceless tokens (awTs and ayTs) from those found elsewhere. For the low back vowels, category distinguishes tokens found in (oh) words from those in (o) words. A model containing fixed effects of token duration, preceding environment, and following environment, a random effect of word, and a random slope for category per speaker was compared to a more complex model containing these same terms plus a fixed effect of category using likelihood ratio tests. Three pieces of information emerge from this process: first, whether the two categories being compared are distinguished phonetically across speakers (indicated by the result of the likelihood ratio test); second, the average difference between these categories across all speakers (indicated by the coefficient of “category” in the more complex model), and third, the extent of variation between speakers with regard to this difference (indicated by the random slopes for category associated with each speaker). This stage of analysis thus reveals the extent to which speakers have resisted or adopted new dialect features overall.
Second, analyses were carried out to determine the extent to which variation in the realization of (awT), (ayT), (oh), and (o) is explained by both the places people talk about and how they talk about them. Again, increasingly complex nested models were compared to determine whether certain fixed effects of interest significantly improved models of formant variation. These fixed effects include place (e.g., whether the United States or Canada is being talked about) and stance. Given the research aims described earlier, we are particularly concerned with the interaction of place and stance as a fixed effect, but also in how this effect varies across speakers. Speaker was incorporated as a fixed effect, so that its interaction with place and stance could be examined (models containing random slopes for the interaction of place and stance per speaker did not converge, no doubt due to the small number of speakers).
Stressed vowels from all words in a given word class were included in the analyses reported herein. The effects of phonological context factors and duration must be controlled for in the estimation of word class differences and stylistic effects, but are not of primary interest in this analysis. As such, they will be ignored in the discussion of results.
RESULTS
Interspeaker variation in (awT)-raising
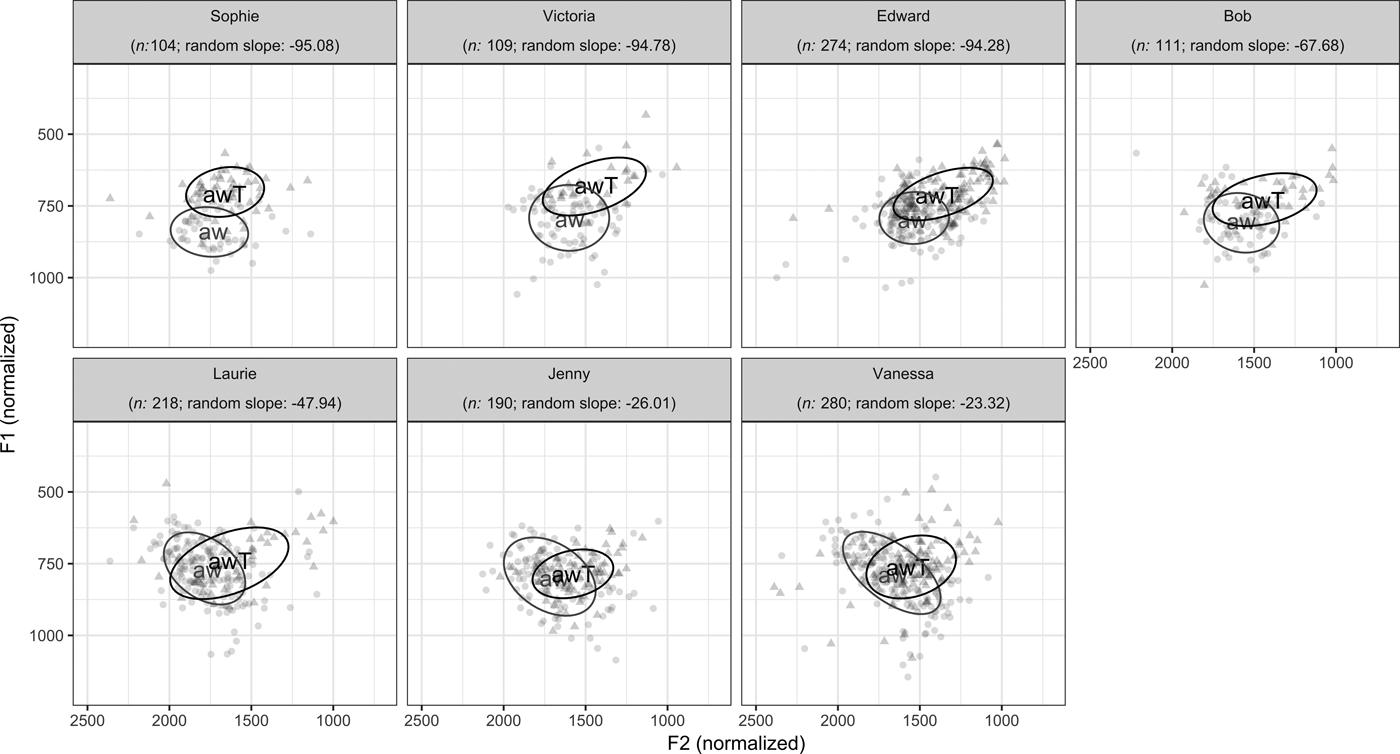
A total of 1286 tokens of the mouth vowel were analyzed, 517 occurring before voiceless obstruents (awT) and 769 in other contexts (aw); three outliers with F1 > 1200 were removed from the data before analysis. Speakers vary in the degree of apparent raising they exhibit in this vowel (Figure 1).
Prevoiceless (awT) and elsewhere (aw) tokens across speakers. In these and all following vowel plots, characters are plotted at the mean F1 and F2 value for each category, and confidence ellipses indicate 1 SD of the density contour estimated from the data.

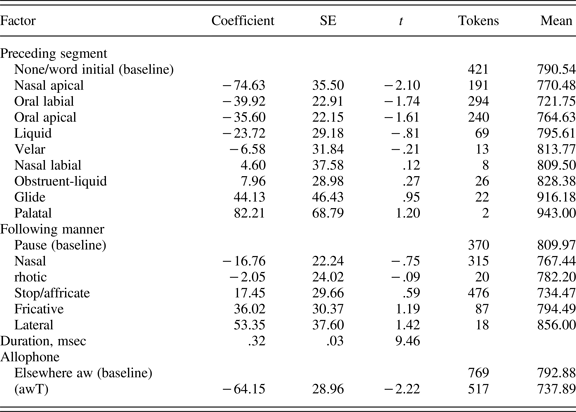
The likelihood ratio test indicates that allophonic category affects F1 (χ2(1) = 4.82, p = .03): the nucleus of (awT) is produced with an F1 about 64 Hz lower than elsewhere (aw)—that is, higher in the vowel space (Table 2). Comparing the random slopes for allophone across speakers, however, we see variation underlying the group tendency (Figure 1). All slopes are negative, indicating that (awT) is higher than elsewhere (aw) for all speakers. But while Sophie, Victoria, and Edward each show a difference of about 95 Hz, Bob has a more modest difference, closer to the 60 Hz raising cutoff of Labov et al. (Reference Labov, Ash and Boberg2006). Laurie's difference is just below this cutoff, while Jenny and Vanessa have less than a 30 Hz difference between allophones.Footnote 3
Mixed effects regression analysis of F1 of (aw)
n = 1286
Intercept = 783.73

(awT) height varies according to place-specific stance
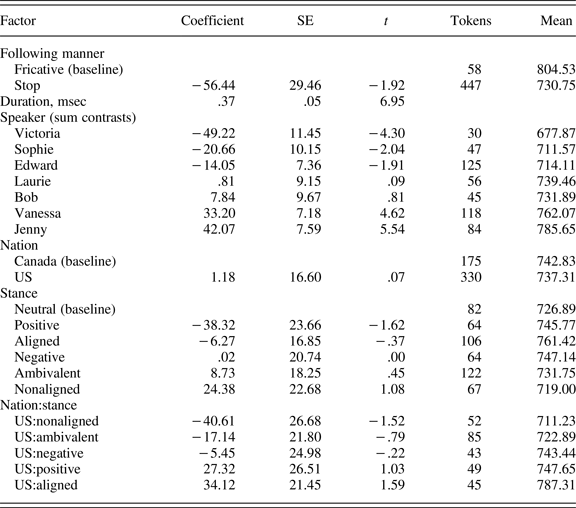
The analysis of stylistic variation was carried out on the subset of (awT) tokens. About 98% were given a nation code of Canada (n = 175) or United States (n = 330); tokens coded with other nations were removed from the data, leaving 505.A series of models were built taking F1 as the dependent variable, with the simplest model containing fixed effects of following manner,Footnote 4 duration, and a random effect of word. Adding speaker to the model significantly improved it (χ2(6) = 63.38, p < .001), reflecting previously observed interspeaker differences in the degree of (awT) raising. Neither nation nor stance improved the model when added as main effects (nor did a nation:speaker interaction). A model containing a nation:stance interaction, however, was significantly better than one containing only main effects (χ2(4) = 15.94, p = <.001). A three-way interaction between speaker, nation, and stance was not significant, suggesting that speakers pattern similarly.
The specific effects can be found among the coefficients in Table 3. Compared to neutral speech, speakers produce their lowest (most American English-like) (awT)s when expressing positive affect regarding or alignment with the United States, and their highest (least American English-like) (awT)s when expressing distance from or ambivalence about the United States. Negative US affect has a rather small effect, though the coefficient indicates slight favoring of higher variants. The coefficients for each stance combined with Canada are not given automatically in the model summary, but these are the same as those for the United States, with opposite signs—for example, when expressing nonalignment with Canada, speakers’ (awT)s are 40 Hz lower in the vowel space compared to those occurring when a neutral stance is being taken.
Mixed-effects regression analysis of (awT) F1 containing nation:stance interaction
n = 505
Intercept = 763.50

Less interspeaker variation in (ayT)-raising
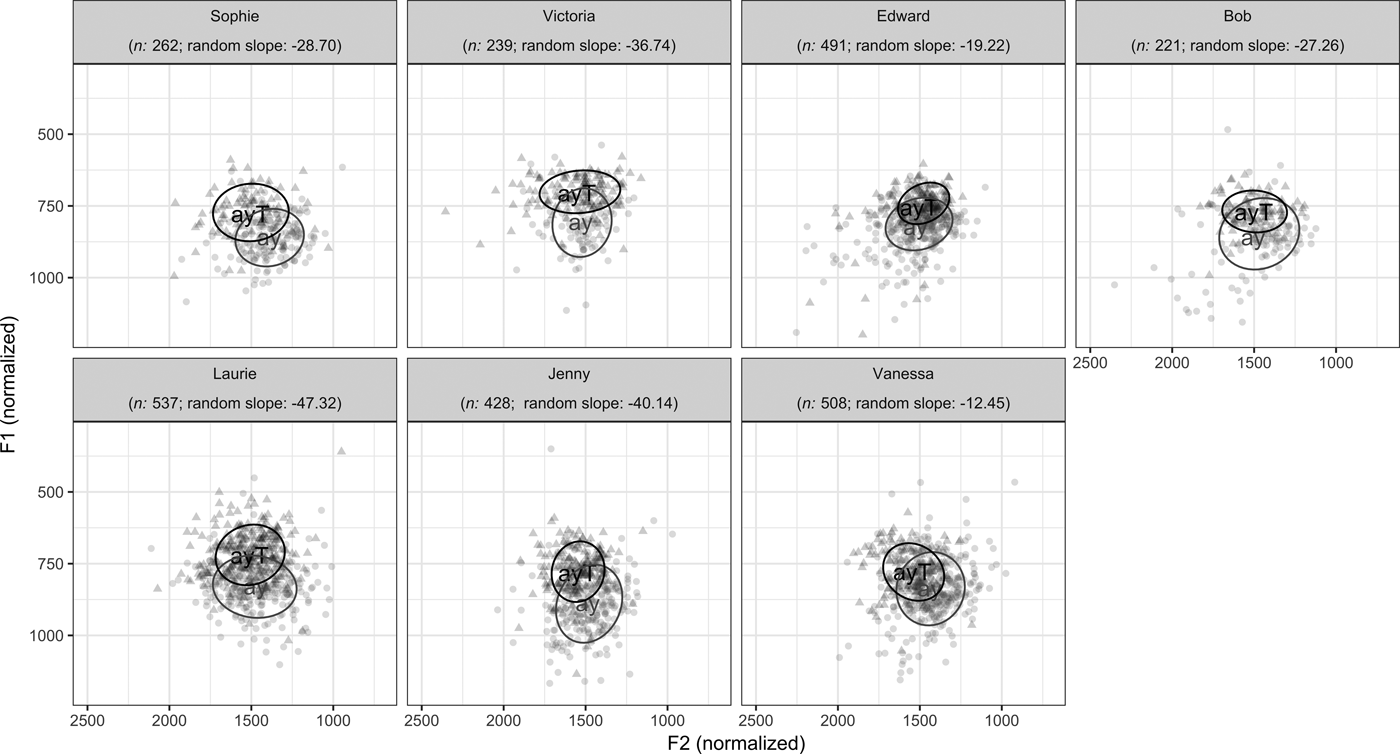
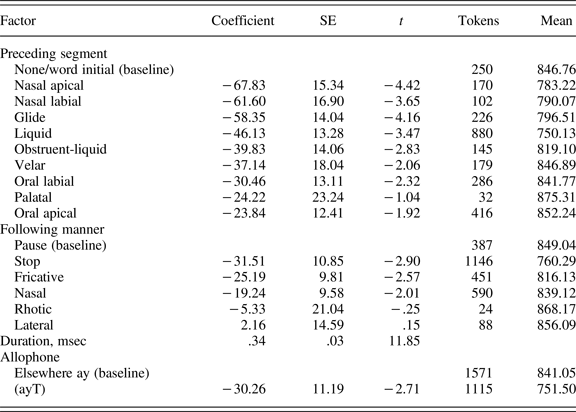
A total of 1115 tokens of price before voiceless obstruents (ayT) and 1571 tokens of elsewhere (ay) were analyzed. The plots in Figure 2 suggest less interspeaker variation in (ay)-raising than was seen for (aw): all speakers apparently produce (ayT) somewhat higher than elsewhere (ay), with a high degree of overlap. Allophonic category significantly affects F1 (χ2(1) = 6.95, p = .008), with (ayT)’s nuclear F1 about 30 Hz lower than elsewhere (ay) (Table 4). This effect is notably smaller than that observed for (awT) in the group analysis. Moreover, the allophone:speaker random slopes vary much less than those seen for (aw), with most speakers hewing fairly closely to the group coefficient and none reaching the 60 Hz threshold (Figure 2).
Prevoiceless (ayT) and elsewhere (ay) tokens across speakers.

Mixed effects regression analysis of F1 of (ay)
n = 2686
Intercept = 843.42

No (ayT) height variation according to place-specific stance
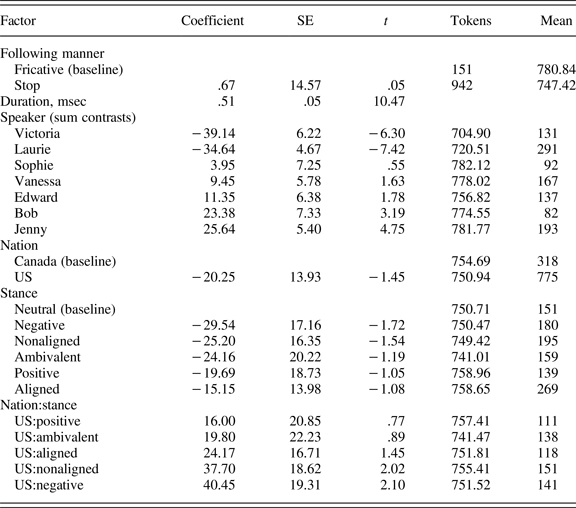
Ninety-eight percent of (ayT) tokens were nation-coded as Canada (318) or US (775); the remaining were excluded from stylistic analysis. As with (awT), adding speaker significantly improved the model of (ayT) F1 (χ2(6) = 116.60, p ≤ .001), reflecting differences in the degree of raising across speakers, and neither nation nor stance as main effects improved the model. Unlike (awT), however, the interaction of nation and stance was not found to be significant (χ2(5) = 6.20, p = .29) (Table 5).
Mixed-effects regression analysis of (ayT) F1 containing nation:stance interaction
n = 1093
Intercept = 736.65

Low back vowel differences across speakers
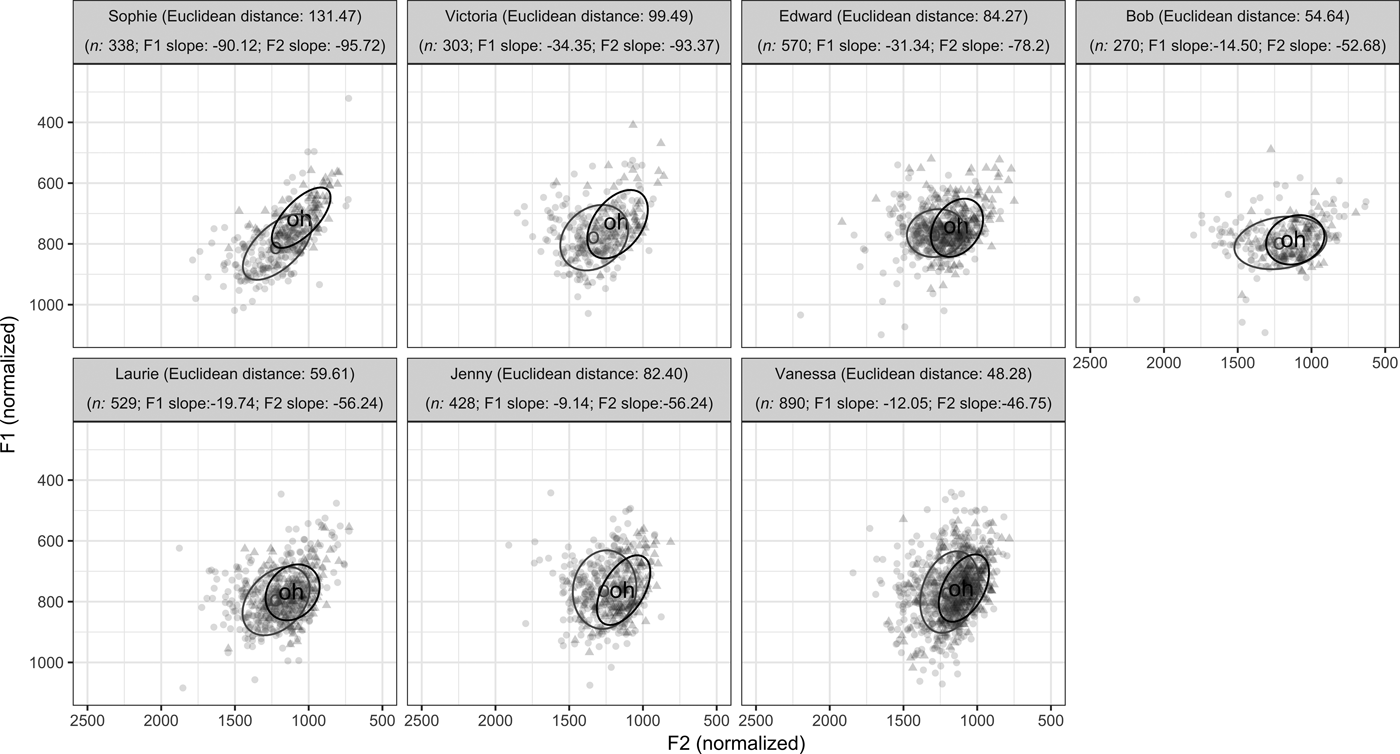
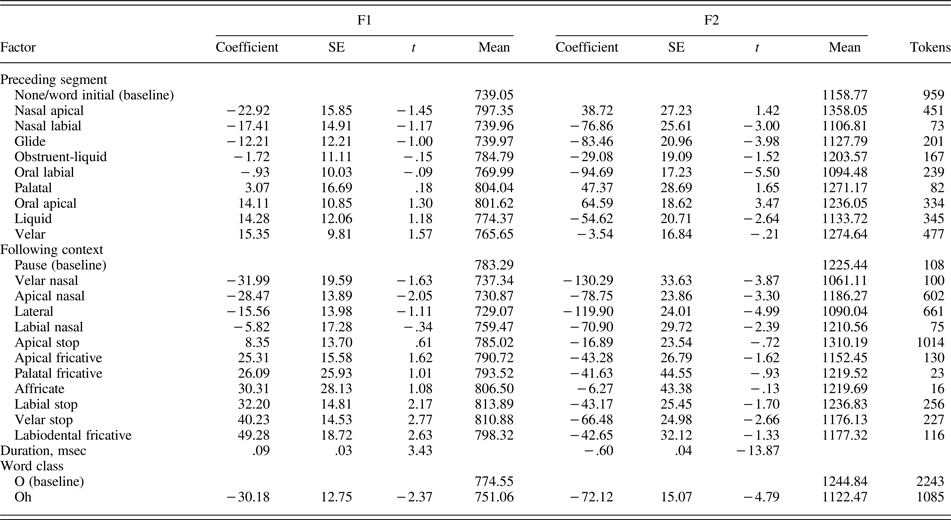
A total of 2243 tokens of (o) and 1085 tokens of (oh) were collected across speakers. The token plots (Figure 3) show a high degree of overlap between these word classes and little distance between mean values, with some interspeaker variation. The speakers as a group distinguish two low back vowel word classes along both F1 (χ2(1) = 4.5495, p = .03) and F2 (χ2(1) = 13.783, p = .0002). (oh) words are produced approximately 30 Hz higher and 72 Hz farther back in the vowel space than (o) words (Table 6),Footnote 5 resulting in an adjusted Euclidean distance (Nycz & Hall-Lew, Reference Nycz and Hall-Lew2014) of about 78 Hz between category means. There is interspeaker variation in the size of this distance (Figure 3), but in no case does the difference in either dimension come close to the regional norms of NYC or DC.
(oh) and (oh) tokens across speakers.

Mixed-effects regression analysis of F1 & F2 for (o)/(oh)
n = 3328
Intercept = 768.87 (F1); 1367.52 (F2)

Variation in (oh) height according to stance
(oh) tokens appearing in utterances about Canada (366) or the United States (649) were subject to stylistic analysis. An initial set of models was fit for each of F1 and F2, with fixed effects of speaker, nation, stance, and finally a nation:stance interaction incrementally added to the model. While speaker significantly improved models of both F1 and F2, no further additions did, suggesting that these speakers overall do not vary (oh) depending on which nation they are talking about, or how they are talking about it. This is not unexpected, for two reasons. First, the quality of (oh) is salient only in NYC, so we expect that while (some of) the NYC speakers may come to use this variable stylistically, the DC speakers will not. Second, if speakers of either city have come to associate raised (oh) with the dialect of their adopted city but not the rest of the United States (a reasonable assumption, given that nearly all of the speakers in this group have experience with other regional dialects of US English), then a city versus elsewhere comparison should be more explanatory.
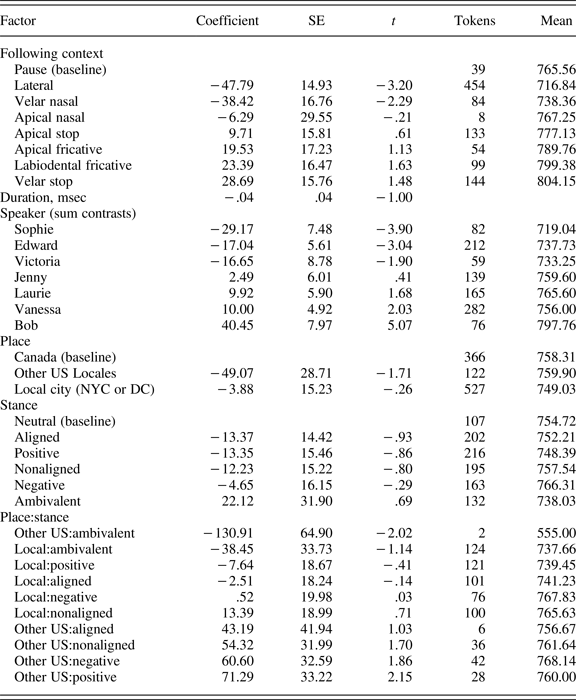
To explore this possibility, the data were reanalyzed with a three-level place factor replacing the binary nation: US tokens were divided into those occurring during talk about the local context (NYC and neighboring suburbs in the case of the NYC Canadians, and DC/Northern Virginia for the DC Canadians) and those referring to other US places or America(ns) in general. In this second analysis, both speaker (χ2(6) = 58.71, p < .001) and the place:stance interaction (χ2(10) = 18.82, p = .04) significantly improved the model of F1, with no main effects of place or stance. The interaction coefficients indicate a few trends (Table 7). First, ambivalent stances about the United States are associated with the highest vowels. For talk about one's city, stances indicating positive evaluation or alignment are associated with somewhat lower F1—and thus higher (oh)—compared to neutral stances, while nonalignment favors somewhat lower (oh). For other US talk, no clear pattern is discernible, though stances of any kind favor lower vowels compared to neutral stances. No factors beyond speaker significantly improved the model of F2, indicating no stylistic variation along this dimension.Footnote 6
Summary of (oh) F1 model containing place:stance interaction
n = 1015
Intercept = 789.27

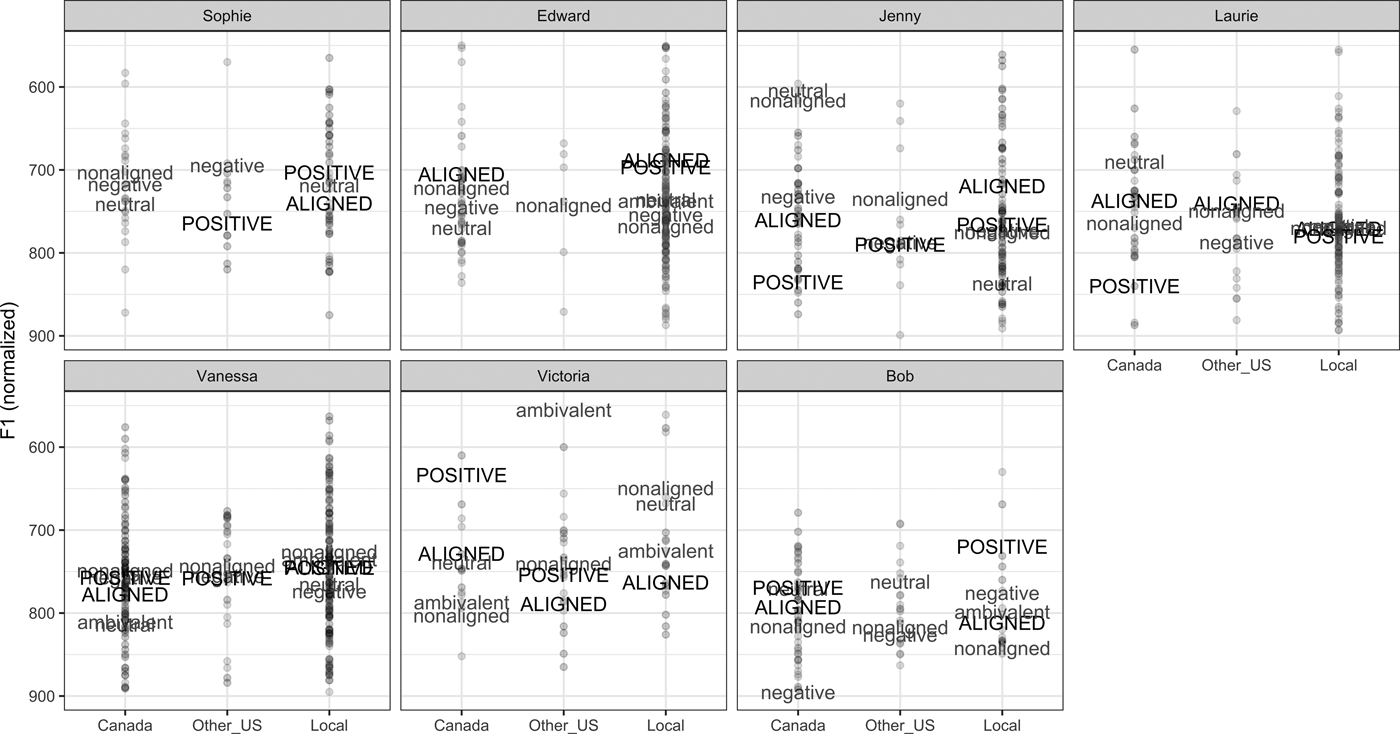
A three-way interaction among speaker, place, and stance further improved the model, indicating interspeaker variation in the ways that (oh) is used. Because of the difficulty in interpreting the coefficients associated with this factor, however, interspeaker variation will be explored graphically (Figure 4).
Stance and (oh) height variation according to place topic. Each stance label is plotted at its mean value for a given place and speaker. Local refers to DC talk for Victoria and Bob and NYC talk for everyone else.

Speakers vary in the types of stances they express about different places, leaving some gaps in the conclusions that can be drawn from the data. Sophie, for example, expresses no negative stances toward NYC, nor positive stances toward Canada. Her (oh) is similarly high in positive NYC talk and negative Canada talk, which is not inconsistent with expectations about stance-based shift in (oh); without data from opposing stances, however, we cannot decide between a stance-shift account and one in which Sophie maintains an essentially uniform (oh) height, regardless of talk content. However, the patterning of other US talk suggests that Sophie does use this variable to convey place-based stance: negative stances regarding other US places evoke higher (oh) while positive stances evoke lower, non-NYC (oh).
Edward expresses more varied stances in his talk about both NYC and Canada. His highest (oh)s appear in talk expressing positive or aligned stance regarding NYC, with negative and nonaligned NYC talk evoking lower (oh). In Canada talk, his (oh)s are also highest when expressing alignment, though these (oh)s are lower than those in talk expressing NYC alignment; moreover, the difference between aligned and nonaligned (and negative) stances in Canada talk is not as clear, suggesting that Edward does not connect this variable to Canadian identity in the same way. Edward says little about other US places, expressing only nonalignment in this talk; his average nonaligned (oh) is between that for nonaligned NYC and nonaligned Canada talk.
Jenny similarly patterns in ways that suggest she uses (oh) height to express alignment: in NYC talk, alignment elicits higher (oh) than nonalignment, with both Canada and other US talk showing the expected reverse pattern. Affective stance is not distinguished by (oh) height in any of Jenny's US talk; in Canada talk, however, negative evaluations elicit higher (oh) and positive evaluations have lower (oh).
Laurie, in contrast, does not seem to vary (oh) height based on stance in local talk at all. In other US and Canada talk, expression of alignment elicits somewhat higher (oh) than nonalignment, contrary to expectations. Her largest stance difference, however, occurs in Canada talk, where positive evaluations evoke lower (oh). Vanessa also shows no clear differences based on stance in US talk; in her Canada talk, neutral and ambivalent stances are associated with somewhat lower (oh).
Victoria's patterns are more puzzling: positive evaluation of Canada is associated with higher (oh), and the patterning of aligned versus nonaligned stances is unexpected in both DC and Canada talk, with alignment eliciting (oh)s that are most different from the relevant dialect norms. Bob's data is similarly hard to understand: his positive evaluations evoke higher (oh) than negative evaluations, and alignment evokes higher (oh) than nonalignment, regardless of whether he is talking about DC or Canada. This may indicate that Bob associates high (oh) with positive stance generally, but not in a way that interacts with place.
Variation in (o) height according to stance
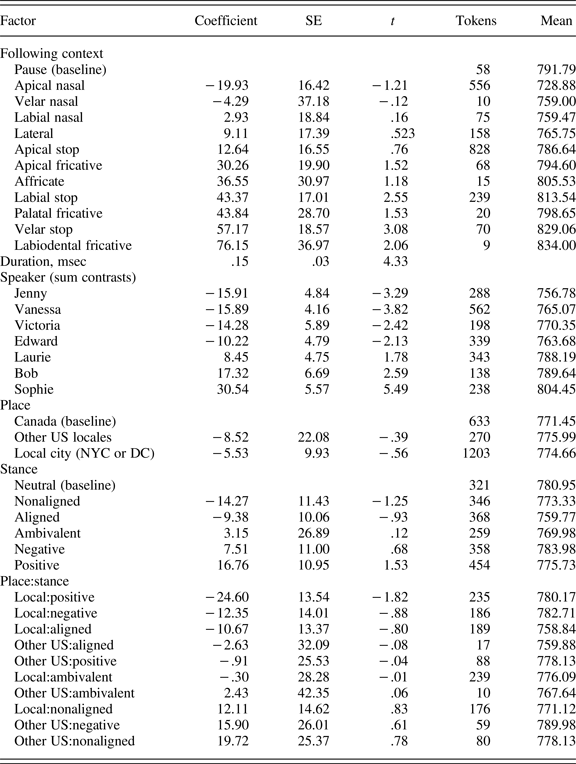
(o) tokens appearing in utterances about Canada (749) or the United States (1357) were subject to stylistic analysis. As with (oh), speaker significantly improved models of both F1 and F2, reflecting variation in the placement of the low back vowel system within the vowel space. No stylistic factor significantly improved the model of F2. In the F1 analysis, however, a surprising result emerged: a main effect of stance, with any alignment (aligned or nonaligned) associated with somewhat higher (o)s compared to neutral or evaluation stances. There was no significant main effect of nation, and no significant interaction between nation and stance. As with (oh), it is possible that dividing place topics by nation is the wrong way to assess the patterning of this variable, if speakers have come to associate particular variants of (o) with their native city alone. The analysis was rerun as for (oh), replacing the nation factor with the three-level place factor distinguishing the local region from other US places and Canada. Again, the interaction between place and stance was not found to significantly improve the model of F1, yet there was a main effect of stance (χ2(5) = 12.55, p = .03): any alignment stance (aligned or nonaligned) was associated with somewhat higher (o). Moreover, a main effect of place emerged (χ2(2) = 10.49, p = .01), with (o) in local or US talk produced somewhat higher than (o) in Canada talk (Table 8). No change in results emerged for the F2 analysis.
Summary of (o) F1 model containing place:stance interaction
n = 2106
Intercept = 757.36

DISCUSSION
Dialect change and stylistic variation among the mobile speakers
This paper examined the use of four regionally varying vowel variables by mobile speakers to determine whether these speakers have acquired new forms and new patterns of stylistic variation after living in a new community. There is much variability across speakers in how “Canadian” or “American” their realization of each variable is. However, a few generalizations emerge.
(aw) is qualitatively stable for at least half of these speakers, who (continue to) produce a significant difference between (awT) and elsewhere (aw). At the same time, there is evidence of quantitative change: even for those speakers with the greatest distance between allophones, this distance is smaller than that typically found among nonmobile Canadian English speakers, indicating that some lowering toward the US realization of (awT) has occurred. (ay) patterns more uniformly: while speakers as a group continue to produce a significant difference between (ayT) and elsewhere (ay), this difference is much smaller than that seen for (aw), and with no individual difference surpassing even 50 Hz.
The difference between (aw) and (ay) is likely attributable to the differing levels of awareness and social meaning attached to each variable. The data suggest that both (awT) and (ayT) have lowered, no doubt as a result of exposure to US input over a decade-plus of living in that country. Raised (awT), however, is linked to Canadian English and arguably Canadian identity. If expressing Canadian identity remains important to these speakers, then we expect raised variants of this variable to continue to emerge in their speech, attenuating any overall lowering of this allophone in production. To the extent that the importance of expressing this identity varies across speakers, we also expect interspeaker variation in the number of raised variants produced, and thus variation in the apparent degree of raising exhibited overall. No such mechanism should interfere with the overall lowering of (ayT), because raised (ayT) is not linked to place as such by these speakers, and so production will largely reflect more recently acquired forms. The stylistic patterning of these variables supports this hypothesis. Speakers produce their lowest—that is, most US-like—(awT)s when expressing distance from or ambivalence toward Canada, and their highest—most Canadian-like—(awT)s when expressing positive affect regarding or solidarity with Canada. (ayT), meanwhile, does not appear to vary stylistically for these speakers.
These patterns also indicate that speakers are using stylistic variation to do communicative work. They are not merely primed to use higher variants of (awT) when talking about Canadians or Canada. Instead, they deploy raised variants selectively, using them only to express positively valenced stances about Canada and related topics. When they metaphorically distance themselves from their home country, they also phonetically distance themselves from this place and its speakers by producing lower variants.
In the low back vowel system, meanwhile, we have what appears to be a qualitative change: speakers produce a phonetic distinction between (oh) and (o) that is not shared by nonmobile speakers of Canadian English. On the other hand, the quantitative change is not great, and the magnitude of the (oh)/(o) difference does not approach that exhibited by natives of NYC or DC. Indeed, detailed metalinguistic discussion of minimal pair and word list readings indicate that, with the exception of Jenny, no speaker is aware of the contrast in their new region (see Nycz [Reference Nycz and Babel2016] for further discussion of this issue). This suggests that, even if changes to existing lexical items have occurred, robust new categories have not been created.
Some speakers also vary the height of their (oh) vowel depending on how they talk about different places. For at least two of the speakers living in NYC, positive evaluation and/or alignment are associated with higher (oh) when talking about NYC, but not when talking about other places in the United States or Canada. This suggests that those speakers have learned the socioindexical link between (oh) height and NYC, and can use it in their talk to convey stances that help constitute their place identity as (new) New Yorkers. Stance-based variation in talk about Canada is less evident, though this is not surprising under an account in which raised (oh) “means” NYC, and we expect the height of (oh) to vary most predictably when speakers are talking about NYC directly. When speakers are talking about Canada, NYC might be subtly evoked as a way to enhance and complicate the stance being expressed; for example, a (hypothetical, and perhaps implausible) statement such as “Canada doesn't have very good c[ɔ̝]ffee” might explicitly convey a negative evaluation of Canada (and its coffee) while also indicating that the speaker thinks of herself as a New Yorker (who knows from good coffee). This “add-on” meaning may not occur consistently, however, making its effects difficult to see in the data.
The findings for (o) are harder to understand. First, it seems that expression of any alignment stance with respect to one's city (closeness or distance) is associated with a higher (o) vowel. Moreover, higher (o) appears in talk about the United States than in talk about Canada, regardless of stance. Both results are puzzling, because US (o) is lower, on average, than Canadian English (o). The overall place effect is reminiscent of findings by Evans and Iverson (Reference Evans and Iverson2007), who examined vowel shifts over time in the speech of Northern English students going to university in the south of England. One feature probed by this study was production of the foot and strut lexical sets: while Northern varieties do not distinguish words like “could” and “cud,” realizing both words as [kʊd], Southern varieties have split the relevant categories, producing [kʊd] and [kʌd]. Many of Evan and Iverson's speakers did show lowering of strut items to a more [ʌ]-like quality, but this change affected their foot items as well. The authors suggest that the Northern students maintained a single high back lax vowel; exposure to lower and more central tokens of words in this (to them) single category then caused the entire category to shift. Possibly something analogous is happening with the Canadians in this study: they have maintained a single low back vowel category, but exposure to higher variants on the US East Coast has caused them to shift that single category upward, particularly when speaking about their adopted city. This account does not, however, explain the fact that (oh) and (o) seem to be distinguished by speakers in the socioindexical work they can do: while (oh) height varies in sensible ways for NYC speakers according to the valence of the stance expressed, (o) height does not follow this pattern.
What is acquired?
The term second dialect acquisition is often used to describe the experience of mobile speakers who have changed the way they speak after new regional input, but it is important to consider exactly what we mean by that term. If “second dialect acquisition” means the acquisition of a separate linguistic system (analogous to second language acquisition), then, as Hazen (Reference Hazen2001) pointed out, this phenomenon may not actually exist, except as a theoretical endpoint on a continuum of style variation. Indeed, it seems inaccurate to describe the speakers in this paper as bidialectal: they gradiently vary their use of particular vowels while otherwise leaving much of their linguistic system intact.
Instead, speakers seem to have expanded the range of variants available to them for each vowel—that is, they have acquired new potential production targets for each sound, drawing from different portions of this expanded range depending on what they need to convey during an interaction. The influence of new, lower production targets is clear in the case of (awT) and (ayT), both of which are produced with lower nuclei than they would be by nonmobile Canadians. What about the older production targets, learned in the home country? It is possible, given enough time, that these older targets decay, as posited by certain implementations of exemplar theory, unless “protected” by their link to a social meaning. It is also possible that these old targets remain, but they can only influence production targets in the new, D2 context if they are linked to useful social meaning. To decide between these possibilities, we would likely have to send these speakers back to Canada and observe how they produce these vowels in the D1 context: do dormant, D1 (ayT) production targets immediately “reactivate” and affect current realizations, or do they need to be reacquired?
We can also ask whether, in the case of (awT), a new socioindexical link has been acquired. Our immediate reaction might be no, because out and about is a dialect stereotype even for nonmobile Canadians. It is unclear, though, whether this link is exploited by nonmobile speakers in the same way. Did the speakers in this study vary the height of (awT) to express stances about their Canadian identity before they moved to the United States? To my knowledge there is no study of stylistic variation in this variable among nonmobile Canadians, so this remains an empirical question.
For the low back vowels, it also seems that new production targets have been acquired, though older targets exert a much stronger influence in these cases, as the observed difference between (oh) and (o) is still much smaller than that of natives of the D2 regions. Alternatively, the problem may be a relative nonuniformity of input: many residents of both the NYC and DC Metro regions acquired their own first dialects in other places. It is telling that the speaker who exhibits by far the greatest distance between (oh) and (o) is Sophie, who has been married to a native New Yorker for almost two decades and has lived in the city for almost three. Vanessa had been in NYC longer at time of interview, but her (ex-)spouse was a fellow Canadian; Laurie, the only other speaker partnered with someone who distinguishes two low back vowels, has only lived in the region (and been married) for 10 years. This suggests that very long term, consistent input from a regular and important interlocutor may be necessary to acquire a robust low back distinction as an adult.
At the same time, some speakers are able to acquire and use the place-linked meaning of one vowel implicated in the new contrast. “New” New Yorkers Edward and Jenny vary the height of (oh) depending on their expressed alignment with NYC, and while sparse stance data from Sophie renders her data less conclusive, there is some evidence from her other US talk that she similarly links (oh) height to place. Laurie and Vanessa, however, do not pattern as expected. This might indicate that these speakers have simply failed to acquire the socioindexical link between (oh) and place identity. Another possibility is that they have learned different (or additional) meanings for this variable that are not captured by the current analysis.Footnote 7 As Eckert (Reference Eckert2008) and other Third Wave linguists noted, sociolinguistic variables occupy an “indexical field” of meanings, with different meanings becoming salient depending on context. (oh) in NYC is no exception: as Becker (Reference Becker2014) showed, listeners associate raised variants with a “classic New Yorker” persona who is also “mean and aloof.” To the extent that these less positive meanings have also been internalized by speakers, the relationships among place, stance, and usage posited here may be obscured.
Finally, it is notable that the three speakers who show the greatest low back vowel difference are also those who continue to show the greatest amount of Canadian raising in (awT)—that is, those who are most accommodating in one feature are the most conservative with respect to another. Some underlying, varying cognitive trait might account for this relationship; perhaps those speakers who are better able to absorb new production targets (because of enhanced perceptual capabilities, more fine-grained storage mechanisms, or something else) also show more flexibility in terms of stylistic variation. It is also possible that higher-level socioattitudinal factors play a role: those who have had the most experience with a new dialect (and thus more opportunities to acquire new dialect production targets) are also those best in a position to reflect on and refine their complex place identities, which we would expect to result in more stylistic variation in place-linked variables.
CONCLUSION
Many studies of language variation and identity have established correlations between attitude toward a place and use of variants associated with that place (e.g., Labov, Reference Labov1963; Watt, Llamas, Docherty, Hall, & Nycz, Reference Watt, Llamas, Docherty, Hall, Nycz, Watt and Llamas2014). It is often suggested that such correlations (where each speaker is a data point, with one attitude and one overall percentage of use) indicate that the linguistic feature is linked to an identity, and that those speakers who use more of that feature are doing so to construct that identity. However, it is difficult to determine for any individual whether the link exists and whether it is actively manipulated based on overall use alone; differences between speakers may arise simply because people separate themselves into groups at least partially based on identity and attitude, and typically acquire the patterns of the people they hang out with.
To pinpoint socioindexical knowledge, we must investigate how speakers vary their speech in different contexts. When speaking about Canada, for example, representations acquired in Canada may be more highly activated, resulting in more Canadian-English–like production targets, with the same process operating when a speaker is talking about the United States. As such, we might expect to see broad topic-related shifts in vowel realization. Such patterning, however, is hardly evident in this data and indeed is not enough to establish that speakers are actively using vowel quality to do social work; perhaps certain topics deterministically activate production targets associated with that topic. When topic shifts are mediated by stance, the evidence for active manipulation of variation is much stronger. The present work has demonstrated that the speakers in this study do vary their realizations of place-linked variables in this way: they do not passively produce higher (awT)s when speaking about Canada than when speaking about the United States, but vary their height of this variable depending on which place they feel aligned with or positive about in the moment. Similarly, talk about NYC alone does not trigger higher (oh). Speakers who have acquired the socioindexical link between (oh) and NYC favor raised variants when expressing positive stances about their new home.
Mobile speakers can come to use both D1 and D2 features stylistically, indicating that communicative competence is ever-evolving: even in adulthood people are able to expand and adapt their sociolinguistic behavior. The findings presented here raise even more questions than they answer and suggest several avenues for future research. First, more longitudinal studies of mobile speakers are needed to establish the trajectory and time course of both the acquisition of new variants and the development of stylistic variation over the life span. Second, studies of stylistic variation in the D1 are necessary to determine whether significant changes in stylistic variation have occurred for “old” variables as well as the new ones associated with D2. And linguists need to acquire more data on stylistic variation outside of the interview format (by, for example, recording single speakers over the course of an entire day or for multiple days, as in Podesva [Reference Podesva2011] and Van Hofwegen [Reference Van Hofwegen2017]), which will reveal the full flexibility of how such variables are used in interaction with a variety of people and in a variety of contexts.