In November 2000, exit poll interviews with voters in Florida indicated that Al Gore won the state. As a result, many television networks declared Gore the winner of Florida, a pivotal state to winning the presidency in 2000. Only a few hours later, the first vote tallies from the Florida Secretary of State's office revealed that George W. Bush was in fact leading in Florida. After 45 days of recounts and lawsuits, it was clear that the exit polls were wrong; Bush had won the state by the narrowest of margins. As a result of the flawed exit poll1
While many pundits agree that the 2000 exit poll contained many errors, some analysis does suggest that if a statewide manual recount had been instituted in Florida, Al Gore may have won the state (Keating and Balz 2001).
In addition to the overall exit poll results being skewed, comparative vote results for subgroups, such as that for Latino voters, also appeared to be wrong. The NEP reported on November 2, 2004, that Bush won 45% of the Latino vote, a 10-point gain from 2000. In contrast, an exit poll of only Latino voters conducted by the William C. Velasquez Institute reported that Bush won only 32% of the Latino vote. Moreover, a pre-election survey of Latino voters by the Tomás Rivera Policy Institute, a non-partisan think tank with more than 10 years experience polling Latino voters, reported Bush garnering just 30% of the vote (see Leal et al. 2005).
What explains such discrepancies? One possibility is the methodology used to select the precincts where exit poll interviews are conducted is faulty. Ideally, the respondents in the exit poll survey will be accurate representatives of the entire city or state in which the election is being held. However, if the exit poll interviews respondents that are too conservative or too liberal, too young or too old, too poor or too rich, or too White, it could skew the overall results by a wide margin, even after weights are employed. Existing exit polls are often unreliable because the members of the demographic subgroups interviewed for the poll are not necessarily representative of all members of their demographic subgroup. What's more, with a growing number of Americans voting via absentee ballot, Election Day-only exit polls2
In the state of Oregon, which is entirely vote-by-mail, pollsters must conduct telephone surveys of confirmed voters to ascertain how people in the state voted. For more on vote-by-mail in Oregon, see Karp and Banducci 2000.
Since the November 2004 presidential election considerable media coverage has focused on the exit poll controversy. A December 2004 New York Times article noted that Congressman John Conyers (D-MI) asked Edison-Mitofsky “to turn over raw data collected in Election Day exit polls, for investigation of any discrepancies between voter responses and certified election results” (Associated Press 2004); a January 2005 Washington Post headline read, “Report Acknowledges Inaccuracies in 2004 Exit Poll” (Morin and Deane 2005); and CNN noted in January 2005 that the Kerry numbers were “overstated,” and claimed that “CNN did not air those inaccurate results or post them on its website.” Thus, many scholars and pundits reached the conclusion that new alternatives to the traditional exit poll may be warranted.
Specifically, we pose two important methodological questions pertaining to the science behind exit polls: (1) what is the most accurate sampling technique for polling racial and ethnic voters in a diverse setting, and (2) how should exit polls account for early and absentee votes not cast on Election Day? To answer these questions, we implemented an alternative sampling exit poll in the City of Los Angeles during the 2005 mayoral election and compared our results to the exit poll implemented by the Los Angeles Times. We then compared both polls to the actual election results. In short, the different methodologies accounted for different results, suggesting that new approaches to exit polling are welcome.
The Good, The Wrong, and The Ugly
The academic literature regarding exit polls focuses broadly on two areas, methodology and human interactions effects. Generally speaking, exit poll methodology is comprised of two components, proper sampling techniques and the logistical practicalities involved in administering an exit poll. The conventional wisdom is that election projections should be made where precincts are randomly selected (Mitofsky 1989). However, there is growing belief in the literature regarding general polling techniques that non-probability sampling, where respondents are recruited and not randomly selected, might yield more accurate results (Couper 2000; Fiorina and Krosnick 2005). Non-probability sampling, or quota sampling, has been sharply criticized by the establishment (Mitofsky 1999), but declining response rates (Groves and Couper 1998) have led to questions about the true randomness of conventional random sampling techniques. And although lower response rates do not seem to substantively affect the results of the random polls (Keeter et al. 2000) the successful use of Internet polls has provoked thoughtful discussion on sampling techniques which are appropriate for the web, but not necessarily for a conventional exit poll (Fiorina and Krosnick 2005).
This discussion, however, is largely in the arena of survey polls, not exit polls, but there is no telling what the future might hold. There are a growing number of reasons why contemporary polling techniques would be required. For instance, the Edison-Mitofsky 2004 presidential election exit poll could not conduct a true exit poll in Oregon because Oregonians cast their ballots through the mail. The growing discussion, and actual use in government sponsored pilot programs, regarding voting with eBallots will also increase the move to conduct exit polling over the web. The sheer number of elections and surprise elections, such as the California recall, will also require greater flexibility in polling techniques. Should Internet polling produce more reliable results than pen and paper exit polling and should more states follow Oregon's voting method, or witness an increase in early voting (such as in Florida, California, Texas), the non-probability versus random sampling debate will grow. The use of absentee ballots and expanded election periods, as opposed to election days, will further lead to questions about the validity of traditional sampling techniques.
While the current debate regarding sampling continues, practical discussions regarding the relationship between the respondent and surveyor have a long tradition. Common sense tells us that human interactions will produce certain biases in any scientific experiment. Drop those interactions into a given social context, and those biases are likely to multiply. The social context can range from the respondent's likelihood to answer sensitive questions honestly (Aquilino 1994; Bishop and Fisher 1995; Benson 1941) to the influence socioeconomic status and ethnicity contribute to the validity of the survey results (Freeman 1969; Welch et al. 1973; Weeks and Moore 1981; Hurtado 1994). There are also limited contributions on the environmental context of poll taking, such as the time a poll is administered (Busch and Lieske 1985) or whether the climate affects the accuracy of polls (Doob 2001).
The business of predicting elections, however, goes beyond social and environmental contexts. The political circumstances of calling elections present exit polling with a substantial public relations problem. The difficulty is that incorrect predictions can be satisfactory from a statistical standpoint, yet quite unsatisfactory when those results are inserted into a politically charged atmosphere. George Gallup's career was catapulted by correctly predicting that Franklin D. Roosevelt would win the election in 1936 even though most straw polls predicted a win for Alfred Landon (Fiorina and Krosnick 2005, 1). Twenty years later, Gallup predicted that Dewey would defeat Truman, and even though the Dewey prediction was statistically more sound3
The prediction for Truman, however, was outside the margin of error. See www.gallup.com/poll/content/?ci=1234 for a historical rundown of Gallup Poll's predictions.
After the 2000 presidential election, a report produced for CNN by Joan Konner, James Risser and Ben Wattenberg (Konner et al. 2001) on television's performance on the night of the election concluded that exit polls had “lost much of the value it had for projecting election results in close elections.” People are not only less inclined to respond to exit polls, but the inability of the exit polls to deal with shifts in the number of absentee voters and early voters were further eroding their reliability with each succeeding election cycle (Konner et al. 2001, 3).
Following the 2000 presidential election polling debacle, Edison Media Research and Mitofsky International were charged with conducting a more accurate exit poll for the 2004 presidential election by the National Election Pool (NEP). The media affiliates that pooled resources for VNS wanted the most reliable data possible, to report on election night in 2004. While Edison-Mitofsky Research sought to address the decline in the reliability of exit polls, the results were disappointing. The 2004 presidential election exit poll overstated projections for John Kerry within precincts on average by over 6 points (Mitofsky 2005, 31) and each of the six press releases issued by Warren/Mitofsky during the election wrongly placed Kerry ahead in the race (Morin 2004). Some tried to attribute the skewed polling numbers to voter fraud (Baiman et al. 2005), but the most compelling explanation has been that differential non-response rates by Democrats and Republicans have significantly skewed the predictive power of exit polls (Mitofsky 2005; Liddle 2005). This could be based on non-response patterns, or could be based on precinct selection. If too few “Republican” precincts were selected to represent the true result in the state, Bush's numbers might appear low. Thus, selecting the best precincts to represent an entire state is extremely important.
Predicting elections has never been an insular affair, but the difference between a good call and a correct one can be at the mercy of political context. For instance, the Edison-Mitofsky regime overstated John Kerry's national numbers by 2.5 percentage points in 2004, which was not much larger than the overestimation of Bill Clinton's numbers in 1992 by the television networks (Morin 2004). The only difference is Bill Clinton won in 1992 and so it mattered little. But the calls for Al Gore and John Kerry have brought attention to previous overstatements for one party over another, and with some justification. Warren Mitofsky (2003, 51) gathered that within-precinct error in the exit polls for senate and governor races in 1990, 1994, and 1998 showed an understatement of the Democratic candidate in 20% of the 180 polls during that time period and an overstatement 38% of the time. The CNN's report on the network's performance on Election Night 2000 (Konner et al. 2001, Appendix 4) found that the exit polls overstated the Gore vote in 22 states and overstated the Bush vote in nine states.
While the history of predicting elections has seen its share of the good, the wrong, and the ugly, it is growing increasingly vital that new sampling techniques are used to accurately depict the electorate. Incorrect predictions could foment an erosion of public confidence in exit polls and the electoral system in general, and decrease the response rates of those who view polling regimes as serving a political agenda. Incorrect exit polls could also be used by policy makers and pundits to shape public policy. For example, when President Bush announced the nomination of then White House Counsel Alberto Gonzalez for attorney general, many pundits noted it was because Bush did so well among Latino voters, winning an estimated 45%. Since then, numerous media organizations and several scholars have revised the numbers downward, likely in the mid-30s (see Leal et al. 2005). Exit polls hold considerable value for our political system. In principle, the use of exit polls represents an important acknowledgement that the interests and opinions of the electorate are an important component of our political system. In practice, they play an important role in the strategic decisions of politicians and political elites, and they provide the media with an objective resource for evaluating the quality of the bonds between our representatives and their constituents (Lavrakas et al. 1995, 3–22). Although exit polls are a common occurrence in the United States, they are surprisingly uncommon in other modern democracies, such as Canada (Brown et al. 2004). In elections in the Philippines, Central America, and Russia, exit polls are often used by third parties to provide a check against voter fraud and to gauge the underlying sentiments of the citizenry (Mitofsky 1989).
Since 1948 and the birth of the modern-day exit poll in 1967 (Levy 1983, 54), the stakes of blown calls have grown steadily. The “early call” of the 1980 presidential election by the media may have helped to reduce turnout among Democrats (Crespin and Vander Wielen 2002; Carpini 1984; Jackson 1983) which could have had an impact on close congressional races. The early call for Al Gore in Florida probably led to a loss of votes for Bush in the Florida panhandle (Sobel and Lawson 2001). Most recently, the 2004 presidential election exit poll was marred by overstated projections which surpassed one standard error in more than half the states (Mitofsky 2005, 3). These missteps will certainly not contribute positively to correcting the differential non-response rates which are in turn contributing to the inability to make more accurate calls, and new sampling techniques must be experimented with to increase the precision, and credibility, of exit polling.
Exit Polling Methodology
Practitioners and consultants of exit poll projects spend considerable time designing and implementing their methodology. While a telephone survey has the advantage of randomly calling any registered voter within the state, an exit poll is economically limited to a small number of sites. Ideally, exit pollsters would set up stations at every single precinct within a jurisdiction, so that no voter is left out. Of course, it is not realistic to recruit 20,000 volunteers to staff each of the 20,000 precincts in a state like California. Thus, the key is picking a select number of precincts that accurately represent the full universe of 20,000 throughout a state. If the “wrong” precincts are selected, the results may be biased. Therefore, exit poll research teams take considerable care to select precincts. In fact, this is the most important step in exit polling. However, the selection criteria may still be flawed, as recent presidential elections have revealed. Pollsters may rely on two methods for choosing their critical sample precincts: first, they may put all the precinct numbers into a hat and randomly choose precincts to include, or, second, they may purposely choose precincts to fit the size, voter turnout, and racial specifications that fit a given election. Because pollsters want a large sample size and good cross-sections of different types of voters, they almost always rely on a purposive random sample that allows them to hand pick the precincts to include.
It is important that the methodologist is familiar with the universe they are interested in sampling, including the geographic distinctions and racial and ethnic differences within the universe. For an exit poll in the City of Los Angeles, pollsters would want to capture an accurate representation of all Los Angeles voters. For example, if 50% of voters are White, 25% Latino, 17% Black, and 8% Asian, it is important that these same ratios are reflected in who gets interviewed. Because there are not enough resources to set up exit polling stations at all 1,700 precincts in Los Angeles, pollsters select a sample of about 50 to 60 precincts, while also keeping the geography and demographics of the city in mind. The easiest way to do this would be to pick precincts that most closely resemble the overall demographics of city voters. For example, voting precinct # 9007129, situated in North Hollywood, has a population that is 49% White, 24% Latino, 15% Black, and 7% Asian—almost a microcosm of the entire City of Los Angeles. Or is it?
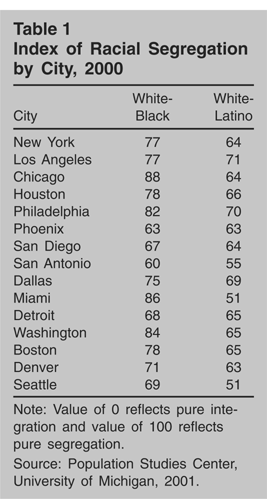
The reality is that the great majority of voters do not live in such racially integrated neighborhoods. Instead, most voters reside—and vote—in precincts that are racially homogenous. Thus, the White, Latino, Black, or Asian voters in that North Hollywood precinct may not be representative of the “typical” White, Latino, Black, or Asian voter in Los Angeles. According to an analysis of geographic segregation by the University of Michigan Population Studies Center, Los Angeles racial groups are still very much divided (Farley 2001; see also Logan 2002). On a racial residential segregation index of dissimilarity, where a value of 0 is perfect integration and a value of 100 is extreme segregation, Los Angeles is viewed as highly segregated. Farley's analysis provides an index of dissimilarity for each racial group vis-à-vis one another and reported a White-Black value of 77, a White-Latino value of 71, a White-Asian value of 55, and a Latino-Black value of 61 (2001). Given these residential distinctions, we wonder whether Latinos who vote at the 28th Street YMCA in East Los Angeles, which resides in a precinct which has a population that is 95% Latino, differ from Latinos who voted at the heterogeneous precinct in North Hollywood. And what if those Latinos at the 28th Street YMCA precinct are excluded from the exit poll? Will the overall Latino sample be flawed? Similarly, questions may arise about Asian Americans who vote at the Korean Resource Center (61% Asian population) and Blacks who vote at the Crenshaw United Methodist Church (88% Black population). In a city like Los Angeles, most citizens vote in precincts where their racial group is a majority. To this end, Los Angeles is not unique. Data from the University of Michigan Population Studies Center, reported in Table 1, reveal that residential segregation is still a significant issue in all of America's largest cities, an important consideration in exit poll precinct selection.
Index of Racial Segregation by City, 2000

Is the precinct that looks like a microcosm of the city, really a microcosm of the city, or is it an anomaly? A more accurate representation of racial and ethnic voters, and therefore the city at large, might be found if we conducted most of the exit poll interviews in high concentration racial precincts instead of mixed-race precincts. This sampling strategy is supported by data from the Los Angeles city clerk precinct list. In 2005, only 18% of precincts—less than one in five—had no racial or ethnic group as a majority, leaving 82% of precincts in Los Angeles comprised mostly of one racial group or another. In full, 38% of precincts were majority Latino, 37% majority White, 7% majority Black, and 1% majority Asian.
The 2005 Los Angeles Exit Poll Pilot Project
In an effort to address the exit poll controversy, a team of researchers at the Center for the Study of Los Angeles at Loyola Marymount University (LMU) designed an alternative exit poll methodology.4
To view full poll results, please visit: www.lmu.edu/csla/press/releases_2005/Runoff.html. Or, to download the Los Angeles 2005 exit poll data, please visit: http://faculty.washington.edu/mbarreto/data/
In order for the LMU exit poll project to be accurate, it was implemented in a rigorous and scientific manner. LMU researchers identified 50 precincts to be included in the exit poll survey, and two students were assigned to each precinct to carry out the interviews. Bilingual students were used in heavily Latino and Asian communities. Exit polling was conducted from 7:00 am to 8:00 pm, the entire time that the polls were open. Prior to the May 17, 2005, election, students attended two training sessions and received instructions on recruiting participants, skip pattern, and the confidentiality of the data. The exit poll implemented a traditional skip pattern and replacement strategy.5
Given the number of registered voters and anticipated voter turnout, pollsters were required to attempt to interview every fifth voter that left the precinct.
Different Polls, Different Results
In May 2005, Los Angeles elected its first Latino mayor in more than 130 years. Once a Mexican city in Alta California, the city of angels has the largest Latino population of any city in the United States. However, voters in Los Angeles are still predominantly White (50% of the electorate), with Latinos constituting about 25%, Blacks 17%, and Asian Americans 7%. Thus, electing a Latino mayor is not a Latino-only phenomenon. While Antonio Villaraigosa won an estimated 85% of the Latino vote in 2005, he also captured a majority of White and Black votes to win the election 59% to 41% over incumbent Mayor James K. Hahn. While it takes a broad coalition to win most public offices—especially mayor of a diverse city—it was Latino voters and Latino candidates who received most of the focus. A week after the 2005 Los Angeles election, Villaraigosa graced the cover of Newsweek magazine with the headline, “Latino Power!” An overlooked aspect of this election was the ability of Villaraigosa to win among Latinos, Blacks, and Whites in Los Angeles. However, this may have been overlooked because the mainstream media reported that Villaraigosa did not win a majority of Black or White votes. The Los Angeles Times exit poll noted that Villaraigosa only captured a majority of Latino votes. In contrast, the exit poll conducted by Loyola Marymount University found Villaraigosa won among Latinos, Blacks, and Whites.
The Loyola Marymount University and Los Angeles Times exit polls show many similar patterns and results. However, there are also some notable differences. This might be expected given that each organization used a somewhat different approach to implementing their exit polls.
First, both exit poll surveys were only conducted of voters on Election Day, which means that absentee voters are not included in the full survey results. To account for these missing voters, both LMU and the Los Angeles Times weighted their data to incorporate absentee voting patterns when the official data became available from the city clerk. However, considerable differences in how the absentee vote was incorporated into each exit poll potentially bias the results (explained in detail below). In the May 17, 2005, election, absentee voters made up 27% of the Los Angeles electorate and voted 51.4% to 48.6% in favor of Antonio Villaraigosa. However, it is the Election Day voters that we are interested in examining closer.
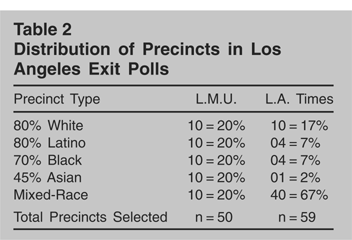
The LMU exit poll was carried out in 50 precincts across Los Angeles, and administered in five languages: English, Spanish, Chinese, Korean, and Tagolog. The Los Angeles Times poll was carried out in 59 precincts and available only in English and Spanish. In addition, the LMU poll specifically chose precincts in homogenous racial communities. For example, the precincts selected by LMU consisted of:

These final 10 precincts were in “mixed” or heterogeneous neighborhoods where no group comprised a clear majority. According to our analysis of precincts in Los Angeles, about one-fifth of polling places are located in “mixed” communities, with over 80% of polling places in racially homogenous communities. For the most part, Angelinos continue to live and vote in racially segregated precincts. Therefore it is important that the respondents to the exit poll come from such precincts. In comparison, the Los Angeles Times interviewed an overwhelming majority of its respondents in mixed-race precincts, as noted in Table 2. While both datasets were weighted to reflect the correct percentage that each racial or ethnic group accounted for within the electorate, weighting merely replicates the data already gathered, which may already be invalid. Leal et al. (2005) argue that in 2004, Edison-Mitofsky chose the wrong precincts in which to interview Latinos in Texas, something that weighting could not address.
Distribution of Precincts in Los Angeles Exit Polls

Second, given that both studies did not include absentee voters, it is important to approximate the Election Day total that both candidates received. Since we can not know the racial composition or voting preferences of each absentee voter, we only focus on Election Day voters for this study. If Villaraigosa received 58.7% of the overall vote, and 51.4% of the absentee vote, it is easy to ascertain his share of the Election Day vote, given T=total vote; P=precinct vote; A=absentee vote; and S=absentee share of electorate (which the city clerk notes was 27%).


Quite simply, Equation 1.2 tells us that Villaraigosa must have won 61.4% of the precinct vote cast in order to have won 58.7% citywide, once the absentee votes were included.
Thus, the key is to come to a solution that adds up to 61.4%, and not 58.7%, of the vote for Antonio Villaraigosa when using exit poll data. Any attempts to weight the data by final vote percentages (which include absentee votes) inappropriately assign absentee voting patterns to Election Day voters. The LMU poll weighted its data based on race/ethnicity to avoid this problem and incorporated absentee voters using Equation 1.1. The Los Angeles Times weighted its precinct-only data on the final vote tally, 58.7% to 41.3%, which included absentee voters.
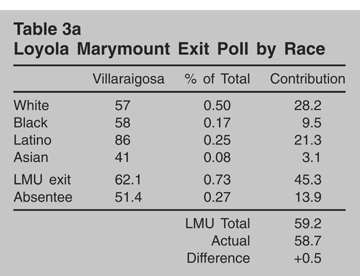
Table 3a below depicts this simple formula for the Loyola Marymount University exit poll data. First, the LMU data shows somewhat higher rates of support for Villaraigosa among Whites and Blacks than does the Los Angeles Times data. However, this is consistent with Villaraigosa winning 61.4% of the Election Day vote total. If we multiply the percent support for Villaraigosa times the percent of the electorate that each group comprised on May 17, we arrive at an LMU estimate of 62.1% of the vote won by Villaraigosa.
Loyola Marymount Exit Poll by Race

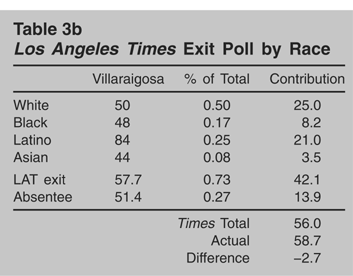
In contrast, Table 3b shows the Los Angeles Times data and support for Villaraigosa for each racial group. The same formula results in a 57.7% vote share for Villaraigosa among the exit poll sample, about 4 points too low. Given that the Election Day sample accounted for 73% and absentee votes for 27% of all the votes cast, we can determine the final outcome for each poll by incorporating exit poll data and absentee data (which is known from the Los Angeles City clerk's office).
Los Angeles Times Poll by Race

The simple calculations reveal that the LMU exit poll, plus absentee voting patterns, results in an estimated Villaraigosa vote share of 59.2%, about 0.5 points too high. In comparison, the Los Angeles Times exit poll data, plus absentee voting patterns, results in an estimated Villaraigosa vote share of 56.0%, about 2.7 points too low. We argue that the Los Angeles Times results are too low overall, because they underestimate Villaraigosa's vote share among Blacks and Whites, which LMU estimates at 58% and 57%, respectively.
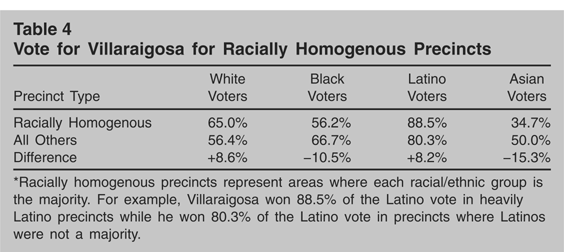
Finally, when we compare the results for racially homogenous and racially heterogeneous precincts considerable differences emerge. Table 4 tabulates vote totals for each racial/ethnic group in Los Angeles based on whether or not they voted in a precinct where their racial/ethnic group was the majority (in the LMU dataset). A Black voter that voted in a predominantly Black precinct is counted in the first row, racially homogenous precinct, while a Black voter that voted in a predominantly Latino, Anglo, Asian, or a mixed-race precinct is captured in the second row, “all other” precincts. This division allows us to determine whether racially homogeneous precincts, where most voters live and vote, actually report different vote patterns.
Vote for Villaraigosa for Racially Homogenous Precincts

Significant vote differences are found with respect to homogeneous and heterogeneous precincts for every ethnic group in Los Angeles. For example, Latinos who voted in heavily Latino precincts demonstrated an 88.5% vote preference for Villaraigosa, compared to 80.3% among Latinos in non-Latino precincts. Similarly, White voters in White precincts were more likely to vote for Villaraigosa. For Blacks and Asians the inverse pattern was found. Black voters in heavily Black precincts voted for Villaraigosa at 56.2%, compared to 66.7% for Black voters in non-Black precincts,6
Interestingly, the LMU exit poll finds that both groups of Black voters—those in predominantly Black precincts and those in mixed-race precincts—voted in support of Villaraigosa, in contrast to the findings by the Los Angeles Times poll. This makes the Black sample in the Times poll even more suspect given that most of their Black sample came from mixed-race precincts. Another explanation for the comparatively lower Villaraigosa support among Blacks is the Times weighting system which uses final vote totals including absentee voting. As a point of fact, Black absentee voting rates and vote preference are unknown by both polls.
Implications
Exit polling is both a science and a business, creating many challenges that are not always easy to address. Since the inception of presidential straw polls, political parties, candidates, analysts, and academics have all devoted considerable time to improving the accuracy and reliability of predicting elections. Fifty years after the infamous 1954 Gallup Poll that incorrectly called the election for Dewey over Truman, political scientists continue to debate the methodology behind predicting elections. Building on the errors in the 2000 exit poll, the National Exit Poll was launched in 2004, state sample sizes were increased and deemed more accurate, and, in the end, many of the same errors were made. In our opinion, more debate and research are needed for exit polling to address two fundamental issues: first, how to accurately include and account for minority voters, and second, how to accurately include and account for absentee voters. Both issues speak to sample design, and precinct selection in particular is a crucial issue for pollsters to consider.
In 2005, two very different exit polling methodologies were employed to answer the same question: what percent of the vote did mayoral candidates in Los Angeles win, and how did this vary by racial group? The Loyola Marymount University exit poll implemented a racially stratified homogenous precinct approach that specifically designated precincts in predominantly White, Black, Latino, and Asian neighborhoods, with a handful of mixed-race precincts. The Los Angeles Times poll included mostly mixed-race precincts and only a few racially homogenous precincts. The result was different results. We argue that the racially stratified homogenous precinct approach is more accurate because it is a more natural, or realistic, approach to exit polling in a diverse, and residentially segregated city.
Biographies
Matt A. Barreto is assistant professor of political science at the University of Washington. His research interests include Latino political participation and public opinion and has appeared in several journals including the American Political Science Review and Public Opinion Quarterly.
Fernando Guerra is associate professor of political science and Chicano studies at Loyola Marymount University and director of the Center for the Study of Los Angeles, a leading think tank on Los Angeles and urban politics. His research interests include urban politics, political leadership, and racial/ethnic politics.
Mara Marks is assistant professor of urban studies at Loyola Marymount University and a research scholar at the Center for the Study of Los Angeles. Her research interests include urban politics, racial/ethnic politics, and land-use politics. Her articles have appeared in the Urban Affairs Review, among other journals.
Stephen A. Nuño is a doctoral candidate in political science at the University of California, Irvine and a research associate at the Center for the Study of Los Angeles. His research interests include Latino partisanship, voting behavior, and political participation.
Nathan D. Woods is an economist with Welch Consulting in Santa Monica, California. His research focuses on the political participation of racial and ethnic minorities and has appeared in the American Political Science Review, Journal of Politics, and other journals.