I. INTRODUCTION
Microcellular foams refer to thermoplastic foams with cells of the order of 10 μm. The idea to incorporate such small bubbles in thermoplastics goes back to early work at MIT.Reference Martini, Suh and Waldman1,Reference Martini, Waldman and Suh2 The basic solid-state batch process used for polystyreneReference Martini, Suh and Waldman1 has been used to create microcellular foams from a number of amorphous and semicrystalline polymers, such as polyvinyl chloride (PVC),Reference Kumar and Weller3 polycarbonate (PC),Reference Kumar and Weller4 acrylonitrile butadiene styrene (ABS),Reference Nawaby and Handa5 and polylactic acid (PLA),Reference Wang, Kumar and Li6 to name a few.
There are two basic steps in the solid-state foaming of thermoplastic polymers. The first step is saturating the virgin polymer under high pressures of an inert gas such as CO2 in a pressure vessel. The high pressure gas will then start to diffuse into the polymer, causing a mass increase of the polymer. The gas will continue to saturate the polymer until equilibrium is reached. In the second step, bubbles are nucleated in the gas-polymer system by creating a thermodynamic instability. This is achieved by either a sudden drop in pressureReference Goel and Beckman7 or sudden increase in temperature.Reference Kumar and Weller3,Reference Kumar and Weller4 Both methods suddenly reduce the solubility of the gas, driving the gas out of the polymer matrix and into nucleated bubbles.
Molecular weight is known to influence mechanical properties of polymers.Reference Wool8,Reference Nielsen and Landel9 But little research has been done to examine its effect on the solid-state microcellular foaming process. LeeReference Lee, Lee, Jeong and Kim10 studied the effect of molecular weight on foam melt extrusion process and found that the cell size and degree of foaming decreased with increasing molecular weight. StaffordReference Stafford, Russell and McCarthy11 studied the effect of molecular weight on supercritical CO2 foaming of polystyrene and found that molecular weight did not significantly affect cell size and cell densities. However, the effects of molecular weight on each step of microcellular foaming and resulting foam properties are still largely unexplored.
PET has good strength, ductility, gas barrier properties, and food compatibility. As the most recycled plastic, it has been widely used for various packaging applications. The sponsor of this research, which makes microcellular products from recycled PET, was concerned with the variability of intrinsic viscosity (IV) in incoming recycled sheets. The PET recycling stream is mainly from water bottles and soft drink bottles, in which IV typically ranges from 0.7 to 0.85 dL/g.Reference Fakirov12 IV range investigated in this study (0.68–0.81 dL/g) reflected the typical IV variations in recycled PET stream. In this paper, we investigated the effect of IV (an indirect measure of molecular weight) on sorption, desorption, and foaming of PET, and final foam properties including relative density, microstructure, and skin thickness.
II. EXPERIMENTAL
A. Materials
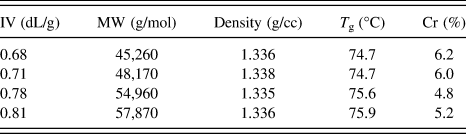
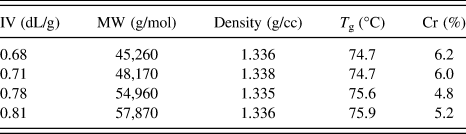
PET resins were supplied by Phoenix Technologies International, LLC. (Bowling Green, OH). These resins were made with four different IV levels by different degrees of chain extending. Resins were compression-molded into 50.8-mm diameter disk-shaped samples with thickness 0.82 mm using a hydraulic hot press. IV of the molded sheets was then determined according to ASTM D4603 by dissolving polymer in solvent 60/40 phenol/TCE at temperature 30 °C. Average molecular weight (MW), density, glass transition temperature (T g), and percent crystallinity (Cr%) are all shown in Table I for corresponding IV levels. Average molecular weights were calculated from IV values using Mark–Houwink equation with the parameters K = 2.64 × 10⁻⁴ and a = 0.73, which were suggested by the materials provider. The differences in density, T g and Cr% are negligible compared to the IV or molecular weight. Notice that molecular weight and its range are shown here, but IV will be used as major and more accurate distinguishing parameter for samples in this study.
Intrinsic viscosity, average molecular weight, density, T g and crystallinity of PET samples.
Differential scanning calorimetry (DSC) measurements were performed on a TA Instruments Q20 setup (New Castle, DE). The DSC procedure followed the ASTM D3418-08 technique at a heat rate of 10 °C/min, and T g and Cr% were determined from DSC plots.
B. Sorption and desorption
Disk-shaped samples with diameter 50.8 mm and thickness 0.82 mm were put in stainless steel pressure vessel and introduced to industrial grade CO2 at 3, 4, and 5 MPa. The pressure was controlled within ±0.1 MPa by a pressure controller. The temperature was maintained at room temperature. During saturation, the samples were periodically removed from the pressure vessel and weighed on METTLER AE240 balance (Columbus, OH) which has an accuracy of ±10 μg. Sorption experiments were carried out until the mass of the sample did not change between measurements, indicating that the CO2 concentration had reached equilibrium. After the samples were fully saturated with gas in the sorption step, they were removed from the pressure vessel and placed in the room temperature environment. Mass of the samples was periodically measured.
C. Foaming
The saturation time used in this study for 3, 4, and 5 MPa is 240, 144, and 48 h, respectively. After full saturation, samples with different IVs were taken out from the pressure vessel and transferred to an oil bath. After 2 min transfer time, samples were immersed into the oil bath for 30 s. A range of foaming temperatures was chosen: 80, 90, 95, 100, 105, and 110 °C. After foaming, samples were quenched in room temperature water to stop further foaming from the residual hot oil on the sample surface. Samples were then washed and dried for further characterizations.
D. Characterizations
Density of foamed samples was measured according to ASTM D792 using a Mettler AE240 analytical scale. A representative set of samples was imaged with a scanning electron microscope (FEI Sirion SEM, Hillsboro, OR) to characterize the microstructures produced. The obtained SEM images were analyzed using software ImageJ for cell size, cell nucleation density, and skin thickness. The cell size was reported as the average value of the cell diameters of at least 50 cells within a single micrograph. Cell nucleation density and skin thickness were determined using the methods developed by Kumar and Weller.Reference Kumar and Weller3,Reference Kumar and Weller13
III. RESULTS AND DISCUSSION
A. Sorption and desorption
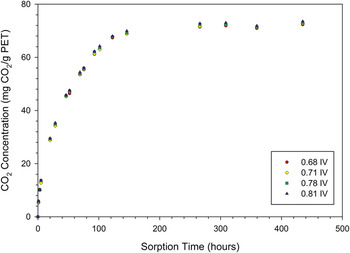
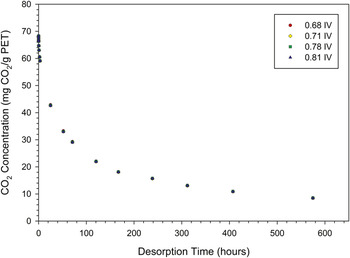
Figure 1 shows the sorption of CO2 in PET at 4 MPa and room temperature. Each data point in the plot represents an average value of two samples. We can see that different IV PETs have essentially the same sorption behavior. The maximum difference of CO2 concentration between different IV PETs at each point was calculated, and the average value of these maximum differences was only 2%, which is about the same as possible experimental errors. Figure 2 shows the desorption plot of CO2 in PET immediately after 4 MPa full saturation. Each data point represents an average value of two samples. It can be seen that different IV PETs have the same desorption behavior. The average of maximum differences was only 0.5%. Similar results were found for 3 and 5 MPa conditions (not shown due to page limit). The average maximum differences in CO2 concentration were 1.6% and 2% for 3 MPa and 5 MPa sorption, respectively; and 0.4% and 1.8% for 3 MPa and 5 MPa desorption, respectively. Therefore, for the IV range investigated and at room temperature condition, PETs of different IVs have essentially the same sorption and desorption behaviors.
Sorption plot of CO2 in different IV samples (thickness 0.82 mm) at 4 MPa saturation pressure and room temperature.

Desorption plot of CO2 in different IV samples (thickness 0.82 mm) in room temperature environment immediately after 4 MPa full saturation.

B. Relative density
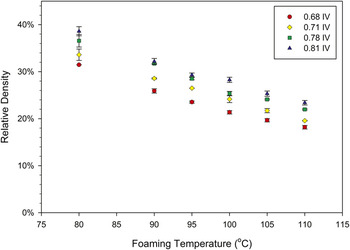
Relative density is defined as the ratio of foam density to the density of the unfoamed material. Macroscopically, under the same foaming conditions, different IV PETs had different degrees of expansion. This is verified by data in Fig. 3 which shows relative density of different IV PET foams as a function of foaming temperature. All samples were saturated at 4 MPa and then processed at various temperatures. Each data point represents the average relative density of three samples. We can see that under identical processing conditions, relative densities increase as IV increases. For all foaming temperatures, an increase of 0.1 dL/g in IV brings an average 4% absolute increase in relative densities. Also, from the graph, as the foaming temperature increases, the relative densities of foamed PET decrease for all the different IV PETs. This observation agrees with results on PET in literature.Reference Stolarczuk14 Similar results of IV effects were found for 3 and 5 MPa conditions. In summary, under identical processing conditions, higher IV PET foamed samples have higher relative densities. The lower relative density in low IV samples is due to the larger cells they possess, which will be discussed in the microstructure section.
Relative density of different IV PET foams as a function of foaming temperature. All samples were initially saturated at 4 MPa.

C. Microstructure
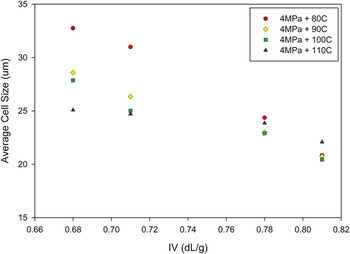
Figure 4 shows the average cell size of foamed PET as a function of IV at various foaming temperatures. We can see that the average cell size decreases with increasing IV. At different foaming temperatures, IV seems to have different degrees of effect: at 80 °C, the cell size has a larger change, from 33 μm for 0.68 IV sample to 21 μm for 0.81 IV sample; at 110 °C, the cell size changes from 25 μm for 0.68 IV sample to 22 μm for 0.81 IV sample. The energy input to the gas–polymer system at the higher temperature seems to neutralize any variations in cell size and cell nucleation density on account of IV difference. On average, the cell size has about 20% reduction for a 0.1 dL/g increase in IV.
Average cell size of foamed PET as a function of IV at various foaming temperatures. All samples were initially saturated at 4 MPa.

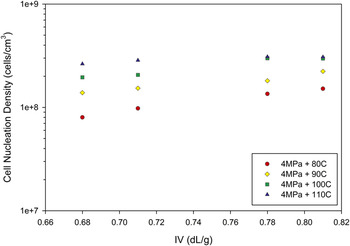
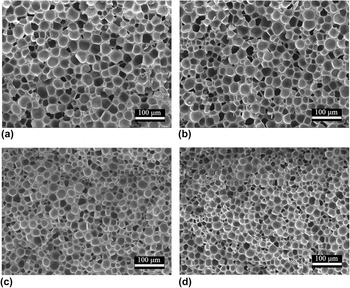
Cell nucleation density results are shown in Fig. 5. As IV increases, so does the cell nucleation density. Similar to the cell size case, IV shows different degrees of effect on cell nucleation density under different foaming temperatures. On average, for a 0.1 dL/g increase in IV, cell nucleation density has an increase of 40%. Also, notice that in the plot, logarithm of cell nucleation density seems to have a linear relationship with IV. Figure 6 shows the microstructure of different IV PET foams processed at 4 MPa and 80 °C. There are visible differences in the images even the imaged areas are as small as 0.0028 cm2. Clearly, the bottom two images have more cells than the top two. Similar results were found for PET samples saturated at 3 and 5 MPa.
Cell nucleation density of foamed PET as a function of IV at various foaming temperatures. All samples were initially saturated at 4 MPa.

Microstructure of different IV PET foams (all saturated at 4 MPa and foamed at 80 °C): (a) 0.68IV, 241 cells; (b) 0.71IV, 287 cells; (c) 0.78IV, 379 cells; and (d) 0.81IV, 427 cells. The magnification is 200x.

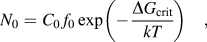
The classical nucleation theory has been used in solid-sate microcellular foaming research to understand the general trends. The homogeneous nucleation rate N 0 is given byReference Colton and Suh15
 $${N_0} = {C_0}\,{f_0}\exp \left( { - {{\Delta {G_{{\rm{crit}}}}} \over {kT}}} \right)\quad ,$$
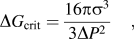 $$\Delta {G_{{\rm{crit}}}} = {{16{\rm{\pi }}{{\rm{\sigma }}^3}} \over {3\Delta {P^2}}}\quad ,$$
where ΔG crit is the free energy of critical nucleus formation (or activation energy), C 0 is the concentration of gas molecules, f 0 is the frequency factor of gas molecules joining a nucleus, k is the Boltzmann constant, T is the absolute temperature, σ is the surface energy at the polymer–cell interface, and ΔP is gas saturation pressure.
Under identical processing conditions, different IV samples had the same C 0, T, and  $\Delta P$. LiteratureReference Legrand and Gaines16–Reference Chee18 shows that the surface energy σ typically increases as the molecular weight increases. This would result in lower activation energy and thus higher nucleation density in lower IV samples, which contradicts the results in this study. This suggests that the classical nucleation theory may not be suitable for explaining the IV effects on solid-state microcellular foaming.
Upon nucleation, gas molecules have two possibilities: one is to go into a critical nucleus to stabilize it; the other is to diffuse into an already created cell to aid the cell growth. These two processes compete for the finite amount of gas molecules in the polymer. Our hypothesis for the fact that higher IV shows a higher nucleation density is this: in higher IV samples, polymer chains have lower mobility, and thus, the gas molecules tend to go into local critical nuclei instead of overcoming the polymer chain hindrance to diffuse a long path into cells relatively far away to aid the cell growth. Also, due to its longer polymer chains and larger intermolecular forces, thus lower chain mobility, the higher IV samples have higher resistance to cell growth or expansion. Thus, higher IV samples show smaller cell sizes.
It is expected that in higher IV specimens there would be a larger resistance for small cells to coalesce to form larger cells. Thus, one might expect that the higher IV specimens will show smaller cells and a higher cell density. However, the uniformity of microstructures of the specimens indicated that no significant coalescence happened. This is likely due to the rather narrow range of IV’s explored in this study.
D. Skin thickness
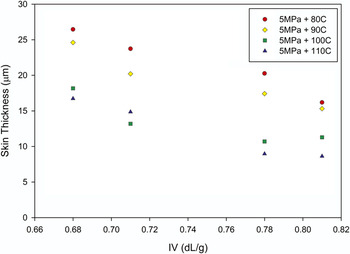
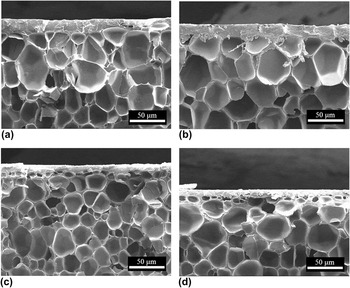
Skin is an integral part of skin-core sandwich structure, which typically results in higher specific mechanical properties.Reference Klempner and Sendijarevic19 Among all the foamed samples, samples saturated at 5 MPa showed solid skins, which were used to investigate the effect of IV on skin thickness. Figure 7 shows skin thickness of 0.68, 0.71, 0.78, and 0.81 IV PET foams as a function of IV under various foaming temperatures. We can see from the plot that as IV increases skin thickness decreases for all conditions. For a 0.1 dL/g increase in IV, skin thickness has an average reduction about 30%. Figure 8 shows examples of skins of different IV PET foams.
Skin thickness of foamed samples as a function of IV under various foaming temperatures.

Skin of different IV PET foams (all saturated at 5 MPa and foamed at 110 °C): (a) 0.68IV, skin thickness 16.7 μm; (b) 0.71IV, skin thickness 14.9 μm; (c) 0.78IV, skin thickness 9.0 μm; (d) 0.81IV, skin thickness 8.7 μm. The magnification is 500x.

As discussed above, the higher IV samples had higher cell nucleation density attributed to enhanced local nucleation. In the same manner, this enhanced local nucleation due to lower chain mobility in the higher IV samples leads to nucleation in a larger volume of the specimen, leading to smaller skin thickness.
IV. CONCLUSIONS
We investigated the effect of IV on microcellular foaming of PET and final foam properties, including relative density, cell size, cell nucleation density, and skin thickness. In the sorption and desorption, IV showed negligible effects on the diffusion rate and final equilibrium CO2 concentration in PET. High IV foams had higher relative densities than low IV foams under the same saturation and foaming conditions. An increase of 0.1 dL/g in IV brought about an average of 4% increase in absolute values of relative density for 4 MPa samples. Microstructure characterization showed that high IV foams had smaller cell size and higher cell nucleation densities. For a 0.1 dL/g increase in IV, in 4 MPa samples, there was an average of 20% reduction in cell size and 40% increase in cell nucleation density. We hypothesize that lower chain mobility (due to the longer polymer chains) in higher IV samples led to more localized cell nucleation, resulting in a higher nucleation density, and also more constraints for cell expansion, resulting in a smaller cell size. In addition, with 5 MPa saturation condition, high IV foams were found to have smaller skin thicknesses than low IV foams. For a 0.1 dL/g increase in IV, skin thickness has an average reduction of about 30%. The smaller skin thickness in higher IV samples is also hypothesized to be due to lower chain mobility. This study showed that IV had effects on various aspects of the final product, including density, cell size, and skin thickness. These effects can be significant depending on how well the final product quality needs to be controlled. To have a very consistent final product quality, the IV of the incoming raw material needs to be well controlled. Also, the knowledge of IV effects from this study enables us to tailor processing conditions to achieve desired structure and properties.
ACKNOWLEDGMENT
This study was supported by MicroGREEN Polymers, Inc. Their support is gratefully acknowledged.