



Obesity in children and adolescents is one of the most important and increasing public health problems in both developed and developing countries. Reference Ogden, Carroll, Kit and Flegal1 It is also strongly associated with adult obesity, which significantly increases the risk of type II diabetes, cardiovascular disease, cancer, and premature death. Reference Simmonds, Burch and Llewellyn2,Reference Brisbois, Farmer and McCargar3 Besides ischemic heart disease, recent studies have shown an increased incidence of non-ischemic cardiovascular diseases, including arterial hypertension, cardiac remodelling, arrhythmias, heart failure, and venous thromboembolism in these individuals. Reference Umer, Kelley, Cottrell, Giacobbi, Innes and Lilly4,Reference Sommer and Twig5
Impairment in atrial electromechanical coupling and the prolonged intra- and inter-atrial conduction times reflect inhomogeneous propagation of sinus impulses. Reference Dilaveris, Gialafos and Sideris6 Therefore, it is considered the electrophysiological hallmark of fibrillation-prone atria. It is simply the interval from the onset of electrical activity to the actual myocardial contraction. Studies in children and adults have shown an increase in atrial electromechanical coupling and thus an increased risk of atrial fibrillation in different diseases. Reference Ozveren, Izgi and Eroglu7–Reference Kocabaş, Salman, Ekici, Çetin and Akcan10 The autonomic nervous system plays a central role in the regulation of cardiovascular function, and abnormalities in its function are associated with increased cardiovascular mortality. Reference Lauer, Okin, Larson, Evans and Levy11,Reference Cole, Blackstone, Pashkow, Snader and Lauer12 Heart rate response during exercise is a complex combination of chronotropic reserve during exercise and heart rate recovery after exercise cessation. Reference von Scheidt, Meier and Krämer13 Heart rate recovery is an important measure of autonomic nervous system dysfunction and is considered to be directly related to parasympathetic activity. Reference Shetler, Marcus and Froelicher14 The heart rate recovery index is defined as the reduction from the heart rate at the peak of exercise to the heart rate at the 1st, 2nd, 3rd, and 5th minutes after the end of the exercise stress test. A delayed decline in heart rate may reflect decreased vagal activity and is a strong predictor of overall mortality. Reference Cole, Blackstone, Pashkow, Snader and Lauer12 To the best of our knowledge, it has not yet been assessed in childhood obesity. The aim of our study was to evaluate cardiac functions and impact of obesity on electrophysiological characteristics of the atria and heart rate response in children with obesity.
Methods
The study population included 52 obese children (34 boys and 18 girls) and 52 healthy control subjects (32 boys and 20 girls). All of the obese children were recruited from cases between the ages of 6 and 18 years who were referred to our paediatric endocrinology outpatient clinic for obesity evaluation. Weight was measured using digital weighing scale (SECA 841, Hamburg, Germany) to the nearest 100 g, while subjects were wearing light clothes and were bare footed. Height was measured using stadiometer (Holtain Instruments Ltd, Crymych, UK) to the nearest 0.1 cm, while subjects were standing without shoes on a horizontal surface. The subjects underwent detailed physical examination including evaluation for syndromes and endocrine diseases. Children with syndromal obesity such as Prader–Willi and Bardet–Biedle syndromes and those with endocrinological pathologies (such as Cushing’s syndrome and hypothyroidism, etc) were excluded. Obesity is defined as a body mass index ≥ +2 SDS. Age and sex-specific national cut-off points of body mass index were used to determine obesity. Reference Neyzi, Bundak and Gökçay15 The control group included age- and sex-matched non-obese healthy children with no cardiovascular disease. Exclusion criteria included patients with congenital heart disease, electrocardiography findings other than sinus rhythm or bundle branch block, patients taking anti-arrhythmic or sympathomimetic drugs for any reason, patients with valvular heart disease, systemic hypertension, and any concomitant systemic disease. All obese and control subjects underwent 12-lead electrocardiography, echocardiographic examination, and treadmill exercise testing. A written informed consent was obtained from all parents of the children, which was approved by the Hospital Ethics Committee.
Echocardiographic examinations
Echocardiographic examinations (Philips Affiniti 50 Cardiac Ultrasound, 5-1 MHz transducer; Bothell, WA, United States of America) of all patients and control subjects were performed by a paediatric cardiologist blinded to clinical details. A single-lead electrocardiogram was recorded continuously during echocardiographic studies. Two-dimensional, M-mode, pulsed-wave, continuous-wave Doppler, and tissue Doppler imaging echocardiographic images were obtained. Left ventricular ejection fraction, mitral annular plane systolic excursion, and the tricuspid annular plane systolic excursion were measured using M-mode as reliable markers of left and right ventricular systolic function. Peak early (E) and late (A) wave velocities of the mitral valve, and the E/A ratio were measured to evaluate the diastolic function of the left ventricle pulsed-wave Doppler. Also, pulmonary flow at the pulmonary valve level was recorded by pulsed-wave Doppler echocardiography to measure the acceleration time of the pulmonary flow trace/right ventricular ejection time ratio.
Tissue Doppler imaging studies were performed at the lateral mitral annulus, septal mitral annulus, and right ventricular tricuspid annulus (mitral, septal, and tricuspid segments, respectively). Longitudinal peak annular velocities during systole (S'), early diastole (E'), and late diastole (A') were measured, and the E'/A' ratio was calculated. Also, the myocardial performance index was calculated as follows Reference Tei, Nishimura, Seward and Tajik16 : ([isovolumic contraction time + isovolumic relaxation time] / ejection time).
Atrial electromechanical coupling was defined as the interval from the onset of the atrial electrical activity (P-wave on surface electrocardiography) to the beginning of the mechanical atrial contraction (A’ wave) (Fig. 1). It was measured from the same three segments mentioned above. The difference between the lateral and tricuspid atrial electromechanical coupling intervals was defined as interatrial conduction delay, and the difference between the septal and tricuspid atrial electromechanical coupling intervals was defined as intra-atrial conduction delay. Reference Özer, Yavuz and Can17
Measurement of the atrial electromechanical coupling from onset of the P-wave on the surface electrocardiogram (ECG) to the beginning of the A’-wave on the tissue Doppler echocardiogram.

Treadmill exercise testing
All patients in the study underwent treadmill exercise testing using the Bruce protocol. The predicted peak heart rate was calculated as (220 − age), and the aim was to reach at least 85% of the age-predicted heart rates. The end of the exercise was marked, and the post-exercise heart rate was recorded for at least 5 minutes while the patient rested. Qualified exercise physiologists and/or a cardiology fellow prospectively collected physiologic and haemodynamic data during testing, including symptoms, heart rhythm, blood pressure, estimated functional capacity in metabolic equivalents, heart rate reserve (increase in heart rate from resting level to peak exercise), chronotropic index (it was calculated by a formula as: [(peak heart rate–resting heart rate)/ (220–age–resting heart rate)], Reference Wilkoff and Miller18 and heart rate recovery indices (the reduction in heart rate from the rate at peak exercise to the rate at the 1st, 2nd, 3rd, and 5th minutes after the cessation of the exercise stress test).
Statistical analysis
Statistical analysis was performed using SPSS for Windows, version 26.0 software (SPSS, Chicago, IL, United States of America). All continuous variables were expressed as mean ± standard deviation or median and interquartile range. Categorical variables were defined as percentage and number of cases. Categorical data were compared using the χ2 test. Continuous variables were compared between the groups using Student’s t-test or the Mann–Whitney U-test depending on whether they were distributed normally or not, as tested by the Kolmogorov–Smirnov test. Pearson’s correlation analysis was used to estimate the relationship between the test parameters. A p value < 0.05 was considered to be statistically significant.
Results
The mean age was 12.4 ± 2.7 years (range, 7.5–17.6 years) in the obese group and 12.5 ± 2.9 years (range, 6.7–17.5 years) in the control group (p = 0.87). While gender distribution was similar between groups (p = 0.69), body mass index and body mass index-SDS were significantly higher in obese group compared to controls (p < 0.001).
Electrocardiography findings revealed a significantly higher heart rates in obese group than controls (91 ± 13.2 beats/min versus 79.3 ± 13.2 beats/min, respectively; p < 0.001). However, PR interval (0.14 s versus 0.13 s, respectively; p = 0.22) and QTc duration (394.8 ± 12.8 ms versus 391.7 ± 15.6 ms, respectively; p = 0.27) were similar between two groups.
Echocardiographic examinations showed that the left ventricular diameter of obese group was significantly increased at both end-diastole and end-systole compared to the control group (p = 0.001 and p = 0.019, respectively). Left ventricular systolic function parameters obtained by M-mode echocardiography and diastolic parameters obtained by continuous-wave Doppler of mitral inflow velocities were similar between the groups. Mitral annular plane systolic excursion values were significantly higher in the patient group (p < 0.001). Although tricuspid annular plane systolic excursion values were similar between obese and control subjects (p = 0.5), tricuspid regurgitation velocity was significantly higher (p = 0.03) and acceleration time of the pulmonary flow trace/right ventricular ejection time ratio was lower (p = 0.029) in the patient group in accordance with increased pulmonary arterial pressure (Table 1).
Comparison of demographic and conventional echocardiographic parameters related to ventricular systolic and diastolic function between groups.
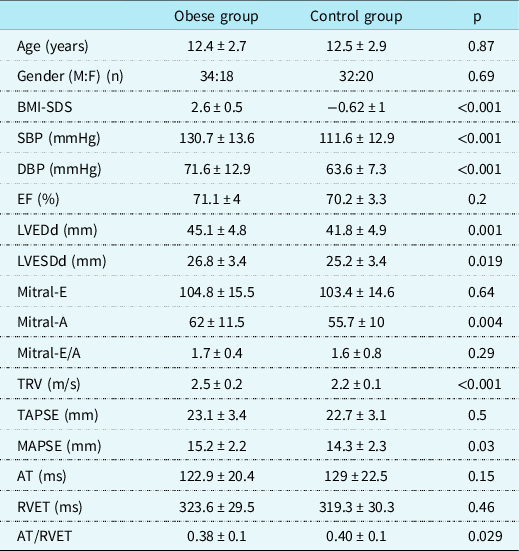
AT = acceleration time of the pulmonary flow trace; BMI = body mass index; DBP = diastolic blood pressure; EF = ejection fraction; LVEDd = left ventricular end-diastolic dimension; LVEDs = left ventricular end-systolic dimension; M:F = male:female ratio; Mitral-E = mitral early diastolic velocity; Mitral-A = mitral late diastolic velocity; MAPSE = mitral annular plane systolic excursion; RVET = right ventricular ejection time; SBP = systolic blood pressure; TRV = tricuspid regurgitation velocity; TAPSE = tricuspid annular plane systolic excursion.
Table 2 represents the comparison of the tissue Doppler imaging parameters and atrial electromechanical coupling characteristics between the groups. Unlikely conventional echocardiography, tissue Doppler imaging revealed statistically significant differences in terms of diastolic function of both ventricles. The obese group showed lower E'/A' and higher myocardial performance index levels in all three segments analysed compared to the control group. Also, obese children had significantly prolonged atrial electromechanical coupling time than controls in mitral, septal, and tricuspid segments (p < 0.001, p = 0.009 and p = 0.04, respectively). Similarly, inter- and intra-atrial conduction delay was significantly prolonged in the patient group (p < 0.001 and p = 0.003, respectively).
Comparison of the tissue Doppler imaging parameters and atrial electromechanical coupling characteristics between the obese and control groups.
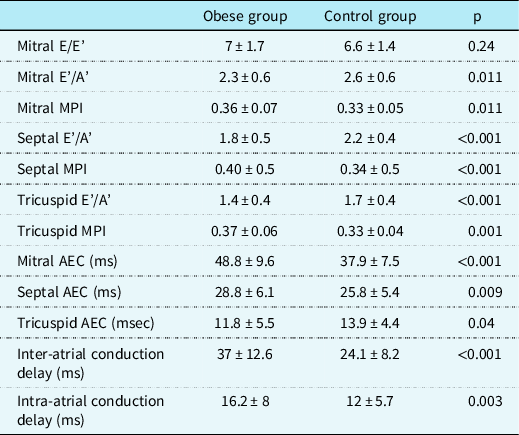
A’ = peak late diastolic velocity; AEC = atrial electromechanical coupling; E = mitral early diastolic velocity by pulsed-wave Doppler; E’ = peak early diastolic velocity; MPI = myocardial performance index.
Comparisons of the exercise stress test data among obese and healthy subjects are summarised in Table 3. While chronotropic index did not differ between two groups, heart rate reserve, maximal metabolic equivalents attained during the exercise stress test, and exercise time of obese children were significantly lower in obese children compared to healthy control group (p < 0.001). Heart rate recovery indices at 1st and 2nd minutes of recovery phase in the obese group were significantly lower than those of the healthy control group (23.6 ± 9.9 versus 34.5 ± 16, p < 0.001 and 45 ± 10.6 versus 51 ± 16.4, p = 0.03, respectively). Heart rate recovery indices at 3rd and 5th minutes were also lower in obese subjects compared to the control group, without statistical significance (p > 0.05).
Comparison of exercise stress test derived variables between the obese and control groups.
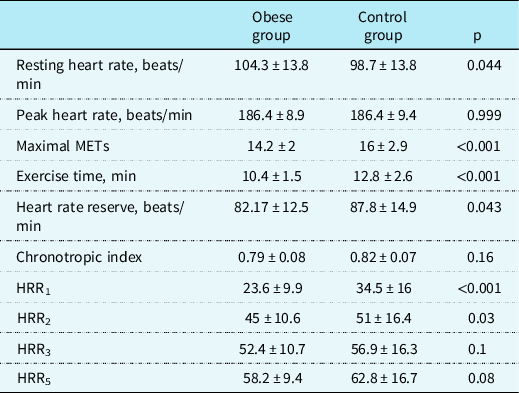
HRR = heart rate recovery index; METs = metabolic equivalents (1 MET = 3.5 ml/kg per min of oxygen consumption).
Correlation analyses of body mass index-SDS with atrial conduction time and exercise testing variables are shown in Table 4. In the study group, there was a positive correlation between body mass index-SDS and intra- and inter-atrial conduction times. We also showed a negative correlation between body mass index-SDS and heart rate recovery indices at the 1st and 2nd minutes of the recovery phase of treadmill exercise testing.
Correlation of BMI-SDS with atrial conduction time and exercise testing variables.
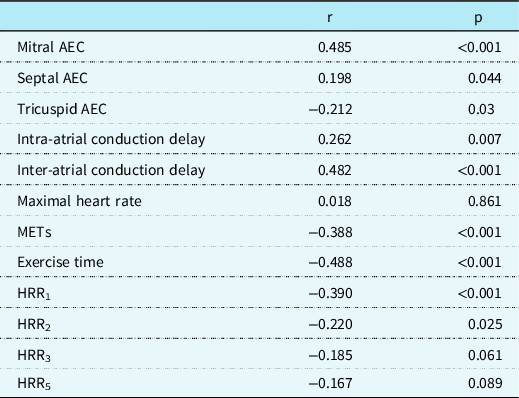
AEC = atrial electromechanical coupling; HRR = heart rate recovery index; METs = metabolic equivalents; R = correlation coefficient.
Discussion
This study demonstrated that childhood obesity has a significant impact on ventricular function and remodelling, atrial conduction, heart rate response, and autonomic properties of the heart. In addition to significant differences in systolic and diastolic function parameters and atrial electromechanical coupling obtained by tissue Doppler imaging examinations, we demonstrated lower heart rate recovery indices by exercise testing in obese children compared to healthy controls. Also, obese children had significantly higher systolic and diastolic blood pressure values compared to controls in the present study.
Recent studies have shown that obese people have an enhanced risk of developing atrial fibrillation. El-Assaad et al. Reference El-Assaad, Al-Kindi, v. and Aziz19 analysed 1500 paediatric cases and showed that the risk of isolated atrial fibrillation was higher with obesity and increasing age. They conclude that obesity alone was also a risk factor compared with normal body mass index. Similarly, Frost et al. Reference Frost, Hune and Vestergaard20 reported that obesity is associated with an increased risk of atrial fibrillation or atrial flutter diagnosis in adults. Another study showed that overweight and obese young men had more than twice the risk of atrial fibrillation compared with young men of normal weight. Reference Schmidt, Bøtker, Pedersen and Sørensen21 The possible association between obesity and enhanced risk of atrial fibrillation is attributed to impaired atrial conduction. It is primarily caused by structural and electrical remodelling of the heart in these people. Briefly, increased heart work and systemic hypertension in obese people lead to thickened left ventricular myocardium, diastolic dysfunction, and left atrial enlargement. Activation of the sympathetic nervous system and renin angiotensin system leads to increased inflammatory process. Changes in atrial size and fibrosis may cause dispersion of refractoriness and alterations in atrial conduction. Reference Sommer and Twig5,Reference Temiz, Güneş and Güneş9,Reference Elsherbiny22,Reference Avci, Gulmez, Donmez and Pehlivanoglu23 This can result in arrhythmias, particularly atrial fibrillation. Reference Elsherbiny22,Reference Avci, Gulmez, Donmez and Pehlivanoglu23
Atrial conduction characteristics can be evaluated by both invasive (recordings of atrial conduction during electrophysiologic study) and non-invasive indices of atrial conduction (P-wave dispersion on electrocardiogram and atrial electromechanical coupling measurement by echocardiography). Reference Chao, Sung and Wang24,Reference Dilaveris and Gialafos25 These are considered to reflect atrial remodelling and are predictive of atrial fibrillation. Reference Reilly and Kelly26 In this study, we compared the duration of atrial electromechanical coupling in obese children and non-obese healthy control subjects. It was significantly prolonged in obese children in all three cardiac segments we evaluated indicating impaired intra- and inter-atrial conduction. Similar findings consistent with diastolic dysfunction and atrial conduction disturbances have been reported in adult patients with obesity, non-alcoholic fatty liver disease, and systemic hypertension. Reference Ozveren, Izgi and Eroglu7,Reference Elsherbiny22,Reference Avci, Gulmez, Donmez and Pehlivanoglu23,Reference Yagmur, Cansel and Acikgoz27 In the single study conducted in obese children, Temiz et al. Reference Temiz, Güneş and Güneş9 showed significant prolongation in mitral and septal atrial electromechanical coupling. In agreement with our study, they showed that intra-atrial and inter-atrial conduction delay was significantly prolonged in the obese group. Also, inter- and intra-atrial electromechanical coupling was positively correlated with body mass index values.
The autonomic nervous system plays a central role in the regulation of cardiovascular function. The increase in heart rate during exercise is thought to be due to activation of the sympathetic nervous system and simultaneous suppression of the parasympathetic nervous system. On the other hand, the decrease in heart rate immediately after exercise is thought to be due to parasympathetic reactivation with sympathetic withdrawal. Reference Imai, Sato and Hori28,Reference Vivekananthan, Blackstone, Pothier and Lauer29 Abnormal cardiac chronotropic response during exercise test is associated with an increased risk of adverse cardiovascular events, and it has been reported in obese adult patients. Reference Franssen, Keytsman and Marinus30 In our study, obese children showed significantly higher resting heart rate and lower heart rate reserve during exercise testing compared to the control group. Although the chronotropic index was lower in the obese group than in healthy controls, it did not reach statistical significance. However, there are concerns regarding the applicability in the paediatric age group and cut-off level (accepted as ≥ 0.8 in adults) of the formula defined in the adult population for the calculation of the chronotropic index. Reference von Scheidt, Meier and Krämer13
Imai et al. Reference Imai, Sato and Hori28 showed that heart rate recovery was rapid in athletes but was blunted in patients with heart failure and was completely abolished by the administration of atropine. Cole et al. Reference Cole, Blackstone, Pashkow, Snader and Lauer12 stated that a low value for heart rate recovery after exercise testing was a powerful and independent predictor of cardiovascular and all-cause mortality. This marker is simple to calculate from data that are already contained in the results of standard exercise tests and may be valuable for the assessment of risk in routine clinical practice. Özveren et al. Reference Ozveren, Dogdu and Sengul31 reported that heart rate recovery index was deteriorated in adult patients with non-alcoholic fatty liver disease, and this may help explain the increased prevalence of cardiac death. Similarly, we found significantly lower values of heart rate recovery indices at 1st and 2nd minutes of recovery phase in obese children compared to controls (p < 0.00 and p = 0.003, respectively). Metabolic equivalents and exercise duration were also significantly lower in obese children. Although these findings are consistent with adult patients, heart rate recovery indices have not previously been evaluated in obese children.
The current study has some limitations. First, we conducted our study with a relatively small numbers of patients, which may have affected the power of the study. Second, since the design of the study was cross-sectional, patients could not be followed up for long-term atrial fibrillation development. Finally, although all echocardiographic measurements were performed by a single experienced physician, inter-observer variability was not assessed.
In conclusion, obesity is associated with significant ischemic and non-ischemic cardiovascular mortality. Childhood obesity tends to persist into adulthood. The current study showed that obese children have impaired diastolic function of both ventricles. They also have longer atrial conduction time, lower heart rate reserve, and heart rate recovery indices that are thought to be predictors of atrial fibrillation and sudden death. They can be evaluated by non-invasive tests, which are simple to use and may be clinically useful in identifying high-risk patients.
Acknowledgements
None.
Financial support
This research received no specific grant from any funding agency, commercial, or not-for-profit sectors.
Competing interests
None.
Ethical standards
The authors assert that all procedures contributing to this work comply with the ethical standards of the relevant national guidelines on human experimentation and with the Helsinki Declaration of 1975, as revised in 2008, and have been approved by the Hospital Ethics Committee.



