Introduction
Habitat loss/fragmentation and infectious diseases are both viewed as major global threats to wildlife conservation. Habitat loss/fragmentation is currently the most important cause of extinction among terrestrial vertebrates (MEA, 2005: 45), and the conservation risks posed by infectious diseases are significant and increasing (MEA, 2005). Daszak et al. (Reference Daszak, Cunningham and Hyatt2000) suggest the introduction of pathogens may achieve a status similar to invasive species, the second most important cause of extinction next to habitat loss. As habitat fragmentation and diseases are each important in their own right, they are also considered important joint drivers of extinction (MEA, 2005: 57; Daszak et al., Reference Daszak, Cunningham and Hyatt2000), and there is growing concern over this joint threat (MEA, 2005: 57; Daszak et al., Reference Daszak, Cunningham and Hyatt2000; Hess, Reference Hess1996; Gog et al., Reference Gog, Woodroffe and Swinton2002; McCallum and Dobson, Reference McCallum and Dobson1995, Reference McCallum and Dobson2002; Simonetti, Reference Simonetti1995).
For instance, fragmentation can increase disease risks by stressing wildlife populations, increasing animal densities in fragmented areas, and allowing greater contact with encroaching human or livestock populations that can serve as disease reservoirs (Daszak et al., Reference Daszak, Cunningham and Hyatt2000; Hess, Reference Hess1996; Gog et al., Reference Gog, Woodroffe and Swinton2002; McCallum and Dobson, Reference McCallum and Dobson1995, Reference McCallum and Dobson2002; Simonetti, Reference Simonetti1995). But managing disease problems involving endangered species on fragmented habitats may be more complicated than simply reducing the degree of fragmentation, particularly when other disease hosts are present (e.g., Hess, Reference Hess1996; Gog et al., Reference Gog, Woodroffe and Swinton2002; McCallum and Dobson, Reference McCallum and Dobson2002). To understand why, consider the alternative case of a single host. The ability of a disease to establish in a single population depends on the population's density because infectious contacts are more likely in a denser population. If a species is threatened or endangered (i.e., low numbers) or if sub-populations are isolated due to fragmentation, there may be too few infectious contacts for the disease to establish (although an endangered species on a very small area might be at the most risk; McCallum and Dobson, Reference McCallum and Dobson2002).
The outlook is potentially quite different, however, when a host reservoir is also present. McCallum and Dobson (Reference McCallum and Dobson2002: 2042) define a host reservoir as a species ‘in which the pathogen is maintained with a less detrimental impact than that on the “target” endangered host species . . . so that the force of infection can be maintained on the endangered host species as its density declines towards extinction’. In other words, diseases in a multiple-host species–pathogen system involving a reservoir host can more easily establish within the endangered population because the reservoir provides a sustained risk of exposure (McCallum and Dobson, Reference McCallum and Dobson2002; Dobson, Reference Dobson2004). Moreover, disease mortality can be very high among the non-reservoir species (McCallum and Dobson, Reference McCallum and Dobson1995, Reference McCallum and Dobson2002; Dobson, Reference Dobson2004). Fragmentation in this case may not halt infectious contacts and the disease could put an endangered species at significant risk.
Yet reducing fragmentation may also not be the answer in such cases, as there are two offsetting effects. First, reducing fragmentation can result in greater productivity of healthy members of endangered populations. In contrast, reducing fragmentation can increase the number of infectious contacts – both among endangered species and also with host reservoirs such as domestic livestock. For instance, although habitat corridors, national parks and wildlife reserves can mediate the impacts of fragmentation, many public lands are situated near livestock grazing lands or may be used for grazing themselves (Simonetti, Reference Simonetti1995). Reduced fragmentation now increases the chance of contact with livestock, which serve as a reservoir for many diseases harmful to wildlife (Simonetti, Reference Simonetti1995; Gaydos and Gildardi, Reference Gaydos, Gildardi and Hooper2004; Peterson et al., Reference Peterson, Grant and Davis1991; McCallum and Dobson, Reference McCallum and Dobson1995, Reference McCallum and Dobson2002). Examples of livestock reservoirs infecting threatened and endangered species include the Rinderpest virus which has spread from Zebu cattle to Serengeti wildebeest and cape buffalos (McCallum and Dobson, Reference McCallum and Dobson1995; Plowright, Reference Plowright1982), the tapeworm Cysticercus tenuicollis which infects Andean deer in Chile, and several viruses (rabies, canine parvovirus, canine adenovirus, and canine distemper virus) which spread from domestic dogs to the endangered Ethiopian wolf (Laurenson et al., Reference Laurenson, Sillero-Zubiri, Thompson, Shiferaw, Thirgood and Malcolm1998; see Hess (Reference Hess1996) and Gog et al. (Reference Gog, Woodroffe and Swinton2002) for additional examples).
These examples all come from low income countries. Habitat fragmentation and disease threats, though they exist globally, can be negatively correlated with economic development (Ceballos et al., Reference Ceballos, Ehrlich, Soberon, Salazar and Fay2005). This is, at least in part, because the developing world contains a major share of global biodiversity (ReNED, 2005) – terrestrial species are at most risk in high-density, moderately converted tropical biomes (MEA, 2005: 45), which tend to be located in developing regions. Moreover, conservation resources and legislation are lacking in many developing nations – including measures to encourage the identification and control of diseases in domestic animals (ReNED, 2005; Ceballos et al., Reference Ceballos, Ehrlich, Soberon, Salazar and Fay2005).
Managing disease problems in the context of fragmentation and a host reservoir requires an understanding of both ecology and economics. This is because both economic and ecological tradeoffs arise in response to the various ecological investment options that could improve the situation, and because the incentives facing private landowners and ranchers may differ from those of a conservation authority. This latter point is particularly important because the risks of transmission between domestic and wild animals imply that private conservation efforts matter for success (Povilitis, Reference Povilitis1998; Simonetti, Reference Simonetti1995). The role of economics as applied to wildlife disease risk, given conservation and habitat fragmentation, has been under-explored.
This paper investigates how payments for environmental services (PES) to private landowners and ranchers for the provision of various risk-reducing ecological investments can be used to address the joint problem of wildlife habitat fragmentation and disease risks. PES have been applied to each of these problems separately. For instance, the Wildlife Conservation Lease (WCL) Program has paid landowners to provide corridors in the Kitengela plains to the south of Nairobi National Park (Gichohi, Reference Gichohi2003). Similarly, PES have also been used to help construct the Mesoamerica Biological Corridor (MBC), an effort spanning eight countries from Mexico to Panama (Kaiser, Reference Kaiser2001; Ewing, Reference Ewing2005). Other networks that use PES are under construction from the Yukon to Argentina, and in Brazil, Australia, Europe, and other locations (Kaiser, Reference Kaiser2001). Payment programs have also been used to fund many livestock vaccination programs in the developing world, although with conservation being less of a concern than rural development and food security (Langa, Reference Langa, Alders and Spradbrow2001; Preslar, Reference Preslar1999; VSF, 2006). One example is the International Lookout for Infectious Animal Disease (ILIAD) program, run by the Federation of American Scientists’ Animal Health/Emerging Animal Diseases (AHEAD) project in sub-Saharan Africa. ILIAD focuses on communities located proximate to game reserves and national wildlife parks to confront diseases shared by wild and domestic animals, so as to aid rural communities and promote species preservation (Preslar, Reference Preslar1999).
Our analysis highlights the joint determination of economic and wildlife disease systems (see also Horan and Wolf, Reference Horan and Wolf2005), as disease risks – as with other ecological risks – are to some extent an endogenous function of human economic choices (Shogren and Crocker, Reference Shogren and Crocker1991; Crocker and Tschirhart, Reference Crocker and Tschirhart1992). We also expand recent work on invasive species management and emphasize the benefits of allocating some PES for preventing new infections (i.e., livestock vaccination) in lieu of investing it in in situ disease control or in habitat quality as a means of increasing species productivity (Leung et al., Reference Leung, Lodge, Finoff, Shogren, Lewis and Lamberti2002; Finoff et al., Reference Finoff, Shogren, Leung and Lodge2005; Horan and Lupi, Reference Horan and Lupi2005a,Reference Horan and Lupib). Earlier meta-population models (Hess, Reference Hess1996; McCallum and Dobson, Reference McCallum and Dobson2002) indicated that investing solely in habitat connectivity can eventually increase disease risks. To counteract this risk, we find that re-allocating PES funds towards vaccination and reduced livestock movement becomes optimal after some degree of connectivity is achieved. No blanket subsidy toward either habitat, vaccination, or livestock movement would work as well as the sequential portfolio approach of targeting habitat first, followed by vaccination and reduced livestock movement. The result is increased wildlife abundance, increased livestock health and abundance, and increased development opportunities. Bringing such an analysis to bear on endangered species facing livestock disease mortality risks in developing countries may provide useful insights to decision makers and funding agencies in a particular locale.
We begin with a brief review of the ecological and economic literature on management. We then exemplify the class of problems that motivates how we construct our bioeconomic model – endangered Andean deer in Chile. Next, we present a bioeconomic model and a numerical example based on the ecological model by McCallum and Dobson (Reference McCallum and Dobson2002). The final section concludes.
Review of management options and the ecological and economic literature
The majority of prior disease management research has not addressed the issues of habitat fragmentation; rather this work has examined alternative situations in which wildlife are the host reservoir, and livestock or human populations are at risk of infection (Daszak et al., Reference Daszak, Cunningham and Hyatt2000; Heesterbeek and Roberts, Reference Heesterbeek, Roberts, Grenfell and Dobson1995; Roberts and Heesterbeek, Reference Roberts and Heesterbeek2003; Bicknell et al., Reference Bicknell, Wilen and Howitt1999; Horan and Wolf, Reference Horan and Wolf2005; Fenichel and Horan, Reference Fenichel and Horan2007; Barlow, Reference Barlow1991). Wildlife in this situation (e.g., deer, badgers, possums) usually are not endangered and do not experience significant disease mortality. Livestock, however, are highly susceptible and face significant mortality or productivity loss.
When livestock populations are infected with diseases bearing sufficient production costs, there are both public and private incentives to implement on-farm control strategies. Vaccination is sometimes used, but it does not always occur because of vaccine unavailability or ineffectiveness, high cost – particularly in low-income countries (VSF, 2006; Preslar, 2005) – or the risk of trade sanctions (e.g., foot and mouth disease discussed in USDA-APHIS, 2002).Footnote 1 For many diseases, the primary livestock-related strategies involve quarantines and culling infected livestock herds, as this can quickly stop additional spread. The situation may differ, however, for a livestock reservoir infecting endangered wildlife. Now few (if any) market-based private incentives exist to address problems in which livestock are primarily a reservoir that suffers little disease mortality and productivity loss (which can be the case for reservoir populations). This is the type of example we consider herein. Of course, PES could also be applied to problems in which wildlife is the reservoir affecting livestock. Here conservation may be less of an issue, and so payments based solely on environmental benefits (as opposed to rural development benefits) might be comparatively small.
In the case of a livestock reservoir, vaccination of livestock (when available) may now make more sense than culling. The strategy of culling reservoir livestock populations may not transfer well to low-income countries because of the costs this can impose on ranchers in the absence of government indemnities. Even in developed countries, compensation for mandatory culling of livestock typically does not cover all of the private costs of depopulation (e.g., business interruption until facilities can be repopulated), potentially creating an obstacle to early reporting of infection (Gramig et al., Reference Gramig, Barnett, Skees, Black, Koontz, Hoag and Thilmany2006). While developed country farmers may be most concerned about uncompensated losses in the event of mandatory culling, the ongoing global response to highly pathogenic avian influenza suggests that developing country farmers are receiving less than market value. Moreover, obstacles to early reporting may be exacerbated when vouchers issued for government compensation payments are perceived as incredible (McNeil, Reference McNeil2006). In contrast, vaccination may now make sense because their use would not induce trade sanctions if the market is otherwise unresponsive to the disease. Moreover, many low-income countries already face sanctions on livestock-sector exports due to other disease problems having greater market impacts (e.g., Perry et al., Reference Perry, Pratt, Stones and Stevens2005). In the absence of significant disease-related productivity losses, the public sector may have to create or administer the needed incentives for a vaccination program.
Now consider wildlife interventions. Vaccination of wildlife populations is seldom applied because vaccines are unavailable or ineffective for many diseases (Smith and Cheeseman, Reference Smith and Cheeseman2002). Even when an effective vaccine does exist, vaccination of threatened and endangered species remains controversial; controversy due in part to the extinction of a study population of Serengeti wild dogs following management interventions that used vaccination (Burrows, Reference Burrows1992; Burrows et al., Reference Burrows, Hofer and East1994). Rather for the case of non-threatened species, the primary wildlife interventions include culling the wildlife host population (e.g., Roberts and Heesterbeek, Reference Roberts and Heesterbeek2003; Smith and Cheeseman, Reference Smith and Cheeseman2002) and reducing effective habitat areas (Hickling, Reference Hickling2002; Horan and Wolf, Reference Horan and Wolf2005; Fenichel and Horan, Reference Fenichel and Horan2007) to reduce density and infectious contacts. Reducing the density of an endangered population (via culling or translocation) to reduce potential infectious contacts may only put the population at greater risk. Culling is therefore not considered a viable intervention in the present case. Changes in habitat availability, in contrast, may have multiple, opposing effects.
The joint issue of habitat fragmentation and disease has only been addressed by a few ecological studies (Hess, Reference Hess1996; Gog et al., Reference Gog, Woodroffe and Swinton2002; McCallum and Dobson, Reference McCallum and Dobson2002), and only McCallum and Dobson (Reference McCallum and Dobson2002) consider the impacts of a reservoir host. On the one hand, greater habitat area or reduced habitat fragmentation can increase disease risks for endangered species, to the extent that there is a concomitant increase in infectious contacts between and within endangered species and a reservoir host (Hess, Reference Hess1996; McCallum and Dobson, Reference McCallum and Dobson2002).Footnote 2 But there is an opposing effect to counteract increased infectious contacts. McCallum and Dobson (Reference McCallum and Dobson2002) find that reducing habitat fragmentation (or increasing habitat connectedness) can increase re-colonization of extinct patches by healthy animals. They show that some degree of increased habitat connectedness could simultaneously improve a species’ chances for survival and increase the proportion of healthy animals within the population.
The parameters of McCallum and Dobson's (2002) model define the circumstances under which increased connectedness is beneficial. They investigate various combinations of fixed parameter values and illustrate why three parameters are critical: (i) the colonization rate of endangered species relative to reservoir hosts (livestock in our model), (ii) the rate of infectious contacts between livestock and wildlife, and (iii) the rate of recovery from infection (to an immune or recovered state) within the livestock population. But these and other parameters are not fixed in reality – investments can be made to affect many parameter values, thereby altering the benefits of increased habitat connectedness. This holds with particular force when domestic animals are part of the ecological system. For instance, management of livestock movement affects the relative rate of re-colonization, biosecurity efforts reduce infectious contacts, and livestock health management prevents infection and improves recovery rates. Farmers are unlikely to make any of these investments at socially efficient levels because doing so is costly and they do not capture the full social benefits. Effective conservation may therefore require the public provision of incentives for these investments, such as PES.Footnote 3 As provisioning payments to farmers requires re-allocating public (and sometimes private for international conservation aid) funds away from other public good uses (e.g., public health, education), efficient conservation requires the PES to be allocated to align with the relevant economic and ecological tradeoffs.
Motivating example – endangered Andean deer in Chile
The Andean deer (Hippocamelus bisulcus), known commonly as huemul in South America, is a cultural symbol of Chile, appearing on its national coat-of-arms alongside the threatened Andean condor (Vultur gryphus). There is widespread interest in preserving and restoring the species in Chile. Predation, habitat degradation, low reproductive rates, a fragmented population, and the integrity of the population (viability requires some level of interchange of individuals between groups of animals over time, including re-colonization of unoccupied sites) are cited as reasons for the decline in the Chilean population (Povilitis, Reference Povilitis1998). Huemul is found in greatest abundance (about 1,500 individuals) in Argentinian Patagonia (Povilitis, Reference Povilitis1983; Smith-Fleuck and Fleuck, Reference Smith-Fleuck, Fleuck, Bissonette and Krausman1995). The northern part of the species’ historic range has been reduced to a confined area of Central Chile called Nevados de Chillán and was estimated to have a population of about 60 individuals in 1997 (Povilitis, Reference Povilitis1998).
Connectivity of habitats and disease risks are both areas of concern for Andean deer conservation. Huemul (and deer in general) are susceptible to Cysticercus tenuicollis, a bladderworm that is the larval stage of the canine and feline tapeworm Taenia hydatigena. C. tenuicollis is a common parasite of deer and other ruminant species (Pybus, Reference Pybus1990; Michigan DNR, 2002), and has been identified as a source of mortality for huemul (Texera, Reference Texera1974; Simonetti, Reference Simonetti1995; Povilitis, Reference Povilitis1998). C. tenuicollis, along with habitat fragmentation, is viewed as a major obstacle to population recovery (Simonetti, Reference Simonetti1995; McCallum and Dobson, Reference McCallum and Dobson2002; Povilitis, Reference Povilitis1998). Experts are concerned with the cross-species transmission of C. tenuicollis to huemul from livestock (or other infected wildlife). Free-ranging domestic cattle and goats are known carriers of C. tenuicollis and several other pathogens that can be transmitted to huemul (Povilitis, Reference Povilitis1998).
Earlier analysis of management actions aimed at conserving the huemul and work toward recovery of the species throughout its historic range has highlighted four main areas: (i) protecting core habitat areas as strict reserves, (ii) establishing habitat connectivity, (iii) implementing conservation management plans on private lands, and (iv) taking measures to augment the population. Huemul range beyond the reserves, where poaching, infectious contacts with livestock, and habitat degradation are entirely eliminated; therefore private actions must be taken on livestock grazing lands for species conservation (Simonetti, Reference Simonetti1995; Povilitis, Reference Povilitis1998). Livestock health measures, the mobility of livestock, and habitat investments on grazing lands appear to be key factors for Chilean officials or international donor agencies funding a conservation initiative to consider in allocating financial and management resources.
A bioeconomic model of livestock health management and wildlife mobility can be a helpful tool to examine resource allocation when the presence of endangered wildlife has social benefits and conservation funds are in short supply. Our bioeconomic model herein focuses on habitat fragmentation and disease causes of population decline in the species. The biological component of our model uses a metapopulation model to examine the issue of habitat fragmentation, like that present in the Nevados de Chillán area. Meta-population models are increasingly used to explore the ecological implications of increasing habitat connectivity (i.e., mobility as a model parameter), particularly in disease settings (e.g., Hess, Reference Hess1996; Gog et al., Reference Gog, Woodroffe and Swinton2002; McCallum and Dobson, Reference McCallum and Dobson2002). We expand the set of management options to include vaccination for cases in which livestock health management is a mortality risk factor for an endangered species. Research suggests that vaccination is an effective direct preventive measure against C. tenuicollis in livestock (Wikerhauser et al., Reference Wikerhauser, Žuković and Džakula1971; Babiker and Eldin, Reference Babiker and Eldin1987); and an effective indirect tool to protect the huemul that come into contact with livestock in grazing areas where the pathogen can be transmitted.
The ecological model
Our model to investigate the disease-habitat fragmentation problem is motivated by the problem of C. tenuicollis in Andean deer. We adopt a slight variation of the metapopulation model used by McCallum and Dobson (Reference McCallum and Dobson2002).Footnote 4 The model provides a qualitative representation of the situation, designed to produce insight into the problem. McCallum and Dobson take a similar approach – their model is also motivated by this problem and they use a hypothetical simulation to address the relevant issues. Assume there are N available patches, which are identical in terms of species’ carrying capacities and distances from each other.Footnote 5 Each patch may be in one of seven states at time t
(i) Empty (no wildlife or livestock present). The number of patches in this state is e.
(ii) Occupied only by susceptible livestock; the number of patches is s L.
(iii) Occupied only by susceptible wildlife; the number of patches is s W.
(iv) Occupied only by susceptible livestock and wildlife; the number of patches is s LW.
(v) Occupied only by resistant or immune livestock; the number of patches is r.
(vi) Occupied only by resistant livestock and susceptible wildlife; the number of patches is r W.
(vii) Occupied only by infected livestock (assume any infected wildlife within a patch immediately go extinct); the number of patches is i.
Note there are no patches containing resistant wildlife. This is because wildlife never recover from infection to become resistant. We also assume vaccination of wildlife is either unavailable or infeasible, which is common for many wildlife disease problems.
First consider factors influencing the status of livestock patches – susceptible (s), resistant (r), or infected (i). Following McCallum and Dobson (Reference McCallum and Dobson2002) and Hess (Reference Hess1996), the rates of extinction of patches for the various classes of livestock are denoted x s, x r, and x i, with all rates being non-negative and x i > x s, x r. The term ‘extinction’ when made in reference to a livestock patch does not refer to a local biological extinction in the same sense as an endangered species; rather, it means the removal of livestock from one patch without relocation into another patch within the region. This would occur when a herd is either culled or sold. Migration of livestock across patches occurs at a rate m L. If susceptible livestock enter an empty patch, that patch switches to susceptible livestock status. If infected livestock enter a patch of susceptible livestock, that patch has a probability δ of becoming infected. Resistant livestock entering a patch do not affect the patch status and neither do infected livestock entering a resistant patch. Infected patches recover to a resistant state at a rate γ. Finally, susceptible livestock become resistant (e.g., due to vaccination) at a rate ψ, and resistant patches revert back to susceptible status (as resistance is lost) at a decay rate λ.
Now consider wildlife. Endangered species become extinct on any patch at a rate x W. They immediately become extinct on a patch if the livestock on their patch becomes infected or if an infected immigrant arrives. The migration rate of endangered species is m W. McCallum and Dobson (Reference McCallum and Dobson2002) refer to m W as a measure of wildlife habitat connectedness, or an inverse measure of wildlife habitat fragmentation. For example, m W is large for large contiguous reserves and small for fragmented patches.
The metapopulation dynamics of patches of susceptible livestock is given by the equation of motion

The first right-hand side (RHS) term represents the colonization of empty patches by livestock migrants of other susceptible patches (i.e., it equals the migration rate of livestock, times the number of patches containing susceptible and resistant livestock, times the probability that these animals colonize empty patches). The second RHS term reflects extinction of susceptible livestock patches (e.g., due to sales). The third term is the number of susceptible livestock patches that become infected. The fourth term is the number of susceptible patches that become resistant due to vaccination, and the fifth term reflects the loss of resistance. The sixth term is the number of susceptible livestock patches that become susceptible patches containing both species (i.e., it equals the migration rate of wildlife, times the number of patches containing wildlife, times the probability that these wildlife move on to patches of type L). Finally, the seventh term reflects switching of LW-type patches to L-type patches due to local extinctions of wildlife within those patches.
Following McCallum and Dobson (Reference McCallum and Dobson2002), we scale the model to focus on the proportions of each patch type (as opposed to absolute numbers). We do this by dividing all state variables by N. We also redefine time in units of x s, and all rate parameters (except the infection rate δ) in units of x s. All scaled variables and parameters are denoted by upper-case symbols (except time, t, which is denoted by τ = xst). Given these modifications, equation (1) is re-written as

where E = 1 − (S L + S W + S LW + R + R W + I).
We define the equations of motion for the other state variables in a similar manner





Incorporating economic choices
The model so far is similar to McCallum and Dobson (Reference McCallum and Dobson2002), except we allow for preventative veterinary medicine (vaccination) to generate resistance within susceptible livestock.Footnote 6 We further depart from McCallum and Dobson's model by allowing wildlife and livestock habitat connectedness, M W and M L (again, measures of outward migration from a patch), to be endogenously affected by habitat management choices. Landowners make investments in habitat connectivity and ranchers make investments in livestock vaccination, although these two groups could overlap. For ease of notation and without loss for the present stylized model, assume all landowners are ranchers. Assume the existence of a representative rancher in each patch, and that ranchers are homogeneous across patches (at least, in the absence of any patch-specific subsidies that might be applied to them).
Denote the level of vaccination within a type k patch (k = L, LW) by Ψk. This is strictly a preventative measure. Vaccination does not directly affect the in situ productivity of the endangered species population, but it does provide indirect benefits by reducing disease propagule pressure. Vaccination costs in each patch at time τ are given by c(Ψ), which are increasing and convex in the level of vaccination, with c(0) = 0. For ease of exposition, assume these costs are ranchers’ net cost of vaccination (i.e., actual vaccination costs less than the private benefits of vaccination), although it would make little difference to instead assume these were veterinarians’ costs of administering vaccines.Footnote 7 Assume ranchers find it privately optimal to invest nothing in vaccination unless publicly provided incentives exist (i.e., c′(0) = 0) because they do not otherwise internalize any positive net benefits from vaccination. Many ranchers in poor areas cannot afford vaccination given other more pressing needs (Preslar, Reference Preslar1999; VSF, 2006; Langa, Reference Langa, Alders and Spradbrow2001).
Denote patch-specific investments in increased wildlife habitat connectedness by ZWk (k = S W, S LW, R W), so migration becomes patch-specific: M W,k = M W0 + ZWk, where M W0 is the pre-investment level of migration. Wildlife habitat connectivity investments establish corridors that connect patches of ideal habitat for the target species. In practice, this may involve agreeing not to fence, quarry, subdivide, or use slash-and-burn agriculture, and to manage the land for wildlife and sustainable livestock grazing (Gichohi, Reference Gichohi2003; Kaiser, Reference Kaiser2001). We allow habitat connectivity investments to be targeted to facilitate certain types of desired wildlife migrations, as will be determined by the bioeconomic model. Habitat connectedness has direct effects on endangered species conservation – greater connectivity increases the growth of endangered species populations, although it might also allow for greater disease spread. Our model allows us to capture this critical endogenous tradeoff.
We also consider investments in livestock connectivity. Specifically, we consider investments that reduce migrations out of infected patches, as this is the only source of infectious contacts in the model. Denote the patch-specific decrease in habitat connectedness for infected livestock by Z LI, so that M L,I = M L0 − Z LI, where M L0 is the pre-investment level of migration. This decreased connectedness is costly. For instance, since livestock in close proximity to Chilean parks tend to be free-ranging (Povilitis, Reference Povilitis1998), reducing mobility of infected animals would be costly – particularly if infections have little impact on livestock productivity.
Habitat connectivity costs are denoted by g i, and these are increasing in the level of changes in habitat connectivity, with g i(0) = 0. These are net costs, as constructing habitat corridors can yield some benefits such as reduced human–wildlife conflicts (Gichohi, Reference Gichohi2003) and restricting movement of infected livestock can reduce infectious contacts with susceptible herds.Footnote 8 Assume ranchers find it privately optimal to invest nothing in additional habitat connectivity (or disconnectivity, in the case of livestock) unless publicly provided incentives exist (i.e., c′(0) = g′i(0) = 0). Given these specifications for habitat and vaccination costs, each rancher's total costs at time τ are given by the separable cost function, C = c(Ψ) + ∑i=M,Lg i(Z i).
A bioeconomic model
Suppose an agency (governmental or non-governmental) wants to provide monetary support for the protection of the wildlife population. The value the agency attributes to the population in any given period is U(S W + S LW) (with U′>0, U′′ < 0), which could be thought of as a combination of existence and eco-tourism values. To promote this value on private lands, the agency subsidizes habitat connectivity and livestock vaccination. The subsidy rate for the jth investment (j = Ψ, Z i) in patch k is denoted σj,ik, so that post-subsidy costs in patch k are

Minimization of (8) leads to the first-order conditions and response functions


Assume the agency is concerned with intertemporal efficiency in managing the wildlife resource and disease risks. Given a discount rate of ϕ, the agency chooses subsidy rates to solve
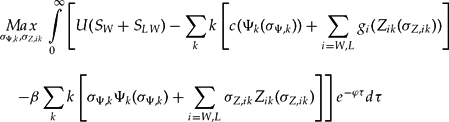
for k = S W, S LW, R W, I, subject to the equations of motion (2)–(7) and the rancher's response functions defined by (9) and (10). The term β∑kk[σΨ,kΨk(σΨ,k) + σZ,kZ k(σZ,k)] represents the social welfare impacts of the subsidy payments – this captures the opportunity cost notion that allocating more subsidies to this conservation problem implies less money is available for other conservation or public goods investments. The parameter β represents the (constant) marginal cost of diverting funds to this conservation problem, which may include transactions costs (Alston and Hurd, Reference Alston and Hurd1990).Footnote 9
The Hamiltonian associated with this problem is
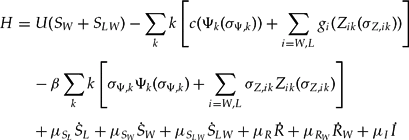
where μj represents the co-state variable associated with the jth state variable. The first-order conditions associated with an interior solution are
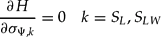

The following adjoint conditions are also necessary for an optimum

These conditions in (15) ensure no intertemporal arbitrage opportunities arise (see Clark, Reference Clark1990).
Optimal subsidies
We derive expressions for the optimal subsidy rates from the first-order conditions (9), (10), (13), and (14). For instance, consider condition (13) for k = S L

Using (9), we manipulate condition (16) to derive an expression for the optimal subsidy rate
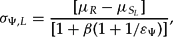
where ϵΨ is the elasticity of supply of vaccination. The optimal subsidy rate (which varies over time) is a relative price equaling the ratio of marginal external benefits of vaccination relative to the marginal external costs. The numerator is the net marginal value of an increase in vaccination in type-L patches, as vaccination converts these susceptible patches into resistant patches. Although the creation of resistant patches has no direct effects on wildlife conservation, altering patch dynamics has value as a tool to protect wildlife from disease. The net price of this service is the difference in shadow values, [μR − μS L], which should be positive since resistant patches provide greater protection than susceptible patches.
The optimal subsidy would equal the marginal benefits of disease protection provided the opportunity cost of subsidization was zero, i.e. if β = 0, the denominator would equal unity. But since the opportunity costs are positive (β > 0), this means a larger subsidy reduces the funds available for other conservation activities. The denominator of (17) reflects these additional costs at the margin, capturing how the agency acts like a monopsonist in the market for vaccination (with 1/ϵΨ representing the degree of monopsony power) and so its demand for vaccination affects the subsidy price that must be paid to producers.
The optimal subsidy for vaccinations in type-LW patches is derived in a similar manner
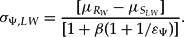
The denominators of (17) and (18) are essentially the same (although the elasticities may differ in the optimal solution if these are non-constant across regions). The primary differences in the subsidy rates lie in the numerators – the difference in the net prices of conversion (i.e., [μR W − μS LW]). Other things equal, patches having a larger net price of conversion will optimally command larger vaccination subsidies because the marginal benefits of conversion are larger. The differences in the net prices and the impact on the relative subsidy rates is ambiguous a priori.
We derive the habitat connectivity subsidies in a similar manner. For instance, using condition (14) along with condition (10), we have

where ϵZ is the elasticity of supply of habitat connectedness. This supply has a similar interpretation as the vaccination subsidies: it is the net marginal external benefit of increased connectivity divided by the marginal costs of subsidization. Specifically, the numerator represents the marginal net benefits of adding wildlife to non-infected patches (a productivity effect). For each type of possible conversion of a non-wildlife patch to one that includes wildlife, the marginal benefits are calculated as the net price of conversion, times the proportion of the associated non-wildlife patches. Note the net price of conversion should be positive since patches with wildlife should be worth more to society than patches without wildlife. The marginal benefits are small if the net price of conversion is small or if there are few healthy patches that wildlife can colonize. Finally, while we have allowed the subsidy defined by (19) to be patch-specific, we can verify that optimal habitat connectivity subsidy rates are uniform. This uniformity result holds because connectivity in the metapopulation model is defined by outward migration, and once out of one patch wildlife are free to move to any other patch.
Numerical example
The ecological component of our numerical example is based on the example in McCallum and Dobson (Reference McCallum and Dobson2002), which allows us to compare directly our bioeconomic results with the ecological-only model. Their numerical example is based on a series of equilibrium equations identical to steady state versions of our equations (2)–(7), except that (i) Ψk = Z ik = 0 in their model, and (ii) they specify the following proportional relation between the connectivity parameters M L and M W: M W = M ςM L, where M ς is a scaling parameter.Footnote 10
We also use a scaling parameter for connectivity in our model, but only for the initial value of wildlife connectivity: M W0 = M ςM L. In our model, investments in Z result in a decoupling of M L and M W from the proportionality constant, so M L and M W are no longer proportional. This means wildlife take advantage of greater connectivity and ranchers do not, even though opportunities may exist for ranchers to do so. Subsidies for increased habitat connectivity can therefore be viewed as having a secondary impact of effectively reducing livestock connectivity, at least to some extent.
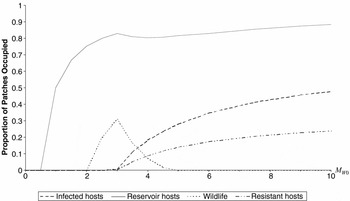
McCallum and Dobson (Reference McCallum and Dobson2002) investigate four scenarios, although we focus on their scenario a as that scenario best illustrates a case in which an endangered species can survive with only moderate connectivity.Footnote 11Figure 1 presents our derivation of their results (using their parameter values), with no investments in connectivity and with no vaccination. The figure illustrates equilibrium outcomes for different values of M W = M W0. No disease outbreak occurs under conditions of low connectivity because there are too few infectious contacts with the disease reservoir to support spread of the disease. The endangered species goes extinct, however, because habitat fragmentation makes it problematical for the species to re-colonize extinct patches.
McCallum and Dobson's ecological scenario a
Parameter values: δ = 0.8, Xi = 4.0, Xr = 1.0, XW = 2.0, Mς = 0.5, Γ = 1.0, Λ = 2.0. Reservoir hosts are defined as all patches including livestock. Wildlife is defined as all patches including wildlife. Resistant hosts include all patches with resistant livestock.

The endangered species, however, also goes extinct under conditions of high connectivity. The reason is that high connectivity leads to more infectious contacts with the reservoir species, creating significant disease pressures on the endangered species. With the disease causing high mortality among the endangered species and without the endangered species being able to re-colonize extinct patches quickly relative to livestock (as M W is smaller than M L), the result is extinction of the endangered species. Only under intermediate/moderate levels of connectivity, when the proportion of infected patches is small, can the endangered species survive.
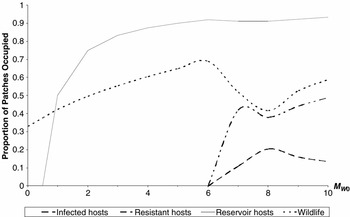
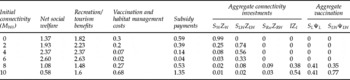
Now consider our bioeconomic model. The economic components of the model are specified to conduct a numerical analysis. All cost functions take on constant elasticity forms: vaccination costs in patch k are defined as c k = ψηk, and habitat connectivity costs in patch k are defined as g ik = z ξik, where η and ξ are elasticities. Dividing the choice variables by x s, as in the ecological model, these cost functions become c k = αcΨηk and g ik = αgZ ξik, where αc = x ηs and αg = x ξs. Existence/tourism values also take a constant elasticity form, U = (s W + s LW)κ =αu(S W + S LW)κ, where αu = N κ and κ is an elasticity. Unlike the ecological model, the economic model is not dimensionless – the values of N and x s matter. The numerical model is fully specified by assigning values to these parameters and the elasticities η, ξ, and κ, the marginal cost term β, and the discount rate, r (see figure 2 for values). Now it is possible to numerically explore steady state solutions for the necessary conditions (2)–(7) and (13)–(15). Figures 2 and 3 and table 1 present the equilibrium results.
Bioeconomic results
Parameter values: η = 2, ξ = 2, κ = 0.5, β = 0.25, xs = 0.1, N = 10.0, ϕ = 0.05, all other parameters as in figure 1.


Equilibrium outcomes for welfare measures and rancher investment choices

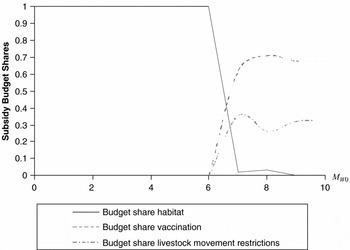
Comparison of the bioeconomic results (figure 2) with the ecological-only results (figure 1) illustrates the impacts of economic investments on ecological outcomes.Footnote 12 The most obvious results are twofold: (a) the endangered species is now prevalent for all values of initial connectivity, M W0, and (b) the disease first emerges at significantly larger values of connectivity. Investments in wildlife habitat connectivity enable the endangered species to survive at lower values of M W0. At low values of M W0, table 1 and figure 3 illustrate that subsidies are optimally targeted at increasing wildlife habitat connectivity, which enable wildlife to re-colonize extinct patches more quickly. The largest investments (in aggregate) initially occur on W-type patches, and then become larger on LW-type patches (and on RW-type patches, once a disease outbreak occurs) as these become the most prevalent type of patch that the endangered species occupies. These investments decline, however, for larger values of M W0 as the marginal benefits of additional connectivity decline.
Disease outbreaks in the bioeconomic model are delayed until M W0 > 6, compared to the threshold of M W0 = 2.5 in the ecological model (figure 1). This result arises from disinvestments in mobility of infected livestock, although this is not immediately apparent from the equilibrium results in table 1. If an infection were to emerge, a small reduction in livestock mobility would prevent the disease from becoming established in the livestock population. At the margin, the subsidy for reduced livestock mobility is available, but it is not used in equilibrium since the disease is unsustainable.
Once the disease establishes, investments are optimally made in both livestock movement restrictions and vaccination. Payments for these activities increase as M W0 increases, with a corresponding decrease in payments for wildlife habitat connectivity. Figure 3 illustrates this substitution of payment types. Vaccination and livestock immobility both increase the safety of endangered species even at high levels of connectivity by reducing the proportion of infected patches and increasing the proportion of resistant patches (compare figures 1 and 2), thereby significantly reducing infectious contacts relative to the case of no vaccination and greater livestock mobility.
Over the range of M W0 for which the disease becomes established, the connectivity in both infected and resistant patches initially increase, whereas wildlife patches decrease. Infected patches peak at M W0 = 8, beyond which infected patches decrease and resistant and wildlife patches increase. This is similar to McCallum and Dobson's (Reference McCallum and Dobson2002) scenario c; infected livestock recovered quickly, which produce a large resistant sub-population relative to the infected population. The difference here is that resistance is created through vaccination instead of recovery from infection, and spread of infection is reduced through mobility restrictions.
An interesting issue emerges in our model about the role of habitat connectivity and vaccination as prevention and control strategies against disease. Traditionally, prevention of disease involves keeping the disease away (i.e., lower chance of illness); whereas control of disease involves minimizing the damage of the disease once it is realized (see for example Leung et al., Reference Leung, Lodge, Finoff, Shogren, Lewis and Lamberti2002). This distinction fits into the self-protection and self-insurance framework created by Ehrlich and Becker (Reference Ehrlich and Becker1972) three decades ago. Prevention is self-protection; control is self-insurance. But as pointed out by Ehrlich and Becker, sometimes this distinction is rather blurry. This blur also emerges in our model with habitat connectivity and vaccination. Here prevention should imply keeping the disease out of any given patch; control should imply minimizing damages if the disease makes it to any given patch. But habitat connectivity has both effects. If the agency decides not to subsidize connectivity, there is no disease spread, which is a preventive strategy. But if they promote connectivity, the disease might spread but the damage can be mitigated because of the increased population that arises, which is a control strategy. Similarly, with vaccination, livestock is immune to a disease (which may not be an issue), which implies both prevention of its spread and control, in that the disease has no impact and dies away. For the situation we consider herein, the methods of prevention and control are intertwined, and one cannot make general claims about ‘preventive ounces’ versus ‘pounds of cure’.
Distributional and development impacts
Table 1 presents the equilibrium welfare results. Net social welfare is concave in M W0: it initially increases in M W0 as fewer investments in connectivity are necessary, then it decreases in M W0 after the disease emerges and funds are needed for livestock movement restrictions and vaccination. Conservation costs, and subsidy payments, are inversely related to these net social welfare results.
The conservation subsidies result in several development benefits to low income ranchers. First, the subsidies generate rents for ranchers so they will bear the conservation costs. These rents are double the costs incurred for the numerical example because the marginal cost function for each activity is linear and increasing in the level of the activity. The rents would be more than double if the marginal costs were increasing at an increasing rate. The rents provide ranchers with an additional source of income to help alleviate other pressing needs. For instance, the WCL program in Kitengela makes payments at the beginning of school terms to encourage education, which has worked to increase school enrollment, particularly among girls (Gichohi, Reference Gichohi2003). The rents also help poor ranchers to hold on to their land rather than selling it off to be sub-divided (Gihochi, 2003; Ewing, Reference Ewing2005).
Second, the subsidies lead to a slight increase in the total number of patches containing livestock, in combination with a smaller number of infected patches – particularly at higher levels of M W0 (compare figures 1 and 2). While we do not explicitly model any benefits associated with more livestock patches, it is reasonable to assume they would exist. Ranchers will also benefit from reduced numbers of infected stocks, with these benefits embedded in the net cost functions for vaccination. Gihochi (2003) suggests these benefits arise from the WCL Program, and these benefits provide additional incentive to discourage cultivation that would otherwise degrade wildlife habitats. Moreover, the combination of reduced cultivation and larger corridors can lead to reduced human-wildlife conflicts.
Finally, the costs of vaccines are small relative to total vaccination costs, which include labor, travel, and other operating costs (VSF, 2006; Preslar, Reference Preslar1999). This raises the possibility that the marginal costs to provide additional vaccines, and perhaps other basic veterinary services, might also be small. A vaccination program for conservation purposes may induce cross-subsidizing other vaccination or veterinary activities needed by low income ranchers.
Concluding remarks
Herein we build a stylized model to gain insight into payments for environmental services designed to protect endangered species given wildlife-livestock disease risks and habitat fragmentation. Our results show how greater connectivity of habitat creates an endogenous trade-off. More connectedness increases both (i) the chance that populations of endangered species will grow more rapidly, and (ii) the likelihood that diseases will spread more quickly. We derive a habitat connectedness subsidy based on the net marginal external benefit of increased connectivity divided by the marginal opportunity cost of subsidization. We derive similar expressions for a vaccination subsidy and a subsidy to reduce movement of infected livestock. Our results suggest the cost-effective policy is to subsidize habitat connectivity first rather than vaccinations; this increases the contiguousness of habitat, which eventually also increases disease risks. Once habitat is sufficiently connected, disease risks increase to the degree to make a vaccination subsidy and subsidies to reduce infected livestock movement worthwhile. Highly connected habitat requires nearly all the government budget be devoted to these disease-related subsidies. No blanket subsidy toward either habitat, vaccination, or livestock movement would work as well as the sequential portfolio approach of targeting habitat first, followed by vaccination and reduced livestock movement. The result of the conservation payments is significantly increased wildlife abundance, increased livestock health and abundance, and increased development opportunities.
How should such a program be implemented? First, the question of who should pay whom revolves around who has the best access to farmers to implement the strategy. Local governments have the most inherent knowledge, but could also be the most susceptible to the misallocation of funds that were targeted for conservation. If corruption is an issue, then NGOs would be the appropriate allocator of funds. The question here is whether NGOs would have the ability to monitor and enforce the PES when it was to switch from habitat to vaccination and reduced livestock movement. This switching property suggests it might take a combined effort by local governments to monitor and enforce the switch and NGOs to allocate the funds.
Second, implementation of our scheme in the real world will be restricted (as are all policies) by the ability to monitor the level of risk to wildlife. Switching from habitat to vaccination and livestock movement controls requires an object assessment of the increased risks to wildlife, such that the switching point can be roughly identified. This will require resources to construct and parameterize an integrated bioeconomic risk assessment model that works for the specific site in question. Such integrated risk assessment will be landscape-specific in many cases, which will require more resources to get the assessment up to task. Nowadays, however, the field of rapid risk assessment methods has advanced significantly and can provide new tools for more rapid assessment of wildlife risks.
We conclude by noting that our model has three caveats that limit our insight into specific issues. First, the ‘island’ metapopulation model is a restriction both for ecological relations and for the ability to target management activities. For instance, in reality one could develop corridors between specific patch types but not between others due to economic and physical constraints. This would change the basic model from an island model to another model, i.e. a ‘necklace’ model of links and chains. Second, metapopulation modeling based on the proportion of patches in various states is elegant for ecological modeling and for bioeconomic maximization because it is parsimonious in state variables. The downside, however, is it complicates management plans because we cannot keep track of individual patches. We do not know where these patches are located in space or which patch is in which category at any particular point in time. Finally, ranchers have other choices that can be included, at some loss in model parsimony. Future work should find tractable ways to relax these current restrictions on modeling disease risk between wildlife and livestock.