1. Introduction
This paper is about the willingness to pay (WTP) for an improved supply of water for domestic and irrigation use in rural areas of Rwanda. We used a choice experiment (CE) in which individual status quo (SQ) information was used to improve model fit.
Studies applying stated preferences have primarily used hypothetical baselines. This was mainly because researchers either wanted to know how respondents would react if circumstances changed and a new policy were to be introduced, simply as a matter of convenience in study design, or in order to minimize protest responses for a controversial SQ condition (Whittington and Adamowicz, Reference Whittington and Adamowicz2011). However, using hypothetical baseline conditions can confuse and spread misinformation among the studied population, and can also influence the policy process itself in unfortunate ways (Whittington, Reference Whittington2004). As discussed in Whittington and Adamowicz (Reference Whittington and Adamowicz2011), for example, using a hypothetical baseline renders the results of the valuation study less policy relevant if respondent preferences and behaviour are based on the current baseline SQ condition rather than on the hypothetical baseline.
Following this criticism, in this paper we used current information about the SQ and observed how this performed. We found that not employing individual SQ information reduced the significance of the model in both domestic and irrigation water use and, in several cases, led to downward bias in the sizes of the estimated coefficients. If the current variation in the SQ is not taken into account, the WTP is underestimated in comparison with when it is taken into account. Thus, if the variation in SQ is ignored, the erroneous policy conclusion would be that rural households’ demand for improved water provision – both for domestic water use and for irrigation purposes – is lower than it actually is, potentially contributing to continued underinvestment in the sector.
2. Background
Domestic water in rural Rwanda is supplied under several management options, with wide variations across regions with regard to the quality of water, the price of water and the distance to the nearest water point. Most rural areas are supplied either by natural water sources or (in a few cases) by regional water utilities. Less than 1 per cent of rural households have piped water to their premises (Republic of Rwanda, 2012): most households rely on other alternatives, namely public tapsFootnote 1 (30 per cent), tube wellsFootnote 2 (19 per cent), protected or unprotected springsFootnote 3 (28 per cent), surface water (10 per cent) and others (12 per cent).
The average walking time from a homestead to a drinking water source is estimated to be 29 minutes in rural areas, with disparities within and especially between different districts (Republic of Rwanda, 2010). The failure of the rural water access and delivery system reveals that financing mechanisms are not designed to allow revenues from water consumption to help cover supply costs. Thus, in order to improve water supply, most rural water consumers would need to pay more, in one way or another. Furthermore, the heterogeneity in baseline status of access to water and in socio-economic characteristics might cause variation in individual preferences for the same improved service.
Uneven distribution of irrigation water through different parts of the country, and the resulting dependence on rain-fed agriculture, has become an issue. For example, rainfall is high in the west, but low in the east. This situation explains why some households that farm during the dry season receive abundant water, while others lack sufficient water to grow crops during the same period. Thus, water availability and watering frequency differ among farmers and across regions.
Irrigation schemes in Rwanda can be classified into three broad categories: marshland irrigation (state-owned lands where farmers are allotted plots on lease and share a common, state-managed, irrigation infrastructure); hillside irrigation (characterized by pressurized systems developed on privately owned hillside land, but managed by a group of small-scale farmers using a common irrigation infrastructure); and small-scale irrigation (small, privately owned garden plots with a common irrigation infrastructure also managed by a group of small-scale farmers) (Republic of Rwanda, 2010). For each defined irrigation scheme, all water users are grouped into what are known as water user associations (WUAs).Footnote 4
Although a comprehensive irrigation development policy exists, less than 2 per cent of the total agricultural land is covered by state-run irrigation schemes. Irrigation is more widely used than in many other African countries, but small-scale informal irrigation dominates (Nahayo, Reference Nahayo2008). Most of these arrangements were developed locally with little or no outside technical assistance (Republic of Rwanda, 2010). Irrigation water comes mainly from rivers, streams, lakes, rainfall and aquifers. Farmers practising small-scale irrigation harvest rainwater in small earth dams with simple drip technologies (Gasore et al., Reference Gasore, Munyaneza, Ngendabanga and Twibanire2015).
Given the current heterogeneity in irrigation practices due to differences in access to water, the ongoing strategic developments – which prioritize the intensification of current production systems by mechanized irrigation – need to incorporate the design of appropriate instruments that respond to the specific individual context (Narayanan, Reference Narayanan2014).
3. Methodology
3.1. The choice experiment method
Application of the CE method is relatively new in the field of water resource economics. Young (Reference Young2005) presents a detailed discussion of conceptual issues related to water valuation, such as the use of water as an input to production. He notes that, for most goods traded in markets, prices reveal a product's scarcity via the signals it sends; whereas, for publicly provided goods and goods with a strong public good component, such as water, clear price signals are often lacking. In these cases, indirect valuation methods are needed. However, for developing countries, the use of CE to analyse water demand has been quite limited.
Thus, only a few studies have used CE to analyse households’ WTP for improved domestic water services. Echenique and Seshagiri (Reference Echenique and Seshagiri2009) used CE for a wide range of water provision attributes in Hyderabad, India, and found that the WTP for improvements substantially exceeded their costs. They found that current attribute levels were likely to affect respondents’ WTP for additional improvements, but nonetheless used average current attribute levels for their SQ option. Kremer et al. (Reference Kremer, Leino, Miguel and Peterson Zwane2011), using revealed choice data to study the tradeoff between improved water quality (and associated health improvements) and walking distance to water, found that households in rural Kenya valued improved water quality at relatively low levels compared with water accessibility and time spent collecting water. Abramson et al. (Reference Abramson, Becker, Garb and Lazarovitch2011) compared different payment vehicles for improved water provision in rural Zambia and found that, if respondents could pay by providing labour rather than money, their overall WTP was higher; however, the authors cautioned, this would only apply if that labour could actually be used for productive activities that warranted the market wage rate – which was debatable in rural settings and especially so since the labour would be provided during the low season. Tarfasa and Brouwer (Reference Tarfasa and Brouwer2013) used the CE method to elicit households’ WTP for improved water supply services in an urban area in Ethiopia. Despite significant income constraints, households were willing to pay up to 80 per cent more than their current water bills for improved levels of water supply. Women and poor households with the lowest service levels attributed an even higher value to improved water supply services.
Regarding water for irrigation, there have also only been few studies so far. Brebbia et al. (Reference Brebbia, Marinov and Bjornlund2010) elicited the most preferred water pricing method under different water rights, water prices and local irrigation water governance contexts in India. The results showed that, under conditions of improved water rights, there was an increase in the preference for volumetric pricing, while this preference decreased with the presence of a WUA. Furthermore, combining water management tools selectively helped to increase the WTP for an improved supply scenario. Also in India, Chellattan Veettil et al. (Reference Chellattan Veettil, Speelman, Frija, Buysse, Mondelaers and van Huylenbroeck2011a, Reference Chellattan Veettil, Speelman, Frija, Buysse and van Huylenbroeck2011b) investigated farmers’ preferences for and the efficiency of a given pricing method based on WTP estimates, finding that farmers preferred all the proposed alternative pricing systems to the existing system, and that volumetric-based pricing would probably be the most acceptable solution. Bhaduri and Kloos (Reference Bhaduri and Kloos2013) studied the bundling of water provision with other services such as credit provision and provision of health and education services among farmers in Uzbekistan. They found that bundling increased the WTP for the studied water attributes, and that what crop farmers grew affected their WTP for improved water provision.
Researchers have often used hypothetical baseline scenarios in CE – either completely hypothetical baselines, or baselines using average attribute levels for a wide number of respondents – without considering their impacts on a respondent's welfare. However, Barton and Bergland (Reference Barton and Bergland2010), studying the WTP for irrigation water among farmers in Bangladesh, found that considering individual SQ information helped improve model significance. They asked farmers to choose between two alternative situations: one entailed an improved irrigation water supply at different charges, while the other entailed their existing situation, where the water supply and the water tax were those that the individual farmers currently faced. The authors found that including farmers’ current situation affected their estimated preferences for hypothetical water regimes and irrigation prices. A few other studies have incorporated heterogeneous current baselines in various fashions. The study by Tarfasa and Brouwer (Reference Tarfasa and Brouwer2013) discussed above found huge variation in households’ baseline situations, and handled this by having net attribute improvements rather than gross attribute levels in the non-SQ choice sets. However, the WTP for a net improvement is likely to depend on what the current situation is, so this approach may not have captured the full effect of baseline heterogeneity on WTP. Soto Montes de Oca and Bateman (Reference Soto Montes de Oca and Bateman2006), using contingent valuation to study the WTP for improved drinking water services in Brazil, subdivided their sample by the current baseline situation. They found that households with worse baselines had higher WTP for an improved level of water provision, and that this effect was especially pronounced for poorer female respondents. However, most studies that have incorporated current baselines at all have done so by using average attribute levels for all respondents, thus not only averaging out any initial baseline heterogeneity, but also effectively creating a hypothetical baseline which might not be relevant for an individual respondent.
3.2. Individual SQ information
The current study also uses CE, but in line with the Barton and Bergland (Reference Barton and Bergland2010) study discussed above, we emphasize the impact of including individual SQ information on the WTP for new hypothetical alternatives. According to Barton and Bergland, this might help to understand the SQ effect better, and may capture otherwise unobserved heterogeneity.
When people are faced with different choices, they have a strong tendency to prefer that things remain unchanged (Meyerhoff and Liebe, Reference Meyerhoff and Liebe2009). This behaviour, referred to as SQ bias, was first demonstrated by Samuelson and Zeckhauser (Reference Samuelson and Zeckhauser1988). CE studies have generally avoided using SQ information because individuals’ preferences for SQ choices have been considered as a psychologically based deviation from rational choice. Thus, the use of SQ information has been cited as a factor that might induce an SQ bias relative to rational consumer behaviour towards the SQ alternatives (Barton and Bergland, Reference Barton and Bergland2010). However, for demand prediction and in order to estimate the welfare change associated with policy proposals, the use of SQ information may be essential. Furthermore, the inclusion of SQ information means that respondents are not forced to choose only between hypothetical alternatives they might not actually want.
In general, SQ information used in the CE literature has mainly been fixed and hypothetical, with no change in attributes across respondents. According to Barton and Bergland (Reference Barton and Bergland2010), however, the simplification to a common SQ becomes problematic in the CE scenario when the actual SQ situation facing respondents is sufficiently variable. In their study, Barton and Bergland considered that, since irrigation water was a common pool resource and rivalrous in consumption, every farmer had a different SQ water-availability scenario, depending on his/her farm's location in the network of irrigation channels. It is the same with the current study: we noticed a large variation among farmers with respect to irrigation frequency, water availability and payment for water used. For domestic water use, the wide variability across households is observed particularly keenly through the frequency of contracting waterborne diseases, through distance from the nearest water point and through the cost of water. Thus, the use of individual SQ information is likely to be suitable for both domestic and irrigation water use for the present study as well.
For modelling issues, the SQ effect has been dealt with by applying the conditional logit model together with an alternative-specific constant (ASC), or by applying the nested logit model – given that the first model helps to address systematic SQ effects, and the second the correlation across utilities of designed alternatives. As for the mixed logit model specification, both types of effects are flexibly and simultaneously addressed by inducing a correlation pattern in the utility of alternatives, and by capturing a systematic effect due to the SQ in the indirect utility (Scarpa et al., Reference Scarpa, Ferrini, Willis, Scarpa and Alberini2005). However, according to Banzhaf et al. (Reference Banzhaf, Reed, Kristy, Bennett and Blamey2002), including the individual characteristics of each respondent's opt-out alternative is more informative than including an interaction term between an ASC and a respondent's characteristics. Furthermore, Barton and Bergland (Reference Barton and Bergland2010) could not include an ASC for the SQ level, since it is highly correlated with the individual SQ attribute levels. Therefore, the present study is similar to that of Barton and Bergland, but with an application to both irrigation and domestic water use.
For both irrigation and domestic water use, households in our study were asked to choose between two new alternatives for improved water supply at different prices and other attribute levels, on the one hand, and a current situation in which water supply reflected the SQ level as reported by the household, on the other. The attributes of the two new alternatives were chosen so as to resemble actual rural household water supply projects established by rural utilities and state-run irrigation schemes currently being carried out in Rwanda, while the SQ levels reflected the situation at the time of the survey.
4. Model development
The conditional and mixed logit models have been popular in modelling qualitative choice behaviour. According to McFadden (Reference McFadden and Zarembka1974), approximation is reasonably good with the conditional logit model – even in small samples. However, the main concern about this model is its assumption of independence from irrelevant alternatives (IIA).Footnote 5 Furthermore, with this model, disturbances are assumed to be independent and homoscedastic. These assumptions may be too restrictive, especially when the number of alternatives in the choice set is large.
The mixed logit model allows the parameter associated with each observed variable to vary randomly across individuals, and avoids the IIA assumption (Revelt and Train, Reference Revelt and Train1998). Carlsson et al. (Reference Carlsson, Frykblom and Liljenstolpe2003) note that, although the mixed logit models are less restrictive than their conditional counterparts, they are more difficult to estimate and the results can be heavily influenced by the distributional assumptions: the distributions of the selected random parameters can take a number of functional forms (e.g., normal, triangular, uniform or log-normal) and, due to the bias that could exist in real data, determining the true distribution empirically is challenging. Considering, then, the advantages and disadvantages for the conditional logit and mixed logit models, we report both estimates for comparison purposes. We estimated conditional logit and mixed logit models without SQ information. In these models, we included the ASC and allowed it to interact with the individual respondents’ socio-economic characteristics. We also estimated mixed logit models with individual SQ information. In these models, we excluded both the ASC and socio-economic characteristics. In fact, according to Barton and Bergland (Reference Barton and Bergland2010), including the ASC in such models could lead to inflated standard errors of coefficients. For comparison purposes, in models with individual SQ information, we included interaction terms between attributes and socio-economic characteristics. Furthermore, based on the real data at our disposal, we tested both normal and log-normal distributions in the mixed logit. Details from the log-normal distribution (available from the authors on request) are qualitatively similar in terms of significant variables.
The main purpose of the CE method is to determine the individual's WTP for a unit-level change of a given attribute. The marginal WTP (MWTP) for unit-level change is the ratio between the parameter of the attribute and the parameter of the cost (Louvière et al., Reference Louvière, Hensher and Swait2000). In our case, we allow for heterogeneity in the definition of the SQ level for each respondent, the purpose of which is to estimate how this heterogeneous SQ affects the WTP.
5. Data collection
In August and September 2012, we conducted a survey in 13 of Rwanda's 30 districts. For the sampling method, we first clustered the population into the country's four provinces, excluding the capital city, since the targeted population was that living in rural areas. Consequently, considering a total population of 4,373,100Footnote 6 in all 13 districts, an average household size of 4.3 in rural areas and a sampling fraction of 1:1,000, we randomly sampled 1,017 households. Using simple random sampling, we selected three or four districts in each province to obtain the total of 13 districts. In each district, we randomly selected three sectors,Footnote 7 giving us 39 sectors in total. In 36 of these sectors, we randomly selected 26 households; and in the three remaining sectors, we randomly selected 27 households.Footnote 8 The data collection was undertaken by a team of nine enumerators. Using the random walk method, we chose the sector headquarters as the starting point and began walking from that point to the closest householdFootnote 9 for the first interview. If no-one was at home, we substituted with the very next household. The head of a household was targeted for responding to the questionnaire, but other adults were considered where the head was not available.Footnote 10
The questionnaire was divided into two parts. The first contained questions on respondents’ socio-economic characteristics, while the second contained questions for the CE. Regarding the latter, enumerators first explained the questionnaire as well as the logic of the CE, and respondents were then asked to read the questionnaire carefully and to make their choice among various alternatives. In cases where the respondent could not read and write, the enumerator filled in the questionnaire according to the respondent's answers.
There were two different CEs: one on domestic water use, and the other on irrigation. We had the same questionnaire for everyone up to the point where the CE started. With the CE, participants responded either to the CE related to domestic water use, or to the CE concerning water for irrigation.
In order to avoid a sample selection problem in the CE, we could not split respondents based on whether or not they practised agriculture. Instead, we ran the CE on a rotational basis. Thus, we ran the CE on domestic water with the first, third and fifth respondent in each sector, and accordingly ran the CE for irrigation water with the second, fourth and sixth respondent in that location. However, for the CE for irrigation water, the rotational order sometimes could not be respected, given that some households did not practise farming. In such cases, we automatically switched to the CE on domestic water and instead used the CE on irrigation for the next household to be interviewed. Those who responded to the CE for domestic water numbered 785, and those for irrigation water, 232.
The hypothetical alternatives were designed to resemble actual water supply schemes currently being set up in Rwanda. This meant that, for many of the surveyed households, the proposed hypothetical alternatives were markedly better than the SQ, especially in terms of the distance to water. On the other hand, the SQ was frequently markedly cheaper than the proposed alternatives. Given the government's stated objective of expanding water provision, there is some risk that respondents might have felt pressure to accept paying for expensive water provision in the experiment; for this reason the last piece of information given to respondents before they made their choice was to repeat that they could opt to keep their SQ if they preferred it to the other alternatives.
5.1. Attributes and attribute levels in the CE
A pilot study was carried out in five districts with 10 randomly selected households in each district, in order to allow us to define attributes and attribute levels. The pilot confirmed that most households lacked piped water into their houses, and used unsafe non-tap sources as a result. There was a high incidence of diarrhoeal infections (about three cases per household member per year) due to unsafe water, and household members walked long distances to fetch water. From these findings, we understood that health effects and distance to water sources would be relevant attributes for any policy reform. Due to the very limited access to domestic water which, in turn, is associated with a high risk of infectious diseases, we assumed that households would be positive to policy reforms that would help them to get better quality water. Under different tariff schedules, the new service could either help to alleviate the problem with the current unreliable service, or would solve the problem completely. There were scenarios in which the set of attributes as well as the price varied, where only two incidences of infectious diseases per household member occurred per year, and where no such incidences occurred. The scenarios entailed distances to the water point of either 20 or 40 m.
Regarding irrigation water, information from the pilot showed that the practice of irrigation was very new in the country, and that, at the time of the survey, not many farmers irrigated their crops. Those who did so usually employed small-scale irrigation only: rainfall dams remained the most popular method for doing so. Farmers generally do not pay for water used; where they do, they usually pay a fixed amount for each season, unrelated to the quantity used. Water is insufficient, however: the dry season typically lasts six months, but the irrigation water only lasts for two months on average. When water is available, the average watering frequency is three times a month. Farmers manifested a high WTP for an increased availability of water and greater watering frequency. Considering their current situation, we thus had scenarios where the water availability would last for either five or six months, while watering frequency would be either six or eight times per month.
5.2. Coding the individual SQ information
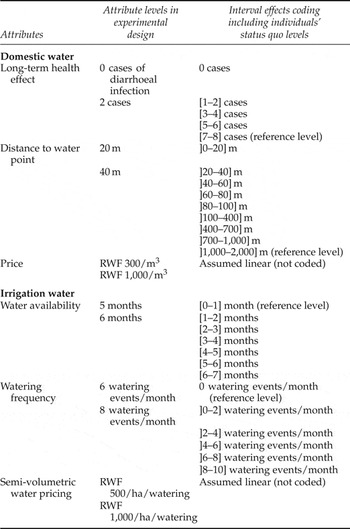
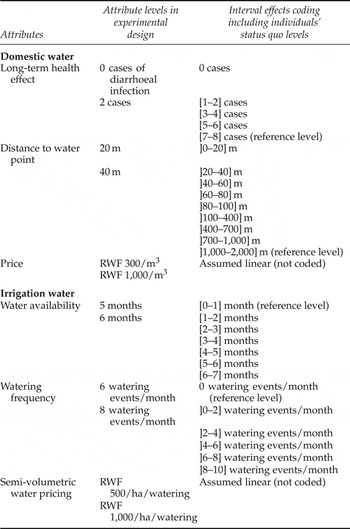
Given that the pilot study showed a considerable heterogeneity in respondents’ SQs, we used the SQ alternative, as specified by each respondent, rather than devising a fixed or invariant code across respondents. In order to put the individual SQ information and the experimental design levels on the same attribute scale, we used interval coding for the individual SQ level (see Appendix, table A1).Footnote 11 Since most respondents did not state exact numbers but, rather, gave rough intervals as their responses, interval lengths were chosen based on those responses. The only exception was the Distance to water point variable, where responses were aggregated into three intervals based on the relative response frequency.
Before the CE began, we first briefly introduced the purpose of the experiment by reminding respondents about the current rural water devolution policy. We also asked them about their SQ water availability. We gave detailed explanations of the hypothetical attribute levels and informed them that improved water provision would be costly, and that part of the cost would be passed on to users in the form of higher prices.
With a total of six choiceFootnote 12 sets divided into two blocks, each respondent responded to three choice situations on a rotational basis in the experiment. Each choice contained two hypothetical alternatives for an improved water supply as well as the option to choose the SQ situation as they had described it.
6. Descriptive statistics
6.1. Households’ SQ
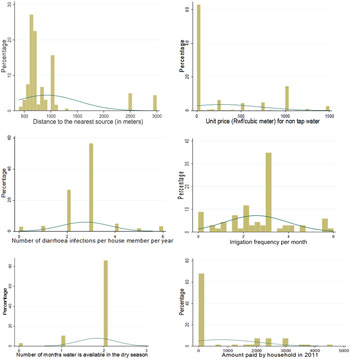
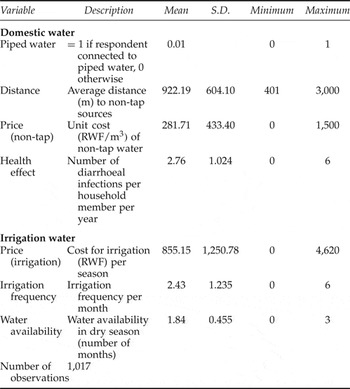
Table 1 and figure 1 describe the households’ situation at the time of the survey in terms of domestic and irrigation water use. For domestic water use, statistics from the survey showed that only 1 per cent of the sample was connected to piped water.Footnote 13 Thus, the majority of households (99 per cent) in the sample relied on different types of non-tap water sources. The distance to the nearest water point varied between 401 and 3,000 m; only 1 per cent walk less than 500 m, with the average distance being about 922 m. The majority of households (about 63 per cent) obtain water at no monetary cost, but some pay substantial amounts; this makes the average unit cost of water approximately RWF 282Footnote 14 per cubic metre. As regards waterborne diseases, on average a member of the household contracted infectious diarrhoea three times a year.
Respondents’ status quo situation

Respondents’ status quo situation

Source: Authors’ data collection.
With respect to irrigation water, the average frequency of irrigation was twice a month, and water was available for an average of two months in the dry season. As figure 1 shows, there was substantial variation here as well. The average overall payment for irrigation was RWF 855 per season, giving an average cost of some 98 RWF/ha/watering.Footnote 15 However, 59 per cent do not pay for water to irrigate their crops.
Thus, the SQ varies dramatically for several of the variables in both domestic and irrigation water, and it could have been misleading to assume that everyone had the same SQ.
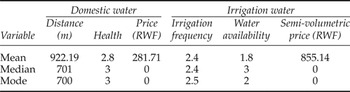
Figure 1 also shows that, for domestic water, the distributions for number of diarrhoeal infections per household member per year look symmetric about the mean. According to the descriptive statistics in table 2, the sample mean for the number of diarrhoeal infections per household member per year equal to 2.8, the median equal to 3, and the mode equal to 3 are close. This allows us to assume that the number of diarrhoeal infections per household member per year is normally distributed, although the distance to the nearest water point and the price of non-tap water are assumed to be log-normally distributed. For irrigation frequency, the mean (2.4), the median (2.4) and the mode (2.5) are close, which allows us to assume a normal distribution for this attribute and a log-normal distribution for Water availability and Price (irrigation) attributes.
Mean, median and mode of attributes

Source: Authors’ data collection.
6.2. Respondents’ socio-economic characteristics
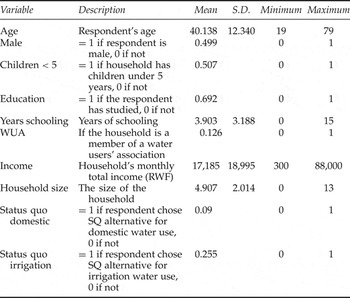
From the descriptive statistics in table 3, we can see that respondents were aged between 19 and 79 years, with an average age of 40. Half the respondents were men and half were women. Some 70 per cent could read and write; the average number of years of schooling was four. Average monthly household income was RWF 17,185 and average household size was five persons. Over 90 per cent of respondents desired an improved supply of water for domestic use even if they would have to pay more, while 74 per cent desired improved access to irrigation water.
Descriptive statistics

Source: Authors’ data collection.
7. Results
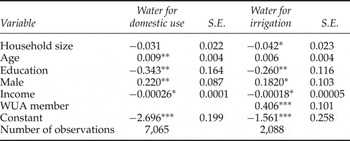
Using a simple logit model, we tried to estimate the probability of selecting the SQ based on some of the respondents’ characteristics described in table 4. Our results show that, in domestic water use, older respondents were more likely to choose the SQ. This finding is in line with Soto Montes de Oca and Bateman (Reference Soto Montes de Oca and Bateman2006), for example, who found a lower WTP for water improvements among older respondents, although it is not entirely clear why older respondents should be less interested in improved water availability. The more educated the respondent, the less s/he preferred the existing situation. Male respondents were more likely to choose the SQ for both domestic and irrigation water.Footnote 16 Households with a higher income were slightly less likely to choose the SQ alternative, ceteris paribus. Being a member of the WUA increased the likelihood of preferring the SQ for irrigation water.
Logistic regression of factors affecting choice of SQ

Notes: ***, ** and *= significance at 1%, 5% and 10% level, respectively. S.E., standard error. Source: Authors’ data collection.
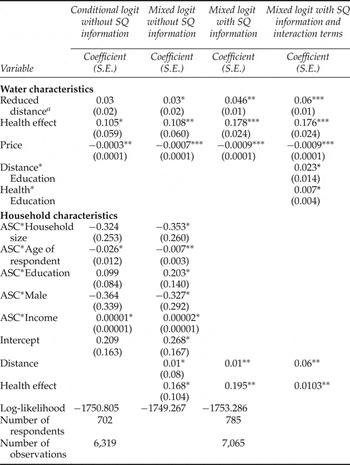
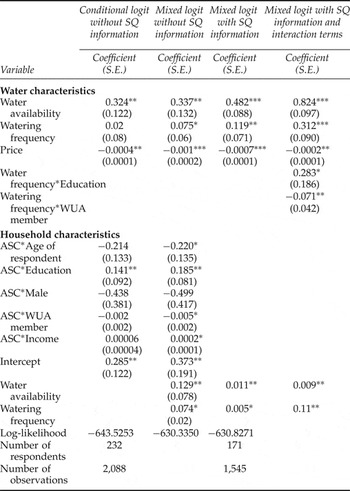
We estimated both conditional logit and mixed logit models. For the mixed logit model, we simulated the maximum likelihood by using Halton draws with 50 replications. We compared the models without individual SQ information with a model that used this information. Furthermore, we allowed the price variable to be fixed and not randomly distributed, while other attributes were randomly distributed. Individual characteristics were also included in the models and interacted either with alternative specific intercepts in models without individual SQ information, or with attributes in models with such information. The results of these estimations are presented in tables 5 and 6.
Model estimates for domestic water

Notes: ***, ** and *= significance at 1%, 5% and 10% level, respectively. a From Far (more than 1 km) to Near (20 m or less). Source: Authors’ data collection.
Model estimates for irrigation water

Notes: ***, ** and *= significance at 1%, 5% and 10% level, respectively. Source: Authors’ data collection.
For domestic water (see table 5), the coefficients for the reduced distance and health effect attributes are positive. Educated and higher income respondents were more likely to choose the improved service. Male respondents were less likely to choose improved services, but this variable was only significant in the mixed logit models. Older respondents were also less likely to choose the improved service.
Comparing results from the conditional logit and the mixed logit models without individual SQ information, we can see that the intercept is statistically significant and positive for the mixed logit alone. The significance of the intercept implies that the new alternatives are, on average, preferred to the SQ alternative. Furthermore, comparing both models without SQ information shows that the significance of the coefficients in general is improved in the mixed logit model, allowing us to use the mixed logit in the rest of the estimations.
If one now compares the results from the mixed logit models without and with individual SQ information, we see that the significance of the coefficients is increased in the models with individual SQ information. Furthermore, in the mixed logit models with individual SQ information, the significance of the estimated standard deviation is a sign of heterogeneity in respondent preferences.
Furthermore, using the interaction terms in the mixed logit model with individual SQ information, results show that, in general, respondents with higher levels of education were more likely to prefer a water supply scenario with a higher level of health benefits and a reduced distance to the water point.
These results allow us to conclude that using the mixed logit model with individual SQ information is more useful than the other options, because it offers a better model of household behaviour, and allows us to estimate attribute coefficients more accurately.
For irrigation water use, a comparison of the conditional logit and the mixed logit models without individual SQ information shows positive signs on both improved watering frequency and improved water availability attributes in the mixed logit models (see table 6). This means it is more likely that respondents do not prefer the existing watering frequency and water availability.
Educated and higher-income respondents were more likely to choose the improved irrigation service; older respondents and males were less likely to choose it, although the gender variable was not significant. WUA membership reduced the likelihood of choosing the improved service, but this variable was only significant with the mixed logit model.
To summarize, we can first say that, by comparing the results from the conditional logit and the mixed logit models without individual SQ information, intercepts are positively significant for both the conditional logit and the mixed logit. This implies that, on average, the new alternatives were preferred to the SQ alternative. Then, comparing both models without SQ information, we can observe that the statistical significance of the coefficients was improved in general when the mixed logit model was used. This allows one to use the mixed logit in the rest of the analysis.
Comparing results from mixed logit models with and without individual SQ information, we observe that the significance of the coefficients increased in the models with individual SQ information. Furthermore, the significance of the estimated standard deviations in the mixed logit models with individual SQ information revealed heterogeneity in respondent preferences.
If one includes interaction terms in the mixed logit model with individual SQ information, the results show that respondents with higher levels of education were more likely to prefer an irrigation water supply scenario with higher levels of frequency. Furthermore, the interaction between watering frequency and WUA membership was negative. This result is similar to that found by Barton and Bergland (Reference Barton and Bergland2010) in Bangladesh.
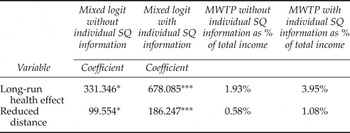
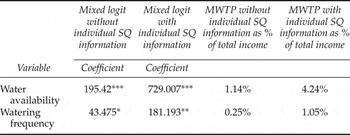
Our main interest lies in comparing the MWTP for models without and with individual SQ information. Using the normal distribution for both domestic and irrigation water use, the results in tables 7 and 8 show large differences in MWTP between the two mixed logit models, probably because the strong heterogeneity in the current situation induces heterogeneity in preferences. Furthermore, we found an increase in the size and significance of coefficients in the mixed logit model with individual SQ information for both irrigation and domestic water use.
MWTP for levels in domestic water

Notes: ***, ** and *= significance at 1%, 5% and 10% level, respectively. Source: Authors’ data collection.
MWTP for levels in irrigation water

Notes: ***, ** and *= significance at 1%, 5% and 10% level, respectively. Source: Authors’ data collection.
Comparing the mixed logits with and without individual SQ information, for domestic water use (table 7), the MWTP for having water within a maximum distance of 40 m from the household was valued at 0.58 per cent of average household income when SQ information was not taken into account, but at 1.08 per cent of average income when it was. In addition, one less case of diarrhoea per household member per year was valued at 1.93 per cent of household income when the SQ was not taken into account, but at 3.95 per cent when it was. For irrigation water, in comparing the models with and without individual SQ information, we found (table 8) that the MWTP for watering crops at least six times per month rather than twice per month was estimated at 0.25 per cent of household total income when SQ information was not used, and at 1.05 per cent when it was. The MWTP for having water for five rather than two months of the dry season was valued at 1.14 per cent of household total income without SQ information, and 2.24 per cent with it. When SQ information was included, in both the domestic and irrigation water cases, the MWTP was at least twice as high as when SQ information was excluded.
8. Conclusion
The CE method has been used to evaluate how heterogeneity in a rural household's existing water use affected their preferences for a hypothetically improved situation. From basic statistics, 26 per cent of respondents preferred the existing irrigation water supply system to a proposed new one. The likely reason might be that, with the current system, 61 per cent of respondents did not pay for water used, but still practised some irrigation. However, for domestic water use, although 65 per cent obtained water free of charge, in general they were not satisfied with the existing situation. In fact, only 10 per cent preferred the existing system to remain, while the rest were willing to pay for improved water. Considering that households not connected to the piped network system were aware of their vulnerability – as manifested by the high frequency of waterborne diseases among their members – one can understand why the majority (90 per cent) opted for change. In fact, if one compares the levels of satisfaction with the SQ for domestic and irrigation water, respectively, households were less dissatisfied with the existing irrigation system than with the existing domestic water supply.
Using information on individual respondents was important for the analysis. Comparing the conditional logit and the mixed logit models without individual SQ information, we saw that the proposed new alternatives were preferred, on average, to the SQ alternative for both domestic and irrigation water, and that significance of the coefficients was generally improved in the mixed logit model. This revealed heterogeneous preferences for the attributes concerned. Using the mixed logit models with individual SQ information, we found an increased significance of coefficients for both irrigation and domestic water use, compared with the results obtained when we used the mixed logit without individual SQ information.
For the MWTP, coefficients were larger and had higher statistical significance in models with individual SQ information than in those without such information. Furthermore, the overall situation showed that attributes in the CE increased the utility derived from an improved service, which means that, in general, respondents were willing to pay for a new, improved service.
From a policy perspective, not accounting for individual SQ information means that an overall policy change might be undertaken without considering individual cases. If one refers to the results from the present study, not considering individual SQ information might work since a majority opted for the change. However, considering how including individual SQ information increased the magnitudes of coefficients, if SQ information is not used the MWTP might be misestimated, which might cause policy makers to implement water schemes that do not respond to the real needs of the population. In our case, not using SQ information would have led to an underestimation of households’ WTP for the improved provision of both domestic and irrigation water. Erroneously indicating to policy makers that the WTP for improved water provision is lower than it actually is could, effectively, contribute to maintaining the current state of underinvestment in the water sector. More generally, not taking SQ information into account – when SQs are as different as they were in this case – risks leading to a poorer understanding by policy makers of what households actually want, and how the potential changes compare to their current situation. Thus, care needs to be taken – both to ensure that changes in water provision do not worsen conditions for households with a favourable SQ, and so that changes in water provision that will improve conditions for households with an unfavourable SQ are in fact carried out. Taking the heterogeneity in the existing situation into account in policy is important, therefore: both for those who have a favourable SQ situation and for those who do not.
Appendix
Attributes and attribute levels: domestic and irrigation water