


Introduction
The Arctic sea-ice cover is one of the most prominent indicators of change in the Arctic. Several studies have noted the significant downward trend since 1979 in the summer minimum ice extent detected from passive microwave satellite retrievals (e.g. Reference Parkinson, Cavalieri, Gloersen, Zwally and ComisoParkinson and others, 1999; Reference ComisoComiso, 2002; Reference SerrezeSerreze and others, 2003; Reference StroeveStroeve and others, 2005). That trend has accelerated in recent years, with the past four (2002–05) summer minimums setting record or near-record lows (Reference Stroeve, Markus, Meier and MillerStroeve and others, 2006). The September 2005 minimum was particularly extreme, with an average monthly extent of 1.4×10⁶ km2 below the long-term (1979–2000) average and 400 000km2 below the previous record low in 2002.
Earlier studies indicated that the anomalously low summer extents during the early and mid-1990s were due to a strongly positive winter Arctic Oscillation (AO) that advected ice away from the Alaskan and Siberian coasts, leading to thinner first-year ice at the end of the growth season that was more easily melted during the following summer (Reference Rigor, Wallace and ColonyRigor and others, 2002). However, since the mid-1990s the AO has been in a more neutral phase and yet the summer extent trend accelerated during the early 2000s. Reference Rigor and WallaceRigor and Wallace (2004) suggested that the lower extents during 2002 and 2003 resulted from the advection of thick multi-year ice out of the Arctic through Fram Strait, replaced by the AO-induced thinner ice through the Arctic that is ‘preconditioned’ for more intense melt. Others argued that increased cyclonic circulation during summer 2002 caused more ice divergence, resulting in greater open-water areas within the ice cover that absorbed more solar radiation (Reference SerrezeSerreze and others, 2003). However, neither of these two explanations sufficiently explains the last two extremes during September 2004 and 2005. The common factor throughout all years has been anomalously high air temperatures, which have been consistent throughout the Arctic in most months since 2002 (Reference StroeveStroeve and others, 2005). Most recently, a synthesis argument suggests that both the AO-induced circulation changes and increased temperatures have contributed to the decline. The AO ‘triggered’ the accelerated decline of the sea ice by reducing the average thickness of the ice cover, and subsequent increasing temperatures have not allowed the ice to recover (Reference Lindsay and ZhangLindsay and Zhang, 2005). This may have caused the sea ice to pass a ‘tipping point’, where further decline to an ice-free Arctic summer state is inevitable.
Through the early 2000s, the downward trend was limited primarily to the summer, with winter trends small and not statistically significant. However, since 2002 the winter trends have accelerated and are now statistically significant (Reference Meier, Stroeve, Fetterer and KnowlesMeier and others, 2005). This may be the initial indication of a sea-ice–albedo feedback influence. As sea-ice extent decreases during summer, more solar radiation is absorbed by the increased ocean area, heating the upper level of the ocean and delaying the onset of freeze-up and slowing ice growth. Freeze-up has been observed to be delayed by several days in the peripheral seas where the summer extent anomalies have primarily occurred (Reference Stroeve, Markus, Meier and MillerStroeve and others, 2006). Changes to snow and ice surface properties also influence the albedo (Reference Perovich, Grenfell, Light and HobbsPerovich and others, 2002) and may also play a role in the feedback mechanism.
Here we look in depth at the passive microwave sea-ice extent time series. Simple comparisons are made between the most recent sea-ice data and the AO and temperatures. Trends in sea-ice extent are examined for specific months and for different regions, including areas, such as the Beaufort, Chukchi and Siberian Seas, where the steepest summer declines have been observed. We also examine a long time period, relative to that covered by most references on trends in sea ice, by incorporating data that preceded the satellite record. With this new time series, we can compare the current and potential future trends.
Satellite Time Series of Extent, 1979–2006
Data
Passive microwave data, from the Scanning Multichannel Microwave Radiometer (1978–87) and the Special Sensor Microwave/Imager (1987–present) provide the most consistent long-term time series of sea-ice cover. The time series employed in this study was produced from two sources of sea-ice concentration fields. The first, for 1979–2004, was produced at the NASA Goddard Space Flight Center (D. Cavalieri and others, http://nsidc.org/data/nsidc-0051.html) using the NASA-Team (NT) algorithm (Reference Cavalieri, Gloersen and CampbellCavalieri and others, 1984). (October–December 1978 data are also available, but were not used here for simplicity.) Inter-sensor calibration and other quality-control measures, such as filtering of weather effects and coastal contamination (due to mixed land/ocean pixels), were employed to produce a high-quality dataset that is consistent in time. Hereafter, we refer to this dataset as ‘Goddard NT’. This time series currently extends through December 2004, so it was augmented with more recent fields (January 2005–March 2006) from the US National Snow and Ice Data Center’s (NSIDC) Sea Ice Index (Reference Fetterer and KnowlesFetterer and Knowles, 2004). These fields are processed to be consistent with the Goddard NT time series. Both datasets are produced on a polar stereographic grid at 25km spatial resolution. This low spatial resolution results in averaging over ice floes and leads, and thus limits the quality, but it is sufficient for basin and regional averages discussed here. Monthly total extent values were calculated from monthly mean fields by summing the area of all pixels with a concentration of at least 15%.
Total Arctic extent and relationship with AO and temperature
Monthly anomaly values were calculated for 1979–2006 by subtracting the monthly mean extent for a reference period 1979–2000 from each monthly extent value. This reference period was selected for consistency with previous studies. Trends were computed for total extent over the 1979–2006 time series from monthly and annual means (Table 1). All trends are significant at greater than a 99% confidence level based on an F test with the null hypothesis of a zero trend. While the F test provides a good estimate of the significance of the trends, here we implement an additional test that determines the number of years of data required to obtain a trend at a 95% significance level (Reference WeatherheadWeatherhead and others, 1998). The benefit of this approach is that it takes into account the dependence of a trend’s significance on the variance and autocorrelation of the noise. A time series that is highly autocorrelated may pass the F test simply due to the presence of trend-like elements in the time series. Also, the variance in the data can make trends appear more or less significant due to the ‘signal-to-noise’ effect. As suspected, the annual mean and monthly means all have more than enough years (27) for a significant trend. Though in absolute terms the summer extent decline is most dramatic, this test shows that, because of the large variance, a comparable number of years are required as for many of the winter months. This is an indication that the significance of winter trends compared to summer trends may be underestimated by ignoring the effects of autocorrelation and variance. The highest number of years required occurs in May and November, when peripheral seas such as the Bering, Okhotsk and Barents Seas are undergoing rapid melt or growth.
Yearly and monthly average ice extent, standard deviation and trend statistics for total Arctic for 1979–2006, with the years 1979–2000 used as a reference period to calculate the trends. The final column indicates the number of years of data necessary to detect a significant trend at a 95% confidence level

The annual trend is now –3.6% decade–1, compared to –2.8% decade–1 for November 1978–96 (Reference Parkinson, Cavalieri, Gloersen, Zwally and ComisoParkinson and others, 1999). The summer retreat of Arctic sea ice is quite dramatic, with the September trend now –8.4% decade–1. This is an increase over recent estimates of –7.7% decade–1 through 2004 (Reference StroeveStroeve and others, 2005) and –6.4% decade–1 through 2000 (Reference ComisoComiso, 2002). The winter anomalies and resultant trend are comparatively small in an absolute sense, –2.5% decade–1 for March). However, the variability during the winter months is also much smaller, which will tend to yield more significant trends as discussed above. To equally evaluate anomalies and trends at different times of the year, the monthly mean anomalies were normalized by dividing each by the monthly standard deviation (for 1979–2000). This yields a time series of how many standard deviations each month are above or below the mean (Fig. 1). With this approach, the dramatic decline is now apparent not just during summer but at nearly the same level (relative to each month’s variability) through all months, with monthly trends varying between –1.0σ and –1.3σ decade–1 (Table 1). This again demonstrates the importance of the variance in a given month on the significance of that month’s trends.
12 month running-mean anomalies, normalized by monthly standard deviation (1979–2000) for sea-ice extent, the AO index and the regionally averaged 925 mbar air temperatures. The unfiltered monthly mean values are in thin, light gray.

A 12 month running-mean filter was applied to remove seasonality and to provide a clearer view of the general trend from June 1979 though September 2005 (Fig. 1). The filtered time series shows a downward trend combined with a periodic (~5 year) interannual pattern (perhaps related to the AO and/or other climate oscillations) until the mid-1990s when this cyclical signal starts to disappear, replaced by a steady downward trend that seems to have accelerated since early 2003. Since 1995, the unfiltered anomalies have been mostly negative, and the last positive anomaly in the 12 month running mean occurred in August 1994. This indicates that something quite different is occurring since the mid- to late 1990s compared to earlier years.
Likely factors are the AO and air temperature. Monthly mean AO and 925 mbar air-temperature time series were acquired from the US National Centers for Environmental Prediction (NCEP)/US National Center for Atmospheric Research (NCAR) re-analysis product (Reference KalnayKalnay and others, 1996) at the US National Oceanic and Atmospheric Administration (NOAA) Climate Diagnostics Center. The 925 mbar air temperatures are a regional average north of 60˚ latitude. As was done for the ice extent, air-temperature anomalies were calculated and normalized by the 1979–2000 monthly standard deviations. Since the AO is an index, anomalies were not calculated, but the index values were normalized by the monthly standard deviations. Both the AO values and the air temperatures were filtered with a 12 month running mean to be consistent with the extent anomalies.
As discussed above, the AO is strongly positive in the late 1980s and has been implicated in the drop in ice extent at that time (e.g. Reference Rigor, Wallace and ColonyRigor and others, 2002) (Fig. 1). However, otherwise the AO does not seem to have a prevailing effect, especially since the late 1990s when the AO has been relatively neutral. On the other hand, the air temperatures do appear to be an important factor. For the 12 month running-mean normalized anomaly values, the temperatures have a correlation with extent of –0.74. The temperature anomalies are consistently positive since February 1997, except for two very small negative anomalies in 1997 and 2000. Between September 2001 and January 2002 the weighted temperatures increased quickly from near-zero anomalies to about 1σ above the long-term (1979–2000) mean, and they have been near or above that level since then. A series of four extremely low September ice-extent years began in 2002. While the atmosphere is generally thought of as a thermodynamic forcing for the sea ice, the high air temperatures of recent years may partially be reflective of a feedback from the surface to the atmosphere where the larger area of open ocean is absorbing more solar radiation and transferring the resulting energy back to the atmosphere as sensible (and latent) heat. However, other factors, particularly ocean heat flux, as well as wind fields and clouds, are certainly also playing an important role in the recent decline, though we do not investigate them here.
Regional and monthly extents
While the overall total extent time series clearly shows a significant downward trend, the asymmetric geography of the Arctic region as well as mesoscale weather patterns leads to a great deal of regional variability in the ice cover. Thus it is also instructive to examine regional trends. Regional trends were investigated previously by Reference Parkinson, Cavalieri, Gloersen, Zwally and ComisoParkinson and others (1999), hereafter referred to as Parkinson. Here we extend those trends through 2005. The Parkinson regions are used as the basis for the regional definitions used here, but the Parkinson ‘Arctic Ocean’ region is split into several separate regions (Laptev, East Siberian, Chukchi, Beaufort, and Central Arctic) to distinguish the behavior of the Arctic coastal seas where the decline is most pronounced (Fig. 2). Also, we have split the Parkinson ‘Kara and Barents Sea’ region into separate regions for each sea.
Regions of the Arctic used for the regional analysis, each region denoted by a shade of gray. Land is white, coast is black. The Baffin region includes the Labrador Sea, and the Okhotsk region includes the Sea of Japan. The Oceans region encompasses remaining ocean areas where small amounts of sea ice may exist, primarily in the Baltic Sea; the Oceans regions were not analyzed.

There is large variation in the monthly regional trends (Table 2). Significance of trends was assessed with an F test as above. Many regions, the Central Arctic in particular, have months with a zero trend because they are completely ice-covered during the month in all years; other regions have months with little or no ice, where trends cannot be calculated. However, regions that do have trends are almost all negative (the exceptions being the Bering Sea in winter and the St Lawrence region in November, none statistically significant), indicating that, while there is large regional variability, the effect of warming is felt throughout the Arctic. The largest and statistically significant trends in a given region generally occur in months when melt or freeze-up is at its peak due to enhanced melt and delayed freeze-up. Reference SmithSmith (1998) did not find earlier melt from 1979 through 1996, but in more recent years earlier melt has occurred (Reference Stroeve, Markus, Meier and MillerStroeve and others, 2006). The coastal areas of the Arctic Ocean show large and statistically significant declines during the peak melt months that are not evident in the Parkinson Arctic Ocean region. Most regions show trends with magnitudes greater than the Parkinson analysis for 1979–96, indicating that the decline has accelerated since then. Parkinson split their analysis into seasons, instead of months as we have done here, so direct comparison by time of year is not possible. However, qualitatively, the trends generally show a larger decline than Parkinson, most notably during summer months.
Regional trends (% decade–1) for each month for the 1979–2006 time series. Standard deviation values (in parentheses) are provided for the year trends and for all months of the total extent trend. Trends that are statistically significant at the 95% level are in italic; trends significant at the 99% level are in bold. Blank fields indicate months where little or no ice is found in the region. A trend of zero generally reflects 100% ice cover in a region throughout the time series. The ‘Arctic Ocean’ is the sum of the Laptev, East Siberian, Chukchi, Beaufort and Arctic Ocean regions equivalent to the same region in Reference Parkinson, Cavalieri, Gloersen, Zwally and ComisoParkinson and others (1999). The ‘Oceans’ region is not shown; it contains only small amounts of ice outside the above regions, primarily in the Baltic Sea

A Longer Time Series: Adjusted and Extended Hadley ISST1, 1953–2005
Data
Sea-ice fields from the Hadley Centre sea-ice and sea surface temperature dataset version 1 (HadISST1) were compiled from a variety of sources including ice charts and passive microwave data (Reference RaynerRayner and others, 2003). For the period preceding the satellite record, the Hadley fields use the Walsh dataset (Reference Walsh and JohnsonWalsh and Johnson, 1979; Reference Walsh and ChapmanWalsh and Chapman, 2001), which, where available, is based on operational sea-ice chart data produced by national ice centers. Gaps in the data are filled in spatially using a climatology. Though the entire Hadley dataset extends from 1870 through 2003, we use only the 1953–2003 period because it is based primarily on the operational charts and not climatology.
Because these earlier fields are compiled from a variety of sources, they are not as consistent as the passive microwave fields, most notably between the pre-satellite period 1953–78 and the satellite period 1979–present. However, the Hadley fields do allow us to extend the time series further and examine longer-term trends. A significant inconsistency in the Hadley fields actually occurs during the satellite period, between 1996 and 1997. When the Hadley dataset was compiled, the Goddard time series only extended through 1996. To obtain more recent data, NOAA NCEP sea-ice fields were used to complete the time series through 2003 (R.W. Grumbine, unpublished information). These fields, although produced using the same algorithm, are operational in nature and thus have a lower level of quality control. Weather effects, for example, may not be effectively filtered.
Since the production of the Hadley time series, the Goddard NT time series has been updated through 2004. Comparison of the overlap period, 1997–2003, clearly shows a significant positive bias ((0.57 ±0.19)×106 km2 for monthly mean September extent) in the NCEP-based Hadley fields compared to the Goddard fields. Thus, the Hadley time series, as it was produced, is not useful for looking at trends beyond 1996. To obtain a consistent time series for this study, the 1997–2003 Hadley monthly extent values were replaced by Goddard values. While the 1979–96 Hadley fields use the Goddard fields as input, minor differences in processing and gridding (Hadley fields are on a 1˚×1˚ grid) yield a negative bias (–0.25×10⁶ km2) compared to the Goddard fields. This bias was added to the 1997–2003 Goddard NT fields to provide consistency between the Goddard and Hadley time series. The time series was then extended through 2005 with the Goddard NT and Sea Ice Index values, also adjusting these values with the bias to provide consistency. The result is an ‘adjusted Hadley’ time series of monthly September total extent values from 1953 to 2005.
Total September extent and trends
The adjusted Hadley allows us to investigate the trend in September minimum ice extent over a much longer period (Fig. 3) than is possible from the satellite data. The September trend for the entire Hadley period has, as expected, a slightly lower trend of –7.7±0.6% decade–1 (at a 99% confidence level), compared to –8.4% decade–1 for the passive microwave period. As mentioned, the pre-satellite data (1953–78) are likely not as consistent with the passive microwave part of the record (Reference RaynerRayner and others, 2003), but it is not possible to directly estimate such a bias because there is no overlap period. However, the approach to determine the number of years to detect a significant trend can be applied here (Reference WeatherheadWeatherhead and others, 1998). This approach can allow for the impact of ‘interventions’ in the time series: a disruption in measurements due to a change in measurement technique that introduces a bias. Even if nothing is known about the size of the intervention, the number of years required to detect a trend can be estimated. Assuming no intervention, the adjusted Hadley requires 11.8 years to detect a trend at a 90% significance level. If an intervention is assumed to occur between the pre-satellite and satellite periods, the number of years required increases to 18.6. The effect of the intervention increases the standard deviation of the trend from 0.6% to 1.0% decade–1. So, even assuming that there is a bias between the two parts of the dataset, the time series is still long enough to obtain a significant trend.
Adjusted Hadley September ice extent, 1953–2005 (black), with linear, exponential and quadratic fit lines (gray).

One illustrative way to examine the recent changes in sea-ice cover compared to the longer-term behavior is to look at how the trend changes over time. This was done using two approaches. First, trends were calculated through 2005, but with different starting years (YYYY–2005) from 1953 (a 53 year trend) through 1996 (a 10 year trend) (Fig. 4). Second, trends were calculated starting in 1953, but with different ending years (1953–YYYY) from 1962 through 2005. Ten years was deemed a minimum length from which to calculate a reasonable trend. Error bars are based on a ±2σ confidence level. The YYYY–2005 trends remain stable through 1984, followed by a period of increased variability before a dramatic decline in the trend starts in 1991. This again demonstrates what appears to be a regime shift in the behavior of the ice triggered by the strong positive AO in the late 1980s. The trends are less reliable (denoted by the 95% confidence-level error bars) as the period over which the trend is calculated becomes shorter, but all except the last year (1996) are statistically significant at the 99% confidence level. Such a dramatic decline after years of consistency again indicates an important change in the behavior of the sea ice. The 1953–YYYY trends do not show the dramatic change after 1991, because the recent extreme low years have limited influence on overall trend. This curve does show that trends were positive for years ending in 1963 through 1974 and since then the trends have been negative.
Time series of Hadley September total extent trend from starting year (1953–96) through 2005 (black) and from 1953 through ending year (1962–2005) (gray). Error bars represent the 2σ confidence level of the trends.

Projections for ice-free conditions
Due to the decreasing Arctic summer sea-ice extent and the increasing rate of that decline, many have speculated on the possibility of ice-free conditions within this century. Studies have indicated that this is possible as early as the middle of the century (Reference OverpeckOverpeck and others, 2005), but it could occur earlier depending on the rate of thinning (Reference Rothrock, Yu and MaykutRothrock and others, 1999; Reference Laxon, Peacock and SmithLaxon and others, 2003; Reference HaasHaas, 2004) and any accelerating influence of the sea-ice–albedo feedback. Extrapolating the linear trend until the ice extent reaches zero is a naïve method of projecting when ice-free conditions could occur (naïve because it assumes that linear regression is always predictive, which it is not).
However, there is no reason to believe that the sea-ice
trend is or will continue to be linear. Due to the sea-ice–albedo feedback, one would expect an accelerating trend, and in fact the recent acceleration in the downward trend is a tantalizing possible indication of this. Thus, two functions in addition to a linear fit have been used: a quadratic and an exponential (ex /3 was found to be a good fit). Fits were made for both the entire Hadley record (1953–2005) and only the satellite-based part of the record (1979–2005), though for clarity only the curves for 1953–2005 are overlaid on Figure 3. Based on daily extent fields, the day with the minimum extent is on average 0.2×10⁶ km2 less than the
September monthly mean, the threshold used here to define ice-free conditions. So the year when ice-free conditions first occur is calculated by extrapolating the curves until the monthly values fall below 0.2×10⁶km2 (Table 3).
Functions to fit the adjusted Hadley September time series and extrapolate to the year when ice-free conditions occur
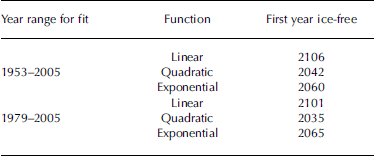
Regardless of the time period and function, the year for first ice-free conditions is similar. This shows that the downward trend does not fundamentally change by using the longer time series and suggests that the satellite part of the record, where the decline is accelerating, controls the overall trend. On the other hand, dramatically different years for ice-free conditions are found depending on which function is used (Table 3). This is not to suggest that the ice-free prediction from one function is a more accurate predictor than any other function. Extrapolation of data is highly uncertain, particularly when conditions are rapidly changing as they appear to be for the Arctic sea ice. The results suggest that it is important to have more knowledge of the physical conditions and feedback mechanisms to estimate when ice-free conditions may develop. One key unknown is the recent rate of decline of the thickness. Modeling can best project future conditions by accounting for the physical processes influencing the ice cover, though a long-term, consistent time series such as the one presented here can help validate and constrain model estimates.
Conclusion
The Arctic sea ice is clearly experiencing unusual conditions. This study shows a significant change in the character of ice extent starting in the early 1990s. Before then, there was an overall downward trend, but it was limited to the summer and it was superimposed on a periodical signal. Starting in the early 1990s and accelerating in the early 21st century, the periodical signal has disappeared and the rate of decline has increased. While the AO may have triggered the sharp decline in the 1990s, the air temperatures are a primary influence recently, though other factors such as ocean heat and atmospheric feedback are likely also key influences. Where there are significant trends in individual regions, the trends are almost always negative and tend to be largest during the peak melt period of a given region.
Extending the time series with the Hadley dataset shows that the longer-term trend is slightly smaller, but reasonably consistent with the trend from the satellite record, and demonstrates that the recent change in behavior in the sea-ice extent is unique over the past >50 years. Because the sea ice is already showing dramatic changes, and climate-model forecasts predict further warming in the Arctic in the coming century, it is essential to continue satellite-derived monitoring of the sea-ice cover. It is also important to refine and extend the data (into the past as well as the future) into a consistent long-term climate data record.



