I. INTRODUCTION
Aluminum foams are finding wide range of applications as they are exhibiting excellent combination of physical, mechanical, and thermal properties in addition to their excellent lightweight characteristics.Reference Ashby, Evans, Fleck, Gibson, Hutchinson and Wadley1,Reference Degischer and Kriszt2 Aluminum foams are classified into two groups depending on their cell morphology: (i) open cell and (ii) closed cell.Reference Banhart3 There is no film of matrix material between neighboring cells in case of open-cell foams wherein the cells are separated with the cell edges. In open-cell foams, the effective surface area exposed to the ambient is considerably more than the closed cell ones, may be 10–1000 times to the surface area of the dense material. Higher thermal conductivity of matrix material, in addition to significantly higher specific surface area, makes aluminum foams to be suitable for heat exchangers, catalysts, acoustic absorbers, filter elements, stiffening elements, hydrogen storage, etc.Reference Rajendran, Sai, Chandrasekar, Gokhale and Basu4,Reference Davis and Zhen5 The closed cell foams where the cells are separated from each other with thin film of matrix material are found to be suitable for energy absorption, blast resistance, foam core sandwich panels, foam-filled tubes, sound and noise attenuation, dampers, etc.Reference Idris, Vodenitcharova and Hoffman6,Reference Lu, Stone and Ashby7 The closed cell foams are finding wide range of applications on the above areas particularly because of their excellent energy absorption at very low plateau stress and higher damping capacityReference Kathryn and James8 (1–2 order more than dense material). The stress waves or any impulse gets reflected repeatedly on the cell wall in a random direction resulting in very slow transmission rate of such waves through the foams and thus exhibiting significantly higher damping capacity.Reference Cheng, Huang, Wei and Han9
Primarily two different methods have been emerged for the synthesis of closed cell aluminum foam. These methods include liquid metallurgy-based processesReference Abdullatef Nawal and Mohammad Jaber10 and powder metallurgy techniques.Reference Michailidis, Stergioudi and Tsouknidas11 In the first method, gas bubbles are entrapped in liquid metals, and the melt gas mixture is solidified quickly to get solid aluminum foam. The gas bubbles are either purged into the melt from external gas sourcesReference Åsholt, Banhart, Ashby and Fleck12 or generated through decomposition of foaming agents, which are metal hydrides,Reference Papadopoulos, Omar, Stergioudi, Tsipas, Lefakis and Michailidis13 carbonates, and bicarbonates.Reference Mondal and Das14 Since last decade, considerable attention has been made on optimizing the process parameters for making closed cell aluminum foams with uniform cell size and greater reproducibility.Reference Cao, Wang, Ma, Zhao and Yang15,Reference Mu, Yao and Lua16 However, either in powder metallurgy or in liquid metallurgy technique, mostly metal hydrides, such as TiH2,Reference Matijasevic and Banhart17,Reference Zohar and Mehdi18 ZrH2,Reference Li, Jie, Li, Ting, Zhang and Yao19 and CaH2,Reference Mondal and Das14 are used as blowing agents that are very costly and it is yet to achieve control on decomposition of these blowing agents and uniform dispersion of the gas bubbles. In aluminum alloys, irrespective of the foaming agent, generally, 1 wt% of metal hydride is used for foaming. These are again quite expensive and make the foam too expensive to be used commercially for general engineering applications. Attempts have been made to replace hydride with calcium carbonate as a blowing agentReference Cambronero, Ruiz-Roman, Corpas and Ruiz Prieto20 for reduction of cost. It is reported that the foams made with the use of carbonate as the foaming agent provides a relatively finer cell size.Reference Cambronero, Ruiz-Roman, Corpas and Ruiz Prieto20 But, as the carbonate has higher dissociation temperature, only 30–40 wt% of carbonate gets decomposed and thus relatively higher amount of carbonate is required for foaming, which may also make the foam costly. There is also a possibility of accumulation of remaining calcium carbonate in the foam that may cause higher corrosion of the foam when exposed to corrosive environment. Thus, foaming of aluminum with carbonate as the foaming agent is yet to be established.
In addition, there is a possibility of foam drainage due to gravity through the cell wall and the plateau of the cell structures during foaming of liquid melt.Reference Gergely and Clyne21 To control or to resist foam drainage, stabilizing agents, primarily ceramic particles like SiC,Reference Wang and Shi22 Al2O3, fly ash,Reference Mondal, Goel and Das23 or Ca metal powder, are added in the melt or powder compact prior to foaming. The size of the ceramic powders are generally kept in the range of 10–20 μm and its quantity varies between 10 and 15 wt%.Reference Prakash, Sang and Embury24,Reference Kenny25 When Ca is used, its quantity is kept as 1 wt% or more.Reference Li, Jie, Li, Ting, Zhang and Yao19 The Ca powder reacts with aluminum and forms CaAlO4 or CaAl2 fine intermetallics in the melt and results in increase of viscosity of the melt, which finally resist melt drainage. Thus, during aluminum foaming through blowing agents, one requires metal hydrides or carbonates (blowing agent), ceramic particles or Ca (stabilizing agent), and aluminum melt.
In recent times, attempts have been made by Mondal et al.Reference Mondal, Das, Ramakrishnan and Bhasker26 to make Al–cenosphere syntactic foams in bulk quantity using cenosphere as space holders, through a stir casting technique. The costs of these foams are even cheaper than aluminum alloys as the cenospheres are waste products of thermal power plant and are very inexpensive.Reference Kiser, He and Zek27,Reference Balch, O’Dwyer, Davis, Cady, Gray and Dunand28 The cenosphere in the melt significantly improves the viscosity of the melt, and for better casting, one must do pressure-assisted casting. This makes us suspicious about the two facts: (i) whether cenosphere (a waste product of thermal power plant) could be used as a thickening agent and (ii) whether addition of cenosphere in the melt (which provides a large amount of microporosity) would reduce the quantity of blowing agent required for foaming. All these facts would certainly reduce the cost of the foams. But the foam so developed will have two types of pores (i) coarser cells due to entrapment of gas bubbles in the melt and (ii) micropores in the cell walls due to the presence of cenosphere. Such type of foams could be referred as hybrid metal foam. Therefore, the microarchitecture as well as deformation behavior of these hybrid foams (HFs) may be different from that of conventional foams. In fact, very limited studies have been made on synthesis and deformation behaviors of HFsReference Daoud29 and these studies are primarily confined to Zn12Al-cenosphere foams with hybrid pore structure.
The deformation behavior of aluminum foams are strong function of relative density and matrix deformation behavior. The matrix deformation behavior is again a function of heat treatment. The matrix exhibits the maximum strength and minimum ductility under the peak-aged condition. Again the age-hardening kinetics of dense matrix is noted to be different from the matrix in foam.Reference Badkul, Jha, Mondal, Das and Yadav30 Age-hardening kinetics of HF has not been examined so far to the best of our knowledge. Furthermore, effect of age hardening on the deformation behavior of aluminum cenosphere syntactic foam has not been studied so far to the best of our knowledge. It is therefore thought to identify the age-hardening kinetics of HF and its effect on their (HFs) deformation behavior. The present paper aims at (i) synthesizing the LM13-cenosphere HFs through a stir casting technique, (ii) age-hardening kinetics of these HFs, and (iii) finally to see the effect of age-hardening treatment on their deformation behavior. Attempts have also been made to predict empirically the plateau stress, densification strain, and energy absorption as a function of aging time and relative density.
II. EXPERIMENTAL
A. Synthesis of HF
Aluminum alloy (LM13) with nominal composition, Si 11.5 wt%, Fe 1.0 wt%, Cu 0.7 wt%, Mg 1 wt%, Mn 0.5 wt%, Ni 1.5 wt%, Zn 0.5 wt%, Pb 0.05 wt%, Ti 0.06 wt%, and remaining Al, was melted in an electrical resistance furnace. After cleaning and degassing the melt, preheated cenospheres (7 wt%) of size range 100–225 μm (average size 150 ± 20 μm) were incorporated in the melt through mechanical stirring. The shell thickness of cenosphere was noted to be 8 ± 2 μm. After mixing of cenosphere in the melt, dry CaCO3 powder particles of average size 15 ± 2 μm at the rate of 1.0 wt% was added in the melt again through mechanical stirring. The foaming agent was added at a temperature of 690 °C, and this temperature is maintained for another 2 min after addition of CaCo3 for foaming. Finally, the crucible with liquid foam is taken out of the furnace and force cooled with steam spraying to get hybrid LM13-cenosphere foams which are here referred as HFs.
B. Microstructural characterization
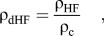
The HF samples were cut into cube samples of 25 × 25 × 25 mm and used for heat treatment and microstructural characterization. The cast- and heat-treated HF samples are first impregnated with the mounting material to avoid cell damage during polishing and then polished and etched using a standard metallographic technique. Prior to scanning electron microscope (SEM) observation, the polished and etched samples were sputtered with gold. The deformed samples were also prepared in the same way as mentioned above to examine the microstructure of HFs after deformation for better understanding of the deformation mechanism. Average cell size was measured from the digitized photographs of the HFs, and the average cenosphere size was determined from the SEM micrographs of HF samples. The average size of cenosphere was measured from at least 200 randomly selected cenospheres in cell walls/edges of HF from micrographs. The density of foam samples was measured from the dimension of sample and its weight. Relative density of HFs (ρdHF) could be calculated using the following relation:
 $${\rm{\rho }}_{{\rm{dHF}}} ={{{\rm{\rho }}_{{\rm{HF}}} } \over {{\rm{\rho }}_{\rm{c}} }}\quad ,$$
 $${V_{\rm{p}}}= 1 - {{\rm{\rho }}_{{\rm{dHF}}}}\quad .$$
The absolute porosity fraction in the HFs can also be calculated using the following relation:
 $${V_{\rm{p}}}={V_{{\rm{mp}}}}{\rm{ + }}{V_{\rm{c}}}\left( {{\rm{1}} - {V_{{\rm{mp}}}}} \right){\left( {{\rm{1}} - {t \over r}} \right)^{\rm{3}}}\quad ,$$
where ρHF is the density of HF and ρc is the density of LM13-7 vol% cenosphere shell composite, V p is the porosity fraction in HF, V mp is the fraction of macroporosity due to entrapment of gas bubbles, V c is the volume fraction of cenosphere in the cell edges or cell walls, t is the shell thickness of cenosphere, and r is the radius of cenosphere.
C. Age hardening of HFs
The cube samples were solutionized at a temperature of 485 °C for 10 h followed by water quenching. After that, the samples were artificially aged at 185 °C for varying durations (2–12 h at a regular interval of 2 h) followed by air quenching. The aged samples were then polished and etched using aforesaid methodology and then used for microstructural examination and microhardness measurements.
D. Compression test
Compression tests of HF samples of 25 × 25 × 25 mm were carried out at a strain rate of 0.01/s in an UTM (Instron model: 8801, UK). During sample preparation, it was kept in mind that at least seven cells are present along any direction of the sample. The engineering stress–strain data during the test were recorded for further analysis of the deformation behavior of the HF samples under varying aging conditions. The stress–strain curves were also used to calculate energy absorption and energy absorption efficiency of HFs.
E. Microhardness measurement
Vicker’s microhardness measurements on the HFs were carried out prior to and after deformation on polished and etched samples in an LEICA Vicker’s Microhardness Tester using an applied load of 10 gmf. These tests were conducted for examining age hardening of the HFs. For each sample, around 50 readings of microhardness were considered and the average of these values was used for analysis.
III. RESULTS
A. Materials and microstructure
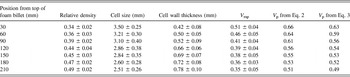
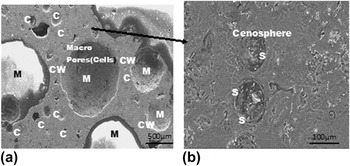
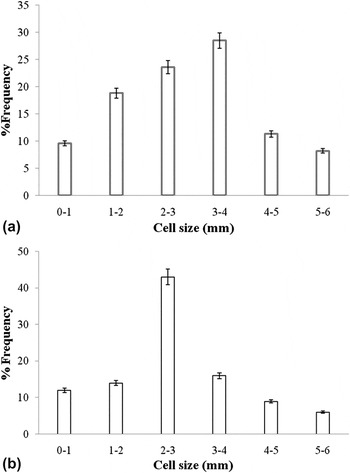
The ρdHF used in the present study is shown Table I. It was noted that HFs had different ρdHF in different locations of its billet. The ρdHF is noted to be the minimum at the top and maximum at the bottom. This is because of the fact that the top portion of billet cools at slower rate than the bottom portion and is subjected to less surrounding pressure. Because of these facts, the cell size and cell wall thickness also vary with the position in billet. These observations demonstrate that the density of HF billet, made through liquid metallurgy batch process, exhibits a density gradient from the top to the bottom. The ρdHF varies from 0.34 to 0.49. The macroporosity (V mp) (calculated through an image analyzer), and absolute porosities (V p) calculated using Eqs. (2) and (3) are also reported in Table I. The micrograph of HF [Fig. 1(a)] shows microporosity (cenospheres marked “C”) in its cell wall and macroporosity (marked as “M”) due to entrapment of CO2 gas bubbles. The average cenosphere size in the cell wall was determined from the micrographs and is noted to be ∼138 ± 12 μm which is much lower than the average size of as-received cenosphere. This is attributed to the fact that the cenosphere is not always sectioned at its equator in the sectioned plane, and a large fraction of cenosphere is sectioned at smaller diameter than its equator. Figure 1(b) exhibits spherical cenospheres embedded in the cell wall. Its average shell wall (marked “S”) thickness was noted to be ∼8 ± 3 μm. Using the value of average shell wall thickness, cell size of the as-received cenosphere, V mp and V c in the cell walls, and V p in the HF were calculated using Eq. (3). The V mp increases with decreases in ρdHF. The cell size also varies with ρdHF (Table I). The cell size distribution for relative density of 0.39 and 0.44 is shown in Figs. 2(a) and 2(b), respectively. Both these plots depict that the cell size follows a normal distribution. But there exists a wide range of variation.
The relative density, cell size, cell wall thickness, and porosity in closed cell HFs.

(a) Microstructure of HF (b) higher magnification micrograph of HF cell wall.

Cell size distribution for relative density (a) of 0.39 and (b) of 0.44.

B. Age hardening behavior
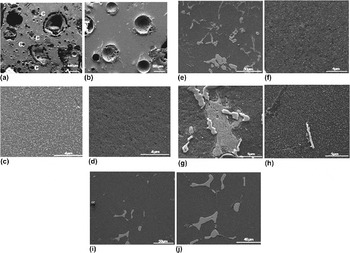
Figure 3(a) showed the microstructure of HF. It does not reveal any clear dendritic structure. The cenospheres (marked “C”) are uniformly distributed within the cell walls. Higher magnification micrograph of cell wall of as-cast HF showed the presence of eutectic silicon needles [Fig. 3(b)]. The microstructure of HF cell wall after aging for 4 h reveals initiation of fragmentation of silicon needle [Fig. 3(c)]. It further revealed precipitation of metastable phases [Fig. 3(d)]. The silicon needles fragmented to a relatively large extent when aged for 6 h [Fig. 3(e)]. After 6 h of aging, a considerable extent of precipitation of intermetallic phases took place [Fig. 3(f)]. The eutectic silicon needle fragmented more and tends to become isolated particle with increase in aging time as shown in Fig. 3(g). The microstructure of HF after aging for 8 h showed the maximum extent of fine precipitate throughout the Al-matrix [Fig. 3(h)]. Further increase of aging time to 10 h leads to growth of precipitates [Fig. 3(i)] and spherodization of silicon needles [Fig. 3(j)].
Microstructure of HF after varying aging time (a) as-cast HF; (b) higher magnification micrograph of as-cast HF; (c) and (d) after aging for 4 h; (e), (f), and (g) after aging for 6 h; (h) after aging for 8 h; (i) and (j) after aging for 10 h.

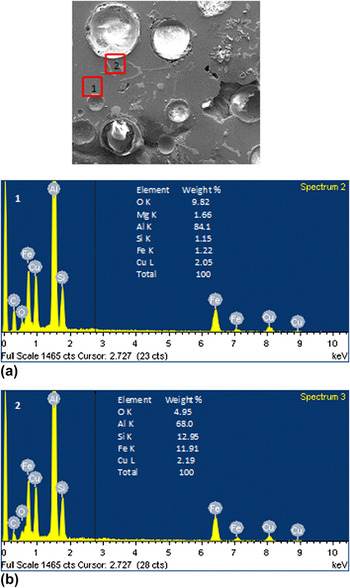
The electron dispersive x-ray (EDX) analysis of different portions in the matrix of cell wall material is carried out. Figure 4(a) showed the EDX spectrum of matrix near to the cenosphere shell. It showed the presence of Fe, Mg, and Si in addition to that of Cu. The EDX spectrum of the needles [Fig. 4(b)] near the cenosphere shell showed significantly higher amount of Si in addition to Mg, Cu, and Fe. This may be due to dissolution of Si, Mg, and Fe from the cenosphere to the matrix during the casting and solidification. It is also noted that a reasonably higher extent of silicon-rich needle is present along the cenosphere matrix interface. This is also due to dissolution of cenosphere shell in the matrix to some extent. But the matrix (alloy) also contains a very less extent of Si, Mg, Fe, and Cu. It is expected that during age hardening, there would not be any significant dissolution of elements from cenosphere shell as the aging is carried out at low temperature, and the cenospheres are very stable at this temperature. If there is any dissolution of cenosphere shell, it is only during melting and casting.
EDX analysis (a) spectrum of matrix near to cenosphere shell (b) spectrum of needles near to cenosphere shell.

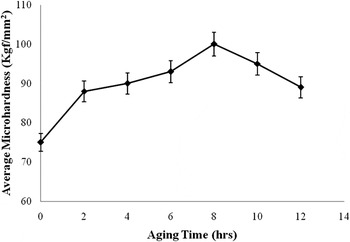
Variation of average microhardness as a function of aging time.

It is noted that the average microhardness increases significantly when solutionized HFs are aged for 2 h (Fig. 5 ). There is very marginal increase in microhardness values when HFs are aged up to 6 h. There is a sharp increase in micorhardness value when HFs are aged for 8 h. Further increase in aging time, leads to gradual decrease in microhardness values indicating peak aging time to be 8 h.
C. Compressive deformation
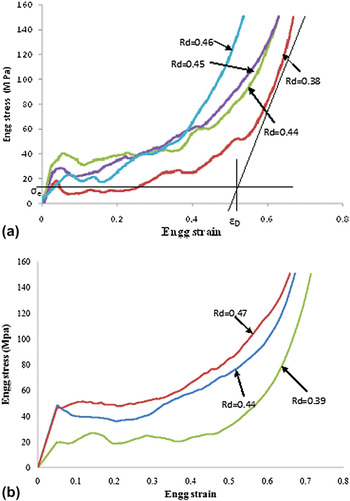
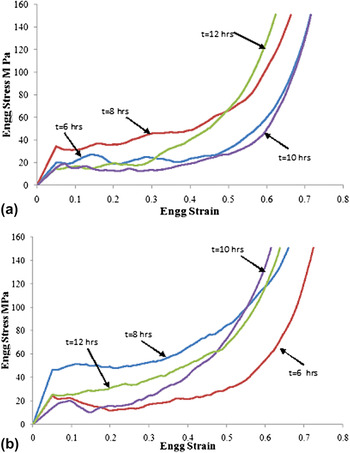
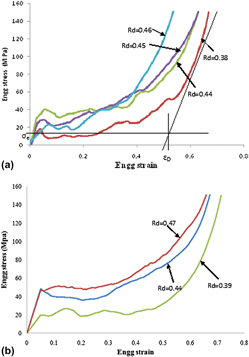
Compressive stress–strain curve of as-cast closed cell HF foam of different ρdHF is shown in Fig. 6(a). It is evident from this figure that engineering stress–strain curve of these foams is similar to those of conventional Al foam material exhibiting a linear region, a plateau region, and a densification region. The stress in the plateau region oscillates with respect to the average value, exhibiting either a positive or a negative gradient. The plateau stress (σpl) is considered as the average stress in the stress–strain curve between the elastic limit and densification strain (εD). Irrespective of ρdHF, the stress after elastic region reaches to a higher value and then reduces to a lower value, and thereafter, it starts varying in oscillating nature with strain. The εD is the strain at which the stress value starts increasing at faster rate with strain. It was quantified by the strain value corresponding to the point of intersection of the tangent at the point of sharp change in the stress with strain and the line corresponding to σpl (average stress) as shown in Fig. 6(a). This figure also indicates that σpl increases with increase in ρdHF, whereas εD decreases with ρdHF. Similar kind of plots for HFs aged for 8 h is shown in Fig. 6(b). Both these figures confirm that σpl and εD are strong function of ρdHF. The compressive stress–strain curves of HFs having ρdHF of 0.39 and 0.44 for varying aging time are shown in Figs. 7(a) and 7(b), respectively. Both these figures, in general, state that σpl is maximum when HFs are aged for 8 h and further increase or decrease in aging time leads to reduction in σpl irrespective of ρdHF. The stress–strain curves are used for determining σpl, εD, and E ab and energy absorption efficiency (η).
(a) Compressive stress–strain curve of as-cast closed cell HF at a strain rate of 0.01/s. (b) Compressive stress–strain curve of as-cast HF aged for 8 h.

(a) Compressive stress–strain curves of HFs having a relative density of 0.39 for varying aging time (b) compressive stress–strain curves of HFs having relative density of 0.44 for varying aging time.

The (E ab) and η of HFs are computed from these stress–strain curves using following relations:
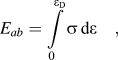 $${E_{ab}} = \int\limits_0^{{{\rm{\varepsilon }}_{\rm{D}}}} \!{{\rm{\sigma }}\,{\rm{d\varepsilon }}\quad ,}$$
where σ = flow stress of HFs,
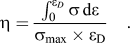 $${\rm{\eta }} = {{\int_0^{{{\rm{\varepsilon }}_D}} {{\rm{\sigma }}\,{\rm{d\varepsilon }}} } \over {{{\rm{\sigma }}_{\max }} \times {{\rm{\varepsilon }}_{\rm{D}}}}}\quad .$$
E ab was calculated by gridding the stress–strain curves up to εD with very fine grids and then its area was calculated from the area of individual grids and the number of grids in the curves. When a grid is partially (half or less) covered by the curve, the grid count is taken as half otherwise the grid count is taken as unity. σmax is the maximum stress in the stress–strain curve within the range of εD.
D. Effect of aging and relative density
1. Plateau stress
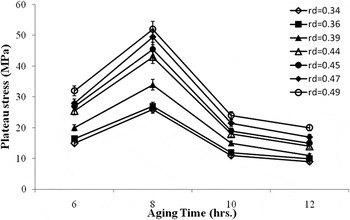
The σpl of HFs at different ρdHF as a function of aging time is shown in Fig. 8. It is evident from this figure that the maximum σpl is achieved at the peak aging, i.e., 8 h irrespective of ρdHF. Underageing or overaging leads to significantly lower σpl. This figure further demonstrates that the σpl is maximum at peak aging time of 8 h. It is further noted that σpl of HFs could be improved significantly (65–70%) by peak aging as compared with underaged condition or as-cast condition without changing the density. This is very important with respect to weight saving and performance of HFs. This figure further states that one should avoid overaging of HFs. Here, σpl is considered to be the average of the average σpl (in the region between elastic limit and densification strain) of the three samples of the same ρdHF, cell size, and cell wall thickness. The samples were classified according to their ρdHF, cell size, and cell wall thickness and then tested to examine the effect of ρdHF and aging time on the deformation behavior. Within the single sample, stress in the plateau region varies significantly ∼25–40% because of the cellular structure of the foam samples and nonuniform distribution of cell size and cell wall thickness. Therefore, for better understanding, the average stress in the plateau region for individual sample is considered as the σpl of individual sample and the average of these σpl from three test samples are used for analysis. The average of these σpl is associated with significantly less standard deviation. This is because of similar cell structure and relative density of the test samples.
Plateau stress of HFs at different relative densities as a function of aging time.

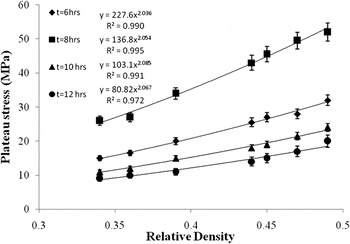
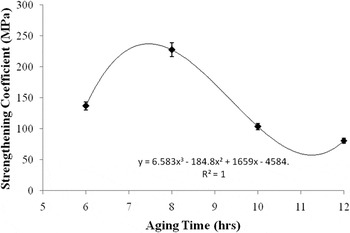
The σpl of HFs at varying age-hardened conditions is plotted as a function of ρdHF in Fig. 9. It is noted from this figure that σpl follows a power law relationship with ρdHF. The best fitted power law relationships at different aging times is also shown in this figure. It is clearly noted that the exponent of power law relations for all aging times is almost the same. But the coefficient is varying significantly with aging time. The coefficient is related to the strength of matrix (with which the foam is made of). The microhardness of matrix is noted to be a strong function of aging time and independent of ρdHF. Thus, it is expected that the coefficient would be a strong function of aging time. The coefficient of power law relations for σpl with ρdHF is plotted as a function of aging time in Fig. 10. This figure depicts that the kind of variation of these coefficients with aging time is similar to the kind of variation of σpl with aging time. The strengthening coefficient (σc) is noted to follow a third-order polynomial equation with aging time (T). This further confirms that these σc are proportional to the yield stress of dense matrix. The variation in σpl with aging time is primarily due to matrix strengthening by precipitation hardening.
 $${{\rm{\sigma }}_{\rm{c}}} = 6.58{T^3} - 184.8{T^2} + 1659T - 4584\quad .$$
Plateau stress of HFs at varying age-hardened conditions as a function of relative density.

Strengthening coefficient of power law relations for plateau stress with relative density as a function of aging time.

The unit of coefficients varies depending on their position in the equation. Thus, one can express σpl of presently investigated HFs as a function of T and ρdHF in the following form:
 $${{\rm{\sigma }}_{{\rm{pl}}}} = \left( {6.58{T^3} - 184.8{T^2} + 1659T - 4584} \right)\,{\left( {{{\rm{\rho }}_{{\rm{dHF}}}}} \right)^{2.06}}\quad \!\!.$$
The exponent to ρdHF used in the Eq. (7) is the average for all ageing times.
However, in most of the studies, the strengthening constant or proportionality constant in such power law relation is considered to be proportional to the yield stress of matrix material with the same microstructural characteristics and processing conditions. In view of this, the compression tests of 7 vol% fly ash reinforced LM13 alloy under varying heat-treated conditions are conducted. The yield strength (σd) (0.2% proof stress) of these age-hardened composites is found to be 195, 260, 185, and 170 MPa for 6, 8, 10, and 12 h of aging time, respectively. Thus, the power law relation for HFs can also be expressed in terms of following relationship:
 $${{\rm{\sigma }}_{{\rm{pl}}}} = C{{\rm{\sigma }}_{\rm{d}}}{\left( {{{\rm{\rho }}_{{\rm{dHF}}}}} \right)^{2.06}}\quad ,$$
where C is an empirical constant and it varies with aging time. Its values are calculated to be 0.69, 0.87, 0.56, and 0.48 for 6, 8, 10, and 12 h of aging time, respectively. However, it is noted that the value of “C” lies in the range as reported in the literature.Reference Hakamada, Nomura, Yamada, Chino, Chen, Kusuda and Mabuchi31
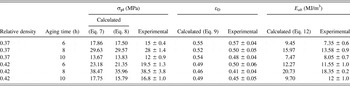
The σpl calculated using Eq. (7) has been compared with experimental values for few HFs of different ρdHF at varying aging time within the selected experimental domain. The variations between experimental and calculated values are noted to be in the range of 10%, which is quite reasonable and acceptable (Table II). Thus, by getting the value of σpl from Eq. (7), one can predict empirically the σpl of HFs within selected experimental domain as a function of ρdHF. The maximum σpl at peak aging is due to the following fact. At peak aging, the cell wall material become significantly stronger and the cell walls are relatively thin. This makes the cell wall highly brittle and thus they are collapsed without any significant plastic deformation. But, under overaged or underaged condition, the cell wall becomes relatively softer and undergoes plastic deformation to some extent prior to fracture at significantly lower σpl.
Comparison of calculated and experimental values of plateau stress, densification strain, and energy absorption at varying aging time and relative density.

It is also noted that σpl of HFs could be increased by age hardening almost by 100%, whereas the similar level of improvement could be achieved by increasing ρdHF by 50%. But improvement of σpl through increasing ρdHF of HF would add extra material cost as well as extra weight to the component of interest. Thus, it is always advantageous to give age-hardening treatment of HFs prior to its applications.
2. Densification strain
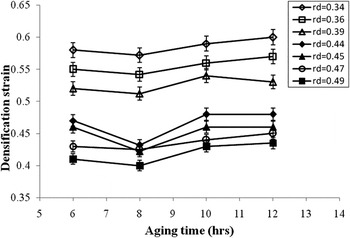
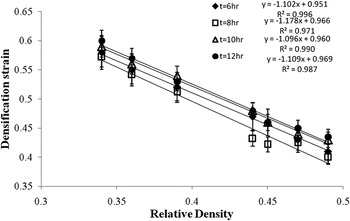
Figure 11 represents the variation of εD with aging time for HFs of different ρdHF. It is, in general, noted that HFs, irrespective of their ρdHF, showed the minimum εD at peak aging time of 8 h. The εD, in underaged and overaged conditions is noted to be marginally higher (∼5% or less) than that in peak-aged condition. This is primarily attributed to the fact that εD is related to the extent of compaction of cell walls during deformation, which is primarily related to the extent of porosity in HFs and the deformation behavior of cell walls. The extent of V c decreases with increase in ρdHF of HFs and hence it is noted clearly from this figure that ρdHF increases considerably with decreases in ρdHF. The explanation for minimum εD under peak-aged condition has been stated earlier in preceding section. As εD is directly related to ρdHF of HFs, the former one is plotted as a function of the second one in Fig. 12. This figure clearly demonstrates that the εD follows linear relationship with ρdHF:
 $${{\rm{\varepsilon }}_{\rm{d}}} = 0.96 - m\left( {{{\rm{\rho }}_{{\rm{dHF}}}}} \right)\quad .$$
Variation of densification strain as a function of aging time for HFs of different densities.

Variation of densification strain as a function of relative density of HFs for different aging times.

The above equation states that at ρdHF = 0, the εD is 96%. This is quite reasonable. In case of HFs, the cells are filled with gas, and during deformation, it is expected that the gas is being compacted in a closed chamber and it cannot be compressed by 100% under compression. It may also be due to some experimental variations. But the value is near to unity. The value “m” in Eq. (9) is noted to be the maximum in case of peak aging time. It is noted that the “m” value for 6, 8, 10, and 12 h, aging time is 1.10, 1.18, 1.11, and 1.10, respectively. However, the variation of “m” with aging time is very marginal and is in good agreement with the reported values.Reference Hakamada, Nomura, Yamada, Chino, Chen, Kusuda and Mabuchi31 The term “m” relates resistance against densification. In case of peak-aged HFs, the “m” value is marginally higher indicating marginally a less extent of densification under this condition.
The σpl of HFs is varying significantly with aging time and ρdHF. On the other hand, εD varies to a relatively less (by 15–20%) extent with ρdHF following a linear relationship and varies very marginally with aging time. Thus, it is necessary to know how the E ab of HFs varies with aging time and ρdHF.
3. Energy absorption
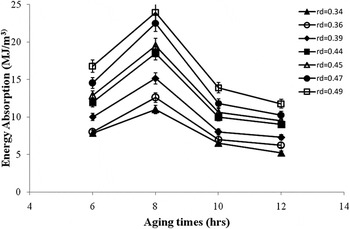
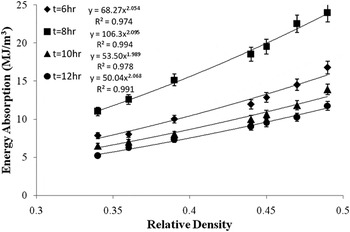
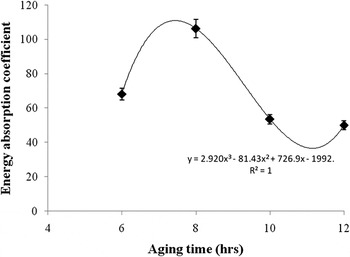
E ab of HFs as a function of aging time is depicted in Fig. 13. It is evident from this figure that the E ab of HFs increases significantly (70–100%) under peak-aged condition as compared with underaged and overaged conditions. It is further noted that E ab also increases with increase in ρdHF. It is noted that under peak-aged condition, the energy absorption of HFs increased from 11 to 24 MJ/m3 due to increase in ρdHF from 0.34 to 0.49. The energy absorption of these HFs are noted to be significantly higher than that of conventional aluminum foams. These may be due to higher ρdHF and the presence of cenospheres (micropores) in the cell wall. The E ab of aluminum foams and aluminum cenosphere syntactic foams follow power law relationships. To examine the nature of trend of variation of E ab of HFs with ρdHF, it is plotted as a function of ρdHF in Fig. 14. It is noted that E ab of HFs also follows a power law relationship with its ρdHF, which have been included in the figure itself. The relationship in general could be written in the following form:
 $${E_{ab}} = {C_1}{\left( {{{\rm{\rho }}_{{\rm{dHF}}}}} \right)^{2.005}}\quad ,$$
where the coefficient C 1 varies with aging time (Fig. 15), as it is influenced by σpl and εD. C 1 also follows a third-order polynomial relationship with aging time as mentioned in Fig. 15. If one compares Eq. (8) with Eq. (10), it could be noted that E ab can be expressed with the σpl in the form of following relation as the exponent in Eqs. (8) and (10) are almost the same:
 $${E_{ab}} = {C_2}{{\rm{\sigma }}_{{\rm{pl}}}}\quad ,$$
where C 2 is an empirical constant and takes care the influence of εD and variation of stress in the plateau region. The εD is varying marginally with aging time and to some extent with ρdHF. Thus, E ab could be approximated with the following equation:
 $$\!\!\!\!\!\eqalignb{{E_{ab}} = \,0.54{{\rm{\sigma }}_d}\left( {0.015{T^3} - 0.421{T^2} + 3.76T - 9.99} \right)\,\cr \times{\left( {{{\rm{\rho }}_{{\rm{dHF}}}}} \right)^{2.06}}\quad .$$
Energy absorption of HFs as a function of aging time for different relative densities.

Energy absorption of HFs as a function of relative density for different aging times.

Energy absorption coefficient of HFs as a function of aging time.

The above equation would give E ab within the accuracy of 15% or better. The above equation takes care of both the factor of aging time and ρdHF of HF. However, for more precise measurement, one has to measure C 1 and exponent in Eq. (10) experimentally and then use it for determining E ab.
4. Microstructure after deformation
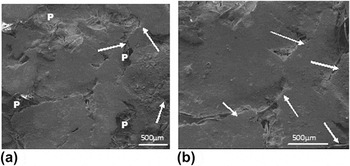
Microstructure of closed cell HFs after densification is shown in Fig. 16(a). It is evident from this figure that some pores (marked “P”) still exist after deformation of 70%, which is much more than the densification strain. This signifies that HFs are not completely densified during compression. A reasonably good fraction (∼10 ± 15%) of pores still exists. However, the shape of the cells gets changed completely from spherical to irregular. Additionally, it is noted that cell walls and edges get shared during deformation,Reference Mondal, Goel and Das23 which leads to crushing and fragmentation of cell walls [arrow marked in Fig. 16(a)]. Micrographs after deformation [Fig. 16(b)] clearly depicts the cell wall shearing and its fragmentation (marked arrow). Detailed about cell wall shearing and fragmentation have been studied by the present authors elsewhere.Reference Mondal, Goel and Das23
(a) Microstructure of HF after deformation (b) micrograph showing cell wall sharing.

IV. CONCLUSIONS
The following conclusions could be drawn from the present study:
(1) Cenosphere, a thermal power plant waste and inexpensive material, could be effectively used as the thickening agent as well as for partial replacement of the foaming agent. These could be distributed quite uniformly through a stir casting technique. These cenosphere would provide microporosity in the cell walls and/or cell edges.
(2) CaCO3 could be used effectively for foaming aluminum foams and hybrid aluminum foams.
(3) 0.6 wt% CaCO3 is sufficient to obtain moderately porous HFs if the temperature is controlled properly. Use of cenosphere and reduction in the blowing agent requirement would reduce the cost of aluminum foam.
(4) The plateau stress of closed cell HFs is a strong function of relative density and aging time. The maximum plateau stress can be obtained under peak-aged condition. Plateau stress can be expressed as a function of aging time and relative density using empirically derived equations. Plateau stress follows power law relationship with relative density.
(5) The densification strain varies marginally with aging time but to a greater extent with relative density. The minimum densification strain is noted under peak-aged condition. Densification strain follows a linear relationship with relative density.
(6) The energy absorption of HF also follows power law relationship with relative density. The maximum energy absorption is noted under peak-aged condition. The energy absorption of HF can be approximated from the measured value of plateau stress of HFs as a function of aging time and relative density.
(7) The empirically derived equation can be used for determining plateau stress and energy absorption as a function of aging time, relative density, and yield strength of the composite.
(8) Significant extent of improvement in plateau stress and energy absorption in HFs can be achieved by peak aging without changing its density. This strongly recommends for age hardening of HFs prior to their use. It can also lead to significant weight reduction of the foams to be used, which can make the component cost-effective as well as energy efficient.
ACKNOWLEDGMENT
Authors are thankful to Director CSIR-AMPRI for allowing us to publish this work.