I. INTRODUCTION
Tin (Sn) is a promising anode material candidate for lithium-ion battery because it has much higher capacity than the traditional graphite, but it suffers from the severe volume change during the lithium intercalation and deintercalation. Reference Li, Wang, Chen and Huang1–Reference Nithyadharseni, Reddy, Nalini, Kalpana and Chowdari4 In the past decades, morphology design has been proved critical for the performance improvement of the Sn anodes. Reference Yu, Chen and Shi5–Reference Liang, Li, Hou, Zhang, Zhu, Yan and Qian8 Among various kinds of specific nanostructures like nanotubes, Reference Zhu, Xia, Liu, Fan, Chao, Zhang and Fan9 hollow Reference Kong, Wong, Zhang, Tan, Li and Lu10,Reference Zhang, Liang, Gao, Ding, Yang, Yu and Li11 and core–shell fibers, Reference Jeong, Kim, Park, Seo, Hwang, Kim, Kim, Kim and Dou12,Reference Wu, Qin, Miao, He, Liang, Zhou, Liu, Han, Li and Kang13 porous nanofibers with large surface areas show us very promising cycling stability, Reference Zhang, Wang, Hong, Li, Jin and Chen14–Reference Kennedy, Mullane, Geaney, Osiak, O’Dwyer and Ryan16 because the porous structure provides an additional “buffer zone” to allow the volume fluctuation of the reactants and accommodate the volume expansion of the electrode. Reference Fritsch, Rose, Wollmann, Böhlmann and Kaskel17,Reference Saikia, Wang, Chou, Fang, Tsai and Kao18 Nevertheless, it still needs to explore the underlying mechanism to overcome either the unsatisfactory performance or the complicated preparation processes.
Recently, electrospinning combined with subsequent thermal treatment is becoming one of most appealing approaches for fabricating structured electrode materials with different morphologies because of its superior designability and high scalability. Reference Li, Guo, Ji, Lin, Xu, Liang, Zhang, Toprakci, Hu, Alcoutlabi and Zhang19–Reference Huang, Zhang, Kotaki and Ramakrishna21 Generally speaking, the properties of precursors and the thermal treatment parameters are the key factors to obtain the desirable morphology for achieving desired electrochemical performance. Reference Liu, He, Ma, Liang, Zhao and Fong22–Reference Raza, Yu, Zhai, Sun, Ding, Ding and Yu24 However, a systematic study of the formation mechanism behind the morphological variation and its relationship with the electrochemical preference are rarely reported. In our previous work, stable cycling performance was obtained by imbedding SnSb nanoparticles into carbon and then dispersing them in porous carbon nanofibers. Reference Niu, Zhou, Li, Shan and Xia25 The one-dimensional fibrous and porous structure plays an important role in buffering the volume change of SnSb nanoparticles. Based on this strategy, further work on the morphology control is urgently needed.
In view of this point, herein, we fabricated SnSb/C hybrid nanofibers via electrospinning and subsequent carbonization using different SnSb precursors with widely varied chemical and physical properties. In addition, the effect of carbonization temperature was also investigated to obtain porous SnSb/C nanofibers with high surface areas. More importantly, a typical and simple fabrication method for porous SnSb/C nanofibers was exploited which was closely related to the types of SnSb precursors and the carbonization condition. The structure-electrochemical performance relationship was investigated in terms of specific capacity, cycling stability, as well as tracking the morphological/structural change of anodes at different reaction stages.
II. EXPERIMENTAL SECTION
A. Materials
Polyacrylonitrile (PAN, M w = 150,000 g/mol) and Sn0.92Sb0.08O2.04 powders (0.92SnO2·0.04Sb2O5, <50 nm particle size, ≧99.5%) were purchased from Aldrich Chemistry (USA). Tin acetate [Sn(CH3COO)2] and antimony acetate [Sb(CH3COO)3] were obtained from Alfa Aesar Company Inc (USA). Tin chloride dehydrate (SnCl4·5H2O), antimony chloride (SbCl3) and N,N-dimethylformamide (DMF) were purchased from Sinopharm Chemical Reagents Co (China). All materials were used as received.
B. Preparation of SnSb precursor/PAN nanofibers
Sn0.92Sb0.08O2.04 powders, Sn(CH3COO)2/Sb(CH3COO)3 and SnCl4·5H2O/SbCl3 were used as SnSb precursors, respectively. PAN acted as a carbon precursor. Electrospinning solutions were prepared by dissolving PAN in DMF, followed by the dispersion of SnSb precursors. For comparison, the molar mass proportion of Sn and Sb was kept the same as 0.92:0.08 in the three different SnSb precursors. The concentrations of PAN and SnSb precursors in the final solutions were 8 wt% and 4 wt%, respectively. Strong mechanical stirring was applied at 60 °C for 48 h prior to electrospinning. The electrospinning process was carried out with 0.6 mL/h flow rate, 20 cm needle-to-collector distance, and 18 kV voltage.
C. Preparation of SnSb/C nanofibers
Electrospun precursor nanofibers, i.e., Sn0.92Sb0.08O2.04/PAN, Sn(CH3COO)2/Sb(CH3COO)3/PAN and SnCl4·5H2O/SbCl3/PAN nanofibers, were first stabilized in air at 280 °C for 7 h (heating rate was 5 °C/min) and then carbonized at 800 °C for 2 h in nitrogen gas (heating rate was 2 °C/min) to form Sn0.92Sb0.08/C nanofibers with different structures and morphologies. Moreover, Sn0.92Sb0.08O2.04/PAN nanofibers were carbonized at 600 °C and 800 °C to investigate the mechanism of porous formation.
D. Material characterizations
The morphologies of as-spun precursor nanofibers and carbonized Sn0.92Sb0.08/C nanofibers were characterized using field emission scanning electron microscope (FE-SEM; Hitachi S4800, Hitachi Corp., Tokyo, Japan) and transmission electron microscope (TEM; Hitachi H600, Hitachi Corp.). The crystallographic and chemical structures were studied using X-ray diffraction (XRD; Bruker D8 GADDS, Bruker Corporation, Karlsruhe, Germany) with Cu Kα radiation between 20 and 70° at a scan rate of 5° min−1. Thermogravimetric analysis (TGA; NETZSCH STA449 F3, NETZSCH Group, Selb, Germany) was carried out with a heating rate of 10 °C/min in air. Elemental analyzer (CHN 2400, PerkinElmer, Waltham, Massachusetts) was used to determine the composition of the nanofibers. The specific surface area was analyzed using the Brunauer–Emmett–Teller (BET) nitrogen adsorption method (Micromeritics TriStar 3000, Micromeritics, Norcross, Georgia). The pore size distribution was determined by the Barrett–Joyner–Halenda (BJH) method.
E. Electrochemistry
Electrochemical performance was evaluated by using lithium-ion half cells (2032 coin cells). Working electrodes were prepared by the traditional slurry coating process. The slurry was made by mixing 80 wt% Sn0.92Sb0.08/C nanofibers and 20 wt% polyamideimide (PAI) binder in N-methylpyrrolidinone. No additional conductive carbon additive was used for preparing the electrodes. The counter electrode was lithium ribbon (99.9%, Aldrich). The electrolyte used was 1 M LiPF6/ethylene carbonate (EC) + dimethyl carbonate (DMC) + diethyl carbonate (DEC) (1:1:1 by volume, MTI Corporation). The cells were assembled in a high-purity argon-filled glove box. Cyclic voltammetry (CV) measurements were conducted with a Gamry Reference 600 between 2.7 and 0.02 V with a scan rate of 0.05 mV/s. Charge/discharge test was performed using a LAND CT2001A battery testing system (AMETEK Land, Leicester, United Kingdom).
III. RESULTS AND DISCUSSION
A. Pore-forming process of SnSb/C nanofibers derived from electrospun Sn0.92Sb0.08O2.04/PAN nanofibers
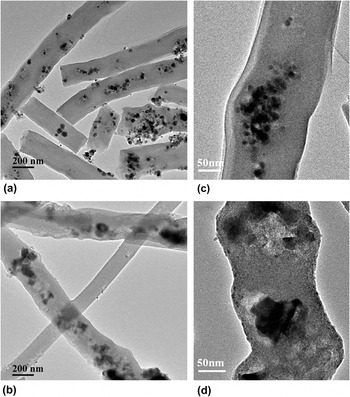
The Sn0.92Sb0.08O2.04/PAN nanofibers carbonized at 600 and 800 °C were first studied to explore the pore-forming process. Figure 1 shows the morphology of Sn0.92Sb0.08/C nanofibers after being carbonized at different temperatures. With the carbonization temperature increasing from 600 °C to 800 °C, the scattered nanoparticles become gathered but more pores around themselves are formed, as well as along the fibers [Figs. 1(a) and 1(b)]. What’s more, the irregular surface of the fibers can be easily observed after carbonization at 800 °C. Close inspection by high-magnification TEM images in Figs. 1(c) and 1(d) further reveal the morphology change.
TEM images of SnSb/C nanofibers carbonized at 600 °C (a and c), and 800 °C (b and d).

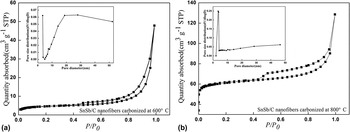
The pore-forming process is further investigated by the BET nitrogen gas adsorption/desorption method. Figure 2 shows nitrogen adsorption/desorption isotherms of SnSb/C nanofibers carbonized at 600 °C and 800 °C, respectively. Both of them can be characterized as type IV isotherm according to the International Union of Pure and Applied Chemistry (IUPAC) classification, which indicate the presence of slit-shaped mesopores. Reference Sing26 It is noteworthy that the specific surface area increase significantly from 16.55 m2/g to 212.85 m2/g and the average pore size decrease from 29.56 nm to 18.98 nm when increasing the carbonization temperature from 600 °C to 800 °C. Additionally, the pore size distribution is found to be centered around 10 nm at 800 °C, comparing with the broad range of pore diameter at 600 °C, which is responsible for the decreased average pore diameter. It gives evidence that the mesoporous SnSb/C nanofiber is built by carbonization of Sn0.92Sb0.08O2.04/PAN nanofibers above 600 °C.
Nitrogen adsorption/desorption isotherms of SnSb/C nanofibers carbonized at different temperatures. There insets are the corresponding BJH pore size distributions.

B. The morphological variation and formation mechanism of SnSb/C nanofibers
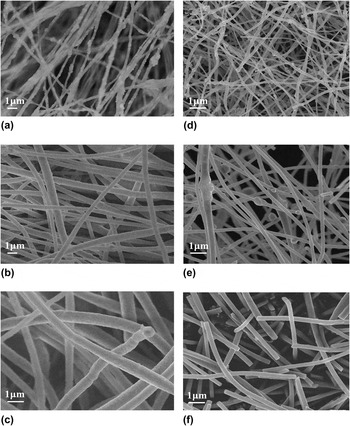
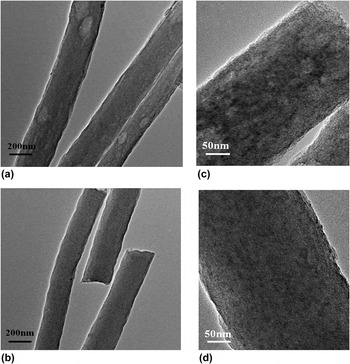
To better understand the porous formation mechanism of SnSb/C nanofibers fabricated by electrospinning and carbonization, Sn(CH3COO)2/Sb(CH3COO)3 and SnCl4·5H2O/SbCl3 were also used as SnSb precursors to identify critical parameters that influence the morphology evolution of SnSb/C nanofibers. For comparison, the molar ratio of Sn and Sb was kept the same as that of Sn0.92Sb0.08O2.04 nanoparticles (i.e., M Sn:M Sb = 0.92:0.08). The resultant nanofibers are denoted as SnSb/C (I) nanofibers for those derived from Sn0.92Sb0.08O2.04/PAN precursor, SnSb/C (II) nanofibers for those from Sn(CH3COO)2/Sb(CH3COO)3/PAN precursor and SnSb/C (III) for those from SnCl4·5H2O/SbCl3/PAN precursor, respectively. From Fig. 3(a), it is seen that the surface of Sn0.92Sb0.08O2.04/PAN nanofibers is uneven. With the assistance of carbon in enclosing Sn0.92Sb0.08 nanoparticles within the fibrous structure after carbonization, the nanoparticles aggregate and assemble with open pores around them, leading to the uneven surface [Figs. 1(b) and 3(d)]. Similarly, electrospun Sn(CH3COO)2/Sb(CH3COO)3/PAN nanofibers show spindle-like protrusion along the fibers and then the morphology transform to the uneven ones after carbonization, which is similar to that of SnSb/C (I) nanofibers [Figs. 3(b) and 3(e)]. Typically, brightness and darkness are alternately appeared in the fibers, which is observed in TEM [Figs. 4(a) and 4(c)], and it possess a high BET surface area of 74.6 m2/g to prove the porous property of SnSb/C (II) nanofibers (see Fig. S1). It must be noted that the porous SnSb/C (II) nanofibers were fabricated without any pore template addition, comparing with that in Ji’s work on fabricated SnSb-porous carbon nanofibers using PMMA as a pore-forming template. Reference Ji, Gu, Shao, Li, Engelhard, Arey, Wang, Nie, Xiao, Wang, Zhang and Liu27 SnCl4·5H2O/SbCl3/PAN precursor shows relatively smooth surface, as shown in Fig. 3(c). It is probably because SnCl4·5H2O and SbCl3 are soluble in DMF, while the other precursors are only dispersed into DMF. Upon evaporation of DMF during electrospinning, pre-dissolved SnCl4·5H2O and SbCl3 are able to disperse uniformly in the PAN matrix. The uniform darkness of SnSb/C (III) nanofibers observed by TEM images [Figs. 4(b) and 4(d)] indicates that SnSb alloy is distributed uniformly in the fiber matrix.
SEM images of different precursor nanofibers: (a) Sn0.92Sb0.08O2.04/PAN nanofibers, (b) Sn(CH3COO)2/Sb(CH3COO)3/PAN nanofibers, (c) SnCl4·5H2O/SbCl3/PAN nanofibers, (d), (e) and (f) are SnSb/C (I), SnSb/C (II) and SnSb/C (III) nanofibers obtained by carbonization of (a), (b) and (c) at 800 °C, respectively.

TEM images of SnSb/C (II) nanofibers (a and c), and SnSb/C (III) nanofibers (b and d).

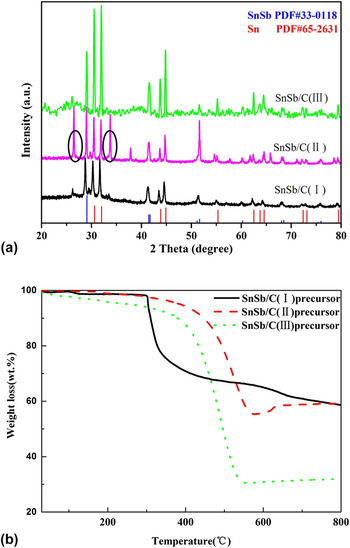
Figure 5(a) shows the XRD pattern of SnSb/C nanofibers derived from Sn0.92Sb0.08O2.04 nanoparticles, Sn(CH3COO)2/Sb(CH3COO)3 and SnCl4·5H2O/SbCl3. All three SnSb/C nanofibers exhibit major peaks of crystalline SnSb and Sn phases that match with JCPDS 33–1180 and JCPDS 65–2631, respectively. For SnSb/C (II) nanofibers, small peaks related to SnO2 are clearly visible (seen the ovals), indicating that not all the Sn components are reduced completely when Sn(CH3COO)2/Sb(CH3COO)3 was used as the precursor. Reference Hassoun, Derrien, Panero and Scrosati28 The carbon contents in the hybrid nanofibers are estimated from their TGA curves [Fig. 5(b)]. Results show that the actual carbon contents are 41, 41 and 68 wt% for SnSb/C nanofibers derived from Sn0.92Sb0.08O2.04, Sn(CH3COO)2/Sb(CH3COO)3 and SnCl4·5H2O/SbCl3 precursors, respectively. The higher carbon content in SnSb/C (III) nanofibers, derived from SnCl4·5H2O/SbCl3, is attributed to partial evaporation of SnCl4·5H2O/SbCl3 during carbonization. In addition, Sn0.92Sb0.08O2.04/PAN nanofibers present a sharp drop at 300 °C, which is much lower decomposition temperature than those in Sn(CH3COO)2/Sb(CH3COO)3/PAN and SnCl4·5H2O/SbCl3/PAN nanofibers, indicating that CO2 gas evolved with the phase transition of Sn0.92Sb0.08O2.04 nanoparticles to SnSb at 300 °C. It provides an appropriate condition to trace the nanoparticle motion, leading to the formation of pores around and along the particle pathways, as demonstrated in Fig. 1(b).
(a) XRD patterns of SnSb/C nanofibers and (b) TGA curves of SnSb/C precursors nanofibers.

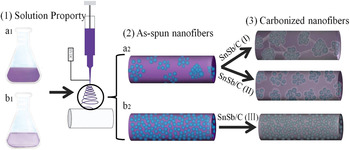
A possible formation mechanism of porous SnSb/C nanofibers could be described as follows based on the study. It is noticed that the morphology of as-spun nanofibers and the initial decomposition temperature act interdependently to divide carbonized SnSb/C nanofibers into three different structure characteristics: (1) For SnSb/C (I) nanofibers, the crystal transformation begun at around 300 °C, accompanied by CO2 gas evolution that acted as a template causing the formation of the pores around the SnSb particles. Reference Xue, Xia, Tucker, Fu, Zhang, Li and Zhang29 Moreover, the pores also appeared along the fiber matrix due to the SnSb nanoparticle movement and aggregation at high temperatures (Fig. 6 a1, a2 and SnSb/C (I) nanofibers). (2) For SnSb/C (II) nanofibers, the crystal transformation begun at around 550 °C. There was insufficient CO2 gas evolution prior to the aggregation of nanoparticles, and as a result, the pores are created inside the matrix, just around the SnSb particles (Fig. 6 a1, a2 and SnSb/C (II) nanofibers). (3) For SnSb/C (III) nanofibers, SnCl4·5H2O/SbCl3 precursor cannot produce CO2 gas during the carbonation, and hence uniform nanofibers are formed without the presence of pores (Fig. 6 b1, b2 and SnSb/C (III) nanofibers).
Schematic diagrams for the synthetic procedure of SnSb/C nanofibers with different morphologies.

C. Electrochemical performance of SnSb/C nanofibers derived from different precursors
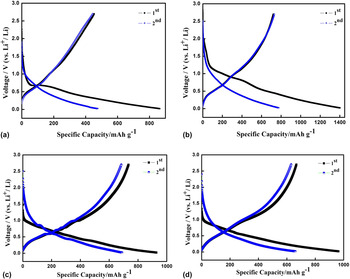
To investigate the effect of nanofiber structure on the electrode performance, SnSb/C nanofibers derived from different precursors were tested in lithium-ion half-cells and the charge–discharge curves are shown in Fig. 7. For all the samples, it revealed multiple sloping lithiation reactions at around 0.4 V–1.1 V during the first charge–discharge cycle, which indicate the contribution of Sn and/or Sb to the allying reaction. What’s more, the broad peak around 1.1 V is also assigned to the formation of a SEI layer in amorphous carbon composite nanofibers due to their low graphitization degree. Reference Liu, Hu, McDowell, Jackson and Cui30 The initial discharge and charge capacities are 865 and 454 mAh/g, 1402 and 721 mAh/g, 928 and 734 mAh/g, and 963 and 667 mAh/g for SnSb/C (I) nanofibers carbonized at 600 °C, SnSb/C (I) nanofibers carbonized at 800 °C, SnSb/C (II) nanofibers, and SnSb/C (III) nanofibers, corresponding to initial coulombic efficiencies of 52.5%, 51.4%, 79.1% and 69.3%, respectively. And the different morphologies result in different electrochemical performance in the first cycle. It is worth noting that SnSb/C (I) nanofibers were composed of 0D SnSb nanoparticles and 1D composite nanofibers. It is easy observed the dark SnSb nanoparticles encapsulated in the SnSb/C (I) nanofibers despite of the carbonization temperatures (Fig. 1), resulting in lithium insertion that first took place in the outside of amorphous carbon. However, electrospun nanofiber with layer structure hindered the extraction of lithium from the carbon, so it showed the lower initial coulombic efficiency. While SnSb/C (II) nanofibers and SnSb/C (III) nanofibers exhibited relatively homodispersed SnSb in composite nanofibers (Fig. 4), they provide the similar opportunity for SnSb alloy and carbon reacted with lithium to get the high initial coulombic efficiencies.
Charge–discharge profiles of SnSb/C nanofibers between 0.02 and 2.7 V versus Li+/Li at a current rate of 50 mA/g: (a) SnSb/C (I) nanofibers carbonized at 600 °C, (b) SnSb/C (I) nanofibers carbonized at 800 °C, (c) SnSb/C (II) nanofibers, and (d) SnSb/C (III) nanofibers.

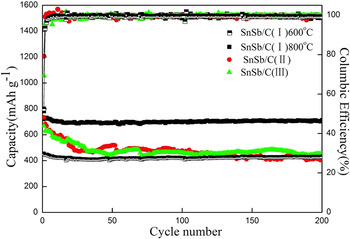
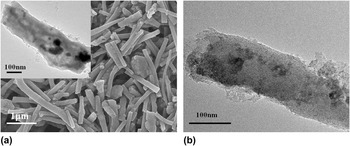
The cycling performance of SnSb/C nanofibers derived from different precursors is shown in Fig. 8. After 200 cycles at the rate of 50 mA/g, the capacity retention is about 95%, 99%, 56% and 68% for SnSb/C (I) nanofibers carbonized at 600 °C, SnSb/C (I) nanofibers carbonized at 800 °C, SnSb/C (II) nanofibers, and SnSb/C (III) nanofibers, respectively. In addition, all four SnSb/C nanofibers maintain high coulombic efficiencies of 99% from the 10th cycle. For SnSb/C (I) nanofibers, when lithium insertion kept a dynamic balance in amorphous carbon after several cycles, SnSb alloy takes over the dominant material to insertion/extraction of lithium. At this moment, carbon nanofiber with its considerable flexibility counteract the pulverization of electrode. Especially, SnSb/C (I) nanofibers carbonized at 800 °C has the porous structure with the highest special surface area among all the samples, which formed a three-dimensional network structure when used as anode [Fig. 9(a)] and also maintains porous nanofibers after 200 cycles [Fig. 9(b)], comparing with the as-prepared one [inset in Fig. 9(a)]. They effectively increase the contact area between electrode and electrolyte and facilitate the rapid Li+ ion transport, guaranteeing the stable cycling performance. While SnSb/C (II) nanofibers, although they exhibit an excellent initial coulombic efficiency, they also have the worst cycling performance among those four samples, which is attributed to the insufficient pore formation. Comparing with SnSb/C (II) nanofibers, SnSb/C (III) nanofibers were composed of smaller SnSb nanoparticles and uniform dispersion, so as to hold a complete morphology during a long cycling test. Reference Tirado31
Cycling performances of SnSb/C nanofibers anode derived from different precursors between 0.02 and 2.7 V versus Li+/Li at a current rate of 50 mA/g.

(a) SEM image of SnSb/C (I) nanofiber (800 °C) anode, inset is TEM image, and (b) TEM images of SnSb/C (I) nanofiber anode after 200 charge/discharge cycles at a current density of 50 mA/g and a voltage window of 0.02–2.7 V versus Li+/Li.

IV. CONCLUSIONS
Using the same electrospinning procedure but the different SnSb precursors, homogeneous-dispersed and porous SnSb/C nanofibers with differenet morphologies were formed. While the more uniform distribution of SnSb in carbon nanofibers could be obtained when use SnCl4·5H2O/SbCl3 as the SnSb precursor, and the pre-dissolved SnSb precursors in electrspun solution are responsible for disperse uniformly in the nanofiber matrix. A better porous structure can be obtained when use Sn0.92Sb0.08O2.04 nanoparticles as the SnSb precursor, which is approved more beneficial to the cycling performance when being used as lithium ion battery anode. An excellent capacity retention (99%) for 200 cycles was obtained due to the synergic effect of the SnSb/C composite nanofibers and the porous structure.
Supplementary Material
To view supplementary material for this article, please visit https://doi.org/10.1557/jmr.2016.508.
ACKNOWLEDGMENTS
This research was supported by National Natural Science Foundation of China (No. 51163014), The Training Project of High-tech Youth Talents in Xinjiang Province, The Starting Foundation for Doctor at Xinjiang University, The Innovated Research Program for Xinjiang Graduate Students (No. XJGRI2015033) and China Scholarship Council for the State Scholarship Fund.