

Latin American fiscal policy presents a stark challenge to standard analytical models of political economy. Most importantly, since about 1990 the combination of drastic inequality, electoral democracy, and weak redistributive efforts appears to contradict the economists’ workhorse, the median-voter model, which predicts significant fiscal redistribution under these conditions (Meltzer and Richard, Reference Meltzer and Richard1981; Profeta and Scabrosetti, Reference Profeta, Scabrosetti, Bernardi, Barreix, Marenzi and Profeta2008: 70–71; Huber and Stephens, Reference Huber and Stephens2012).Footnote 1 However, recent innovations – a “basic universalism” in social welfare and a couple of progressive tax reforms – might be thought to bring the region more in line with the model's predictions, or perhaps those of other approaches. In short, this field could benefit from theoretical clarification. This paper evaluates the performance of median-voter and several other models in an attempt to explain longstanding differences in fiscal policy. It compares Latin America with other world regions, first and mainly, before examining variation across the region. It then turns its attention to the new developments in policy.
Here are its arguments in brief. When considering the long arc of Latin American fiscal development, the median-voter model is hard to apply because its most important premise, a capable state, has been historically rare. We might attempt to rescue the model by attributing its failure to fiscal inertia, institutional barriers, or the consequences of capital mobility (all of which have been suggested in the literature). But these adjustments – even for capital mobility, surprisingly – perform less well than do other approaches focused on the effects of world wars on combatant countries (Scheve and Stasavage, Reference Scheve and Stasavage2016) or oligarchical domination on Latin American states (Winters, Reference Winters2011). Looking at variation across the region, a fiscal-contract model, by which taxpayers obtain a policy or institutional compensation from the state (Levi, Reference Levi1988; Timmons, Reference Timmons2005), appears to account best for key differences. It suggests a connection between early state-building moments in Chile and Uruguay (Kurtz, Reference Kurtz2013) to recent successes at progressive tax reform. Finally, taking these reform experiences alongside the region-wide embrace of conditional cash transfers, non-contributory pensions, and other elements of “basic universalism” (Filgueira et al., Reference Filgueira, Molina, Papadopulos, Tobar and Molina2006), we might finally be seeing a small step toward the expectations of the median-voter model--but a similar result would also follow from a fiscal-contract logic in countries with heavy consumption taxes.
The paper connects with several literatures. It addresses theories of fiscal policy and political change, both globally and in Latin America (Boix Reference Boix2003; Acemoglu and Robinson, Reference Acemoglu and Robinson2006; Bird and Zolt, Reference Zolt2015). It seeks to complement comparative studies of regimes (Winters, Reference Winters2011) and Latin American social policy (Sokoloff and Zolt, Reference Sokoloff, Zolt, Edwards, Esquivel and Márquez2007; Huber and Stephens, Reference Huber and Stephens2012) with an additional focus on taxation and its relationship to politics. It parallels important recent work on autocracy, state capacity, and land reform (Albertus, Reference Albertus2015). It also builds upon important recent studies of tax politics (Mahon et al., Reference Mahon, Bergman and Arnson2015; Fairfield, Reference Fairfield, Mahon, Bergman and Arnson2015a, Reference Fairfield2015b) and historical work on state formation in Latin America (e.g., Kurtz Reference Kurtz2013; Soifer Reference Soifer2015).
This paper is structured into four parts. The first describes Latin America's distinctive fiscal profile, which has historically included exceptionally weak property and personal income taxation as well as meager efforts at pro-poor spending. Still considering historical patterns, the second section considers the median-voter model, asking if it could be rescued by adding empirical premises, and evaluating one of these in particular (capital mobility) at length. Next comes a discussion of alternative theories that focus on power resources or frame fiscal politics in relational terms, as processes of compensation or bargaining. The fourth part considers recent trends in the region, and the paper then concludes.
1. The historical distinctiveness of Latin American taxation and social spending
1.1 Taxation
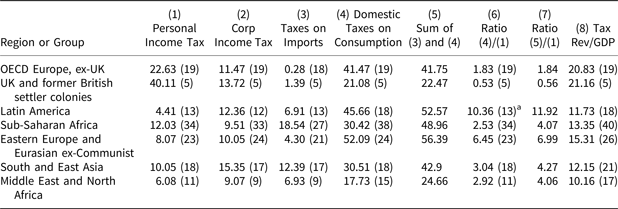
Compared with other regions, Latin America has long had a characteristic fiscal profile, which is most distinctive on the tax side of the ledger. The first four columns of Table 1 show the percentages of total revenue supplied by income, import, and consumption taxes for seven groups of countries for the 2000–10 period, using a new dataset compiled by the International Centre for Tax and Development (ICTD). Latin America is by far the lowest on personal income taxes (PIT) and one of the highest on consumption taxes.Footnote 2 Its ratios (Columns 6 and 7) of consumption tax revenues to PIT revenues are the highest of any region. As we can see, especially when we look across developing-country regions (bottom five rows), these ratios tell a different story than does Column 8, which shows tax revenues as a proportion of GDP, a common measure of general state capacity. In addition, receipts from real estate taxes (not shown) averaged only 0.33–0.37% of GDP in the 2000s – about half the amount collected by other developing countries and only one-sixth of the average reported by the Organization for Economic Cooperation and Development (OECD).Footnote 3 In sum, two taxes that are considered the most likely to be strongly progressive in their impact – personal income and real estate taxes – are remarkably weak in Latin America, while consumption taxes, usually regressive on balance, play a notably important role.
Regional averages of relative weights of personal income, corporate income, import tariffs, and consumption taxation in total central-government revenues, percent, 2000–10 (Columns 1–7); tax revenues as a percentage of GDP (Column 8)

Number of observations in parentheses.
a Average consumption tax percentage of total revenue divided by average personal income tax percentage of revenue for the 13 countries with data for both: Bol, Bra, Chi, Col, CR, DR, Gua, Hon, Mex, Pan, Par, Per, Uru.
Source: International Centre for Tax and Development (ICTD) database, available at http://www.ictd.ac/en/about-ictd-government-revenue-dataset.
The region's overwhelming reliance on consumption taxes has been remarkably consistent over the past two centuries. After Independence, liberal idealists in Spanish America favored the “direct contribution,” basically a proportional property tax, but they failed due to weak administration and the opposition of big landlords (Burgin, Reference Burgin1946: 47–48, 188–90; Pinto, Reference Pinto2012: 54; Sánchez Román, Reference Sánchez Román2014: 2). As a result, the main pillar in the fiscal edifice of nineteenth-century Latin American states was an indirect and regressive tax, the import tariff.Footnote 4 Partial exceptions were Chile and Uruguay, where governments did manage to impose some (direct) taxation of property and inheritances, as part of a process of liberal, elite-controlled state-building (Finch, Reference Finch1981: 93; Kurtz, Reference Kurtz2013: 90, 117–22, 178; Soifer, Reference Soifer2015: 164). But tariffs still provided most of the revenue in these countries.
Across the region, the reliance on indirect taxation largely persisted throughout the twentieth century, even as development strategies changed repeatedly and drastically. In the 1960s the US Alliance for Progress sought to fortify the income tax on individuals and companies (Sommerfeld, Reference Sommerfeld1966), but these efforts generally failed, leaving systems that were complicated, inefficient, and unprogressive (Best, Reference Best1976: 49; Bird Reference Bird1992; Zolt and Bird, Reference Zolt and Bird2005, 31–35). After about 1965 came the wave of “neoliberal” reforms, which simplified tax codes, reduced rate progressivity, strengthened tax administration, cut trade duties and, most emblematically, instituted or expanded the VAT (Bird, Reference Bird1992; Shome, Reference Shome1995; Mahon, Reference Mahon2004). The neoliberal makeover was not a total one, as VATs commonly exempted items of mass consumption, and various heterodox taxes were later added to the mix. Over time, then, the form (and economic efficiency) of indirect taxation has changed, but its fundamental importance to the fisc has not.Footnote 5
1.2 Expenditure
On the spending side, Latin American countries also redistribute less than the median-voter model would predict. Historically, governments spent little on public education or health until the twentieth century. While several states did establish relatively large social-insurance programs for urban wage and salary earners beginning in the 1920s (Wibbels and Ahlquist, Reference Wibbels and Ahlquist2011), explicitly pro-poor transfers were much less common and arrived later. Many governments did come to subsidize motor fuels, cooking gas, and public utilities, mainly out of a fear of political unrest if they dared to adjust prices to inflation. (New forms of social spending have appeared in the region but as we will discuss later, they do not affect the overall picture very much.)
1.3 Net effects measured
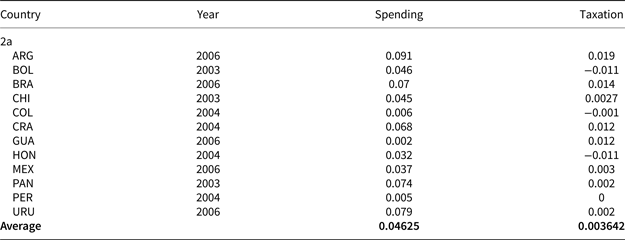
To see the redistributive effects of Latin American fiscal policy in perspective, let us compare estimates from household income surveys of the region and the OECD. Table 2 shows Reynolds-Smolensky (RS) indices (changes in the Gini coefficient, by convention positive for increases in equality) for fiscal flows among Latin American countries (left table) and OECD countries (right table) in the mid-2000s. Note that the Latin American country data include all spending, while the OECD list shows transfers only. The first, broader category includes some in-kind items that are unequalizing (such as free university tuition) but many others that reduce inequality. We get some idea of their relationship by looking at Chile (CHL), the only country present in both tables, where the RS index for spending in 2003 (left table, 0.045) is three times the index for transfers only in 2007 (0.015) in the right table.
Reynolds-Smolensky indices (negative change in Gini coefficient) for taxation and spending (Latin America), 2a, or taxation and transfers (OECD), 2b

All OECD figures are from 2007. Bold is used to provide contrast for average values and to highlight significant coefficients
From Mahon (Reference Mahon2012), Table 1.
Source: for Latin America, various, see tabulation in Mahon (Reference Mahon2012)

Source: OECD 2016.
Several patterns emerge from the data. Consistent with the story above, the effect of taxation on income distribution barely registers, on average moving the Gini only 0.004 (on a scale of 1.000). The average effect of taxation in the OECD is about nine times this margin. Also consistent with world experience (outside the USA), spending equalizes incomes over 12 times more than does taxation. Yet this difference is dwarfed by the effect across the OECD. Even considering only transfers, these countries, on average, reduced inequality by these measures by nearly twice as much as the Latin American average effect for all social spending. In sum, like the OECD, around 2005, Latin American governments redistributed more via expenditure than through taxation; but unlike the OECD, in Latin America taxes had almost no effect and spending was only weakly equalizing (see also Molina, Reference Molina2006; Huber and Stephens, Reference Huber and Stephens2012: Chap. 6; CEPAL/Oxfam, 2016).
2. The median-voter model: adjust or discard?
The patterns described above diverge significantly from the expectations of the median-voter model.Footnote 6 It says that taxation and spending are all about redistribution to a ruling group, whether this is a tiny elite under an oligarchy or the majority under an electoral democracy. Because the median voter is poorer as a government becomes more democratic and a society more unequal, so will democracy and inequality make downward redistribution more likely. But this is most emphatically not what we see in the figures from the mid-2000s.Footnote 7 What should we conclude?
2.1 Fiscal inertia
One plausible response to these criticisms is that it takes time for political changes to appear in fiscal policy. Surveying 50 years of tax policy in developing countries, Richard Bird concluded, “on the whole, fiscal inertia seems more common than fiscal growth, with many countries remaining at more or less the same tax-GDP level” (Bird, Reference Bird2013: 8). In Latin America, fiscal inertia could produce a taxation profile bearing the stamp of bygone dictatorships. We only need to wait.
2.2 Institutional barriers
Another avenue of appeals for the median-voter model invokes the argument that observable institutional characteristics, often legacies of elite-influenced transitions, have obstructed the will of the median voter in developing-country democracies. One study argues that legislative malapportionment accounts for the lack of progressive tax legislation in many democracies – and that in particular, countries that are more economically unequal show greater degrees of malapportionment (Ardanaz and Scartascini, Reference Ardanaz and Scartascini2013). Another blames identifiable elite bias in other constitutional provisions, such as bicameralism or a prohibition of left parties (Menaldo, Reference Menaldo2016). However, these works use tax revenue figures (or in the second, revenue and social spending) as outcome variables, so they cannot distinguish legislated tax incidence from actual tax incidence, which is especially important with regard to taxation of the richest households (for which exemptions from PIT are often a concession to unenforceability).Footnote 8 And like fiscal inertia, the effect of transition-born institutional features should decline with time as they are whittled away by subsequent changes, as in Chile.
2.3 Capital mobility: an evaluation
Most plausibly, one might rescue the median voter model by adding a condition of capital mobility. Boix (Reference Boix2003: 38–43) posits that mobility allows the rich to escape taxation and confiscation, thus de-activating a key anti-democratic constituency and keeping democratic processes alive (see also Acemoglu and Robinson, Reference Acemoglu and Robinson2006: 32–33; Mahon, Reference Mahon1996: 181). To many observers, this picture of states constrained from taxing footloose capital agrees quite well with the past few decades of Latin American experience (Tanzi, Reference Tanzi, González, Krueger and Tornell2003, 330, 344). Gómez Sabaini observes that during the 1990s, Latin American governments, fearing lost investment and capital flight, hesitated to modernize their income-tax systems up to developed-country standards, despite the recommendations of international agencies (Gómez Sabaini, Reference Gómez Sabaini, Centrángolo Ó and Sabaini2005, 111–12). Fairfield describes elite reactions to Argentine authorities’ failed attempts to tax interest income, as well as the modifications imposed by business on the 2014 Chilean reform, as examples of how mobility enhances capital's “structural power,” based on threats of disinvestment (Fairfield, Reference Fairfield2007; Reference Fairfield, Mahon, Bergman and Arnson2015a: 50–51; Reference Fairfield2015b: 42–50; cf. Przeworski and Wallerstein, Reference Przeworski and Wallerstein1988).
However, not all signs point in the same direction. Some studies of taxation in the region conclude that tax breaks to multinational companies have been unnecessary, as the fear of capital mobility is greater than its actual effect on investment decisions (CEPAL/Oxfam 2016: 13). Most importantly, the capital mobility that characterizes contemporary globalization does not explain the low levels of taxation on immobile property, especially real estate, as noted above, long a distinctive feature of the region.
Let us evaluate the hypothesis more fully. To do so, we have to measure capital mobility, or the likelihood that capital mobility will be consequential to governments, across countries and over time. Let us use several standard measures of mobility to compare Latin America and other regions graphically, and then look at patterns within the region, before turning to regression analyses.Footnote 9
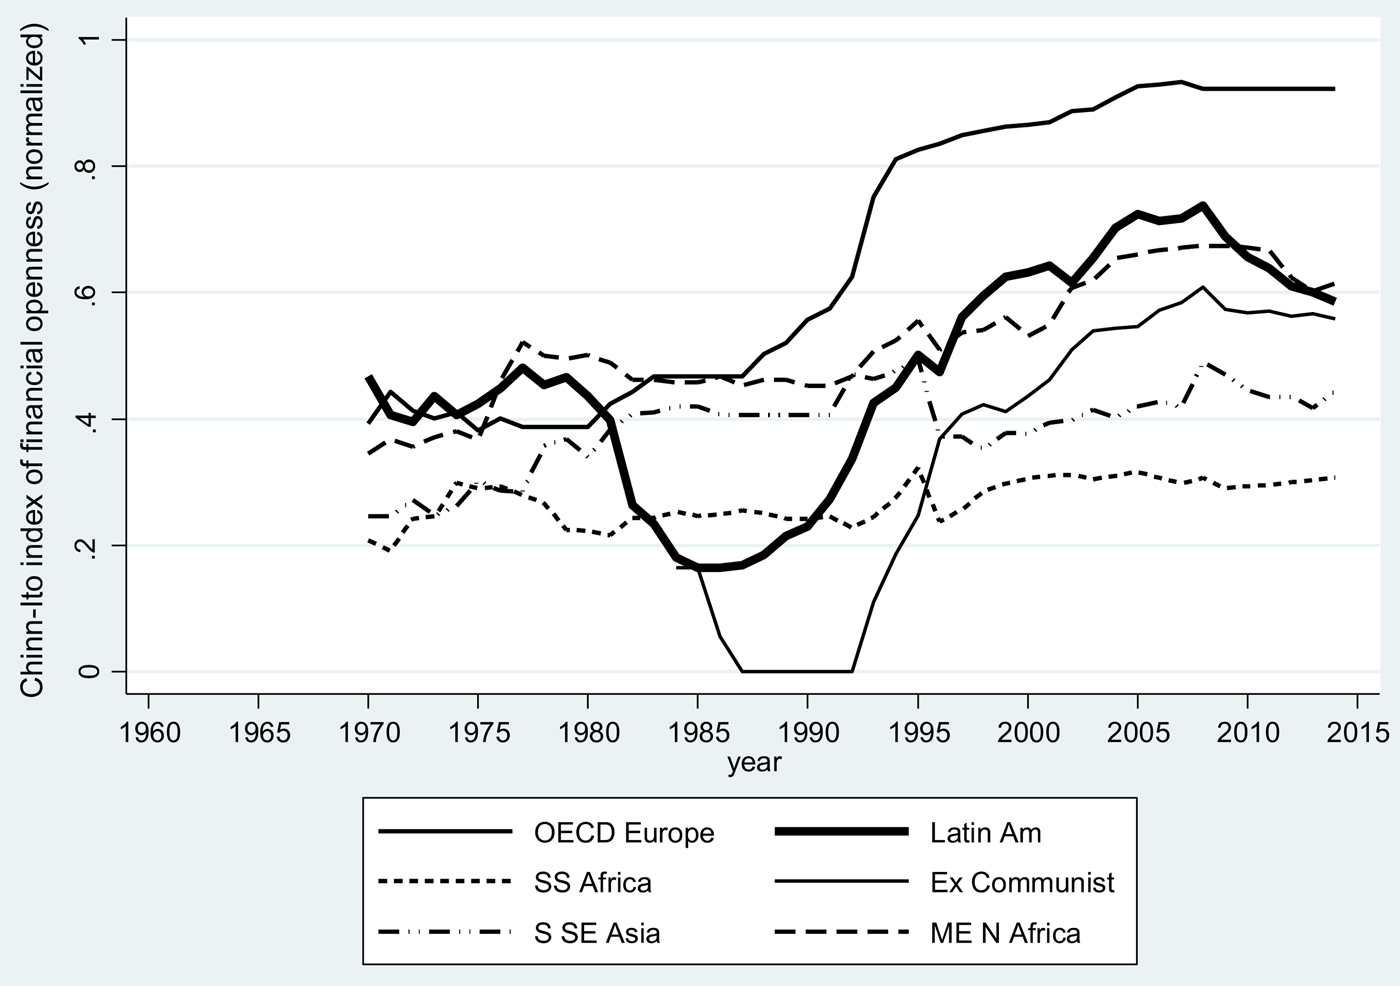
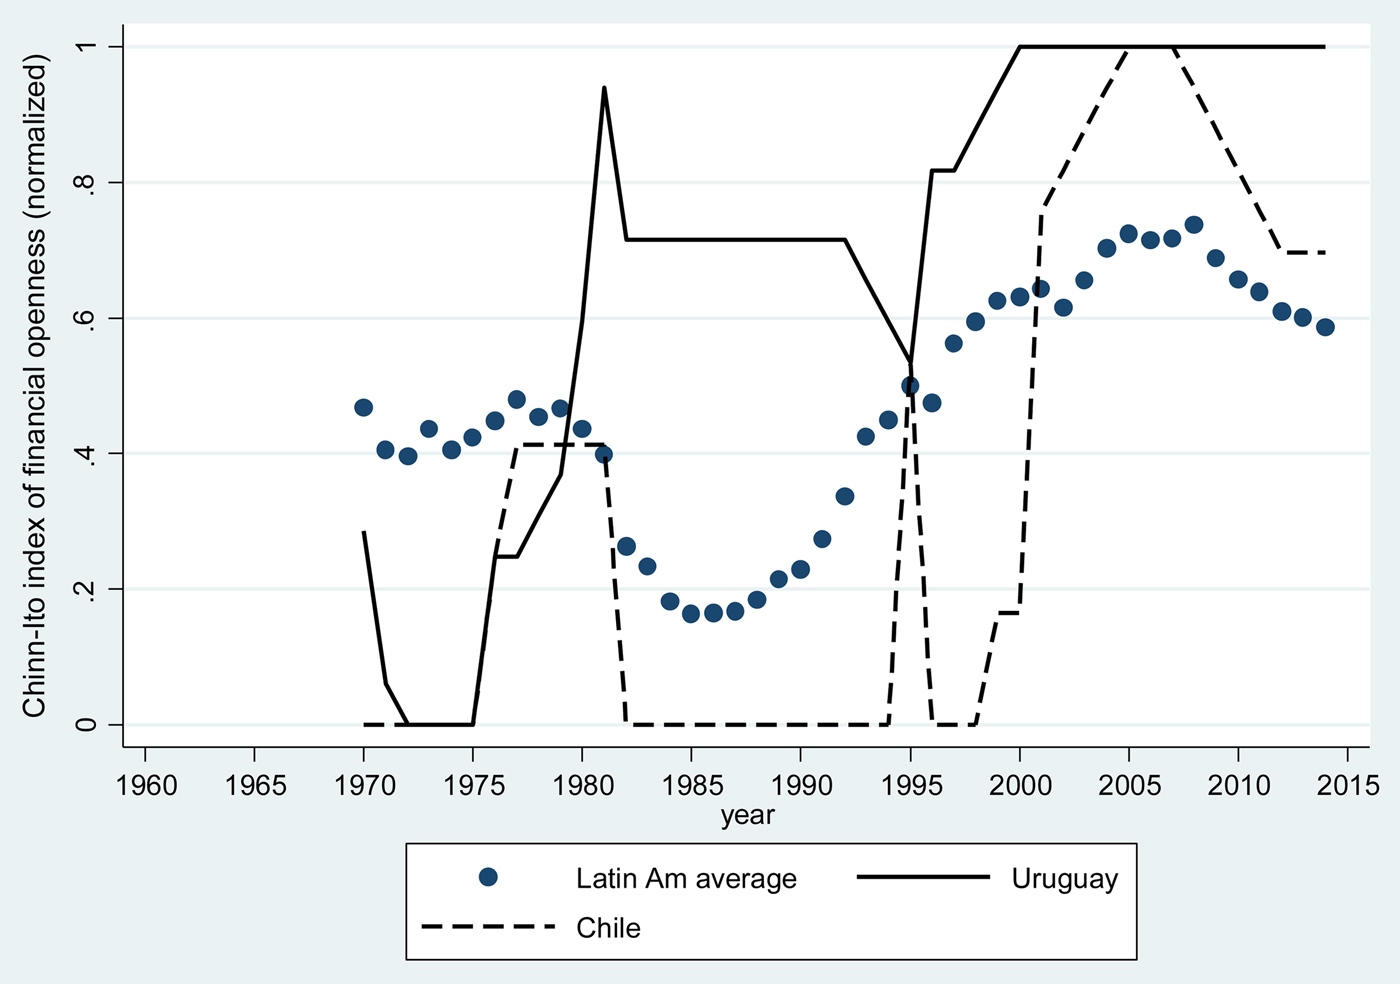
As Quinn et al. observe, mobility indicators can be divided into statistical summaries of the de jure frameworks that govern cross-border flows, on one side, and on the other, variables that track the de facto evolution of particular asset classes or groups of assets (Quinn et al., Reference Quinn, Schindler and Toyoda2011). A widely used indicator of the first type is the Chinn-Ito index of financial openness (Chinn and Ito Reference Chinn and Ito2006). Figure 1 shows that by this measure (ka_open, normalized to a 0–1 scale) Latin America was one of the more open regions of the world in the 1970s, becoming the second least open for most of the 1980s, but then since about 1995 again among the most open regions among developing countries. This would be consistent with a hypothesis of an unusual degree of financial constraint, via mobile capital, on tax policy in the region. However, Figure 2 confounds this story.Footnote 10
Chinn- Ito financial openness index, normalized to 0–1 (ka_open), six regional averages.

Chinn-Ito financial openness index, Latin American average plus Chile and Uruguay.

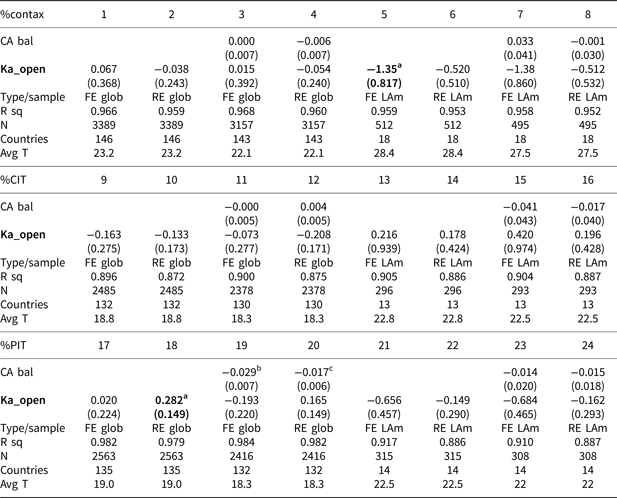
Regression analyses contradict the hypothesis as well. Table 3 shows the results of OLS panel time series regressions across a global sample and across Latin American countries only. Here the outcome variables are revenue shares from different kinds of taxes. Heavy reliance on consumption taxes (especially the VAT) and the inability to raise corporate income tax (CIT) or PIT revenues, constitute symptoms of the constraint arising from financial globalization. A higher score on the index of financial openness should correspond, then, to greater reliance on consumption taxes and lesser reliance on the others. The main model includes country fixed effects, to avoid omitted-variable bias, as well as year dummies and three temporally variant controls – lagged levels of urban population percentage, lagged levels of log GDP per capita (PPP), and the difference of log GDP per capita from t-1 to t = 0. Urbanization serves as a proxy for the presence of tax handles on consumption goods, which would presumably vary positively with domestic consumption taxation. GDP per capita is intended to soak up business-cycle effects on the proportion of tax revenue coming from consumption taxes. Other specifications add a control for the lagged level of the current-account balance (a short-term indicator of financial constraint) or employ a random-effects analysis instead. All use panel-corrected standard errors with panel-specific corrections for first-order autocorrelation (Stata command xtpcse and option corr(psar1)).
Ordinary least squares panel time series regressions, global and across Latin America only

Outcome variables are the percentage of revenues from consumption taxes, and the percentage of revenues from the corporation income tax, in total revenues. Reported coefficients are for the Chinn-Ito index, normalized (ka_open).
Standard errors in parentheses.
a Significant at 90% level (marginal).
b 95%.
c 99%.
d 99.9%.
FE, fixed effects; RE, random effects. Fixed effects analysis uses unit dummies.
As we can see, the Chinn-Ito measure is far from being significant in any test across the global sample, with or without unit fixed effects, with or without the current-account control. On the Latin American sample, the variable shows one marginally significant estimate (at 90%) in the base FE model with the consumption tax proportion as outcome – but it has the wrong (negative) sign. In the global sample, likewise, one equation gives a marginally significant coefficient with PIT revenue as the outcome, but again it has the wrong (positive) sign. Hence, with regard to de jure openness, the hypotheses that greater openness leads to heavier reliance on consumption taxes, or less reliance on income taxes, find no support in these tests.
What about de facto financial constraints arising from globalization? Here we have to specify what we mean by capital and income. One definition comprises only the personal income from the capital owned by Latin American resident taxpayers. A second would include the entire net foreign asset position of the country. A third would overlap in part with the first, and would include all international flows of portfolio capital whose income (interest, dividends) or sale could be taxable, whether accruing to residents or nonresidents. A fourth, resident corporate income from direct investment, is the main focus of the literature on rich welfare states under globalization, in which the key mobile agents are international businesses, to which governments are thought to respond with exemptions or rate reductions on the CIT (Tanzi, Reference Tanzi2000; Swank, Reference Swank2002; Keen and Lockwood, Reference Keen and Lockwood2010: 139). A fifth one would just reduce the fourth by the amount of corporate income that derives from location-specific (thus relatively immobile) assets such as mineral deposits.
Each definition or type of capital income implies a different political arena and distinctive mixes of power. On the first, personal income of residents, the overall weakness of taxation in the region is obvious. PIT codes in the region usually contain numerous investment-income exemptions, and what is not exempt is widely evaded. Well-connected elite agents exercise not only the “structural power” noted above, but also what Fairfield calls the “instrumental power” of relationships and political resources, in and out of formal institutions (Fairfield, 2016b: 28–42), which is not per se attributable to capital mobility. Regarding the second and third kinds of capital income, by contrast, governments care about net investment and the aggregate structural power of potentially destabilizing capital flows. The latter could be why withholding taxes on nonresident capital income have declined globally. Regarding the fourth, structural power is again thought to predominate (because mobility is presumed to enhance it), but foreign direct investment (FDI) is less mobile than are portfolio assets, so the perception might well exceed the reality. Finally, the fifth definition tries to reduce this divergence by deducting the least mobile share of FDI from the CIT base.
Therefore, stipulating that the first type (personal income of residents) is undertaxed but that we cannot determine to what degree this is due to capital mobility, we are left with four relevant and measurable slices of capital: net foreign assets (FDI, debt, equity, other investment); portfolio assets (debt and equity); FDI; and FDI minus mineral investment.
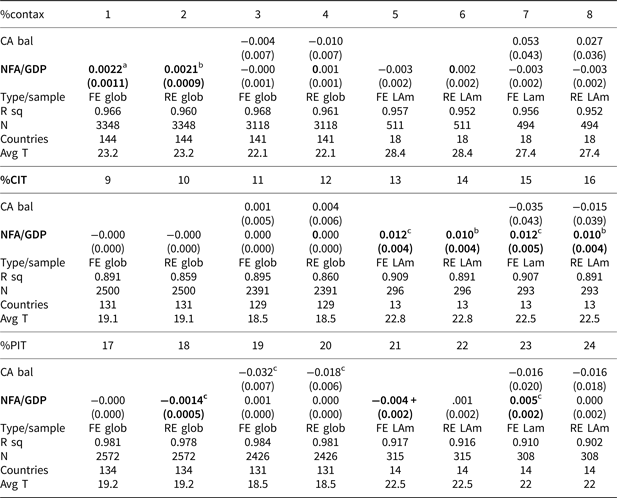
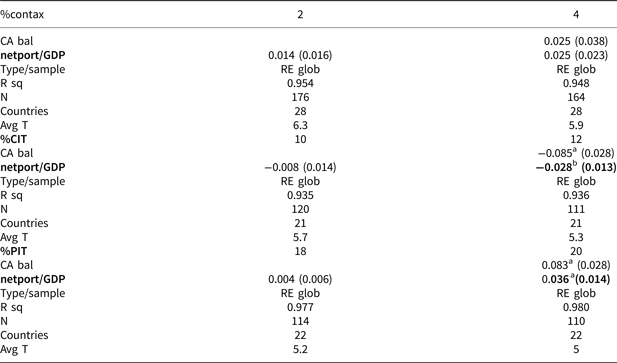
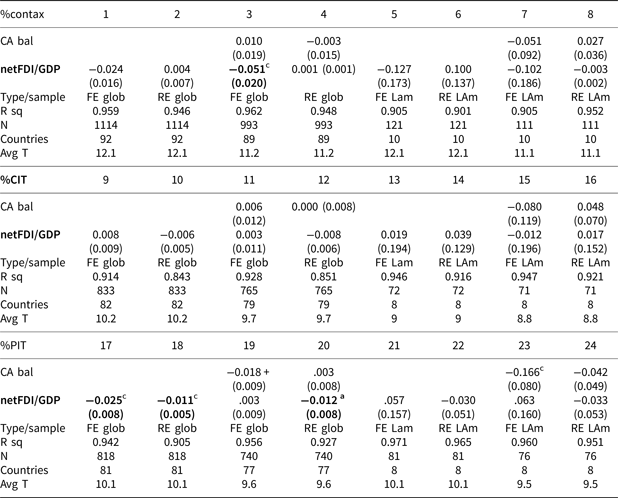
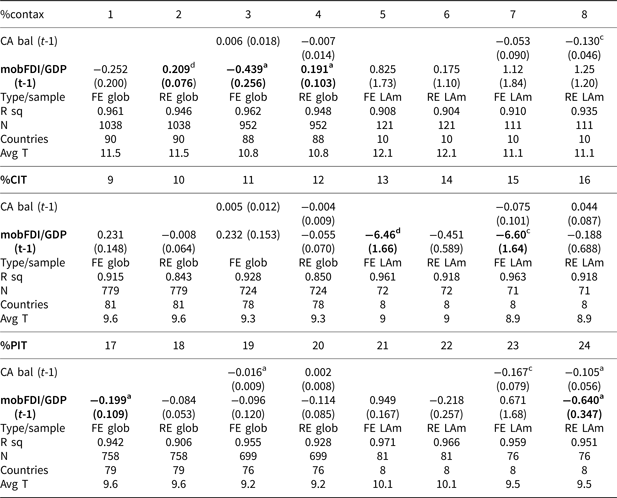
Here we repeat the tests above but now using each of these four slices (as a percentage of GDP) instead of ka_open (data from Lane and Milesi-Ferretti Reference Lane and Milesi-Ferretti2007). In each case, the hypothesized relationship would now be the opposite, as negative net assets should produce greater vulnerability and hence a higher proportion of consumption-tax revenues (or a smaller proportion of CIT or PIT revenues) in the total. Using net foreign assets, the broadest category, we find no support across the global sample and limited support in the Latin American sample (Table 4). Across Latin America, both the fixed-effects and random-effects tests (regressions 13-16, Table 3), with and without the current-account balance, yield the expected positive signs on the CIT variable, while another (23) is positive on the PIT. As for portfolio assets, the data are very sparse, making it impossible to get beyond random-effects tests on a global sample. We obtain contradictory results, with significant estimates of opposite signs in equations with corporate and PIT revenue proportions as outcomes (Table 5, equations 12 and 20). Using net FDI only (Table 6), again, two out of the three significant coefficients (equations 17, 18) have the wrong sign.
Ordinary least squares panel time series regressions, global and across Latin America only

Outcome variables are the percentage of revenues from consumption taxes, corporation income tax, and the personal income tax, in total revenues. IV coefficients are for net foreign assets as a percentage of GDP.
Standard errors in parentheses.
a Significant at 90% level (marginal).
b 95%.
c 99%.
d 99.9%.
FE, fixed effects; RE, random effects. Fixed effects analysis uses unit dummies.
Ordinary least squares panel time series regressions, global

Outcome variables are the percentage of revenues from consumption taxes, the corporation income tax, and the personal income tax, in total revenues. IV coefficients are for net portfolio (equity and debt) investment as a percentage of GDP. (Latin American samples too small; average T too small for FE regressions.)
Standard errors in parentheses.
a Significant at 90% level (marginal).
b 95%.
c 99%.
d 99.9%.
FE, fixed effects; RE, random effects. Fixed effects analysis uses unit dummies.
Ordinary least squares panel time series regressions, global and across Latin America only

Outcome variables are the percentage of revenues from consumption taxes, the corporation income tax, and the personal income tax, in total revenues. IV coefficients are for net foreign direct investment as a percentage of GDP.
Standard errors in parentheses.
a Significant at 90% level (marginal).
b 95%.
c 99%.
d 99.9%.
FE, fixed effects; RE, random effects. Fixed effects analysis uses unit dummies.
The final slice takes net FDI and attempts to deflate it by the amount of investment in (immobile) natural resources. Lacking data on resource investment specifically, we take a standardized value (mean = 0, standard deviation = 1) of natural resource rents as a percentage of GDP (World Bank, World Development Indicators), subtracting it from the standardized value of net FDI. The remainder should vary with the quantity of non-mineral, presumably more mobile direct investment. As we can see from the results on Table 7, this procedure offers no support at all for the hypothesis that a positive (negative) asset position induces less (more) reliance on consumption taxes and more (less) reliance on income taxes. None of the actually significant coefficients has the expected sign (equations 2, 13, and 15) and most of the marginally significant ones have the wrong sign also (4, 17, and 24).
Ordinary least squares panel time series regressions, global and across Latin America only

Outcome variables are the percentage of revenues from consumption taxes, the corporation income tax, and the personal income tax, in total revenues. IV coefficients are for an index or less mobile FDI, the standardized value of net foreign direct investment as a percentage of GDP minus the standardized value of resource rents as a percentage of GDP (World Bank WDI).
Standard errors in parentheses.
a Significant at 90% level (marginal).
b 95%.
c 99%.
d 99.9%.
FE, fixed effects; RE, random effects. Fixed effects analysis uses unit dummies.
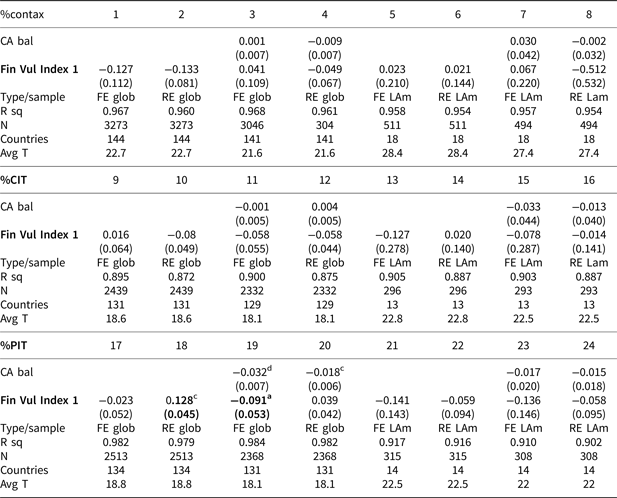
One might object that de jure openness and de facto constraints operate in tandem so that a negative net asset position really matters only when capital flows face few administrative barriers. This idea gains plausibility from the regional charts (Figures 1 and 2), which show that since the mid-1990s, Latin America has combined its a negative asset position, on average, with relative financial openness.
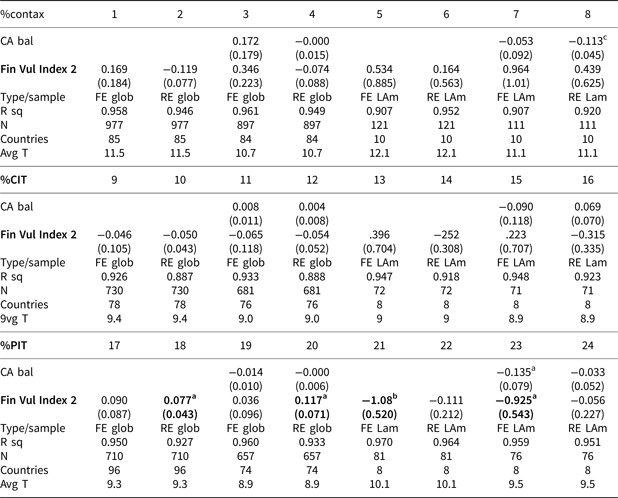
To test this possibility, I constructed two measures of overall financial vulnerability that subtract the standardized values of (1) net foreign assets, or (2) net mobile FDI, from the standardized value of ka_open. Thus high values would reflect high openness and a relatively low (usually negative) net asset position. The lowest values, implying the weakest financial constraints, would come from closed economies (standardized ka_open values well below zero) with highly positive net asset values. The hypothesis would expect a positive relationship on consumption taxes (high vulnerability predicting a greater reliance on them) and a negative one on income taxes. As we can see in Tables 8 and 9, there is no support for these ideas in the tests.
Ordinary least squares panel time series regressions, global and across Latin America only

Outcome variables are the percentage of revenues from consumption taxes, and the percentage of revenues from the corporation income tax, in total revenues. The IV of interest is the first index of financial vulnerability, which subtracts a standardized value of net foreign assets as a percentage of GDP from a standardized value of the Chinn-Ito index ka_open.
Standard errors in parentheses.
a Significant at 90% level (marginal).
b 95%.
c 99%.
d 99.9%.
FE, fixed effects; RE, random effects. Fixed effects analysis uses unit dummies.
Ordinary least squares panel time series regressions, global and across Latin America only

Outcome variables are the percentage of revenues from consumption taxes, corporation income tax, and the personal income tax, in total revenues. IV coefficients are for a second financial vulnerability index, standardized values of the ka_open measure minus the standardized value for mobile net foreign direct investment as a percentage of GDP.
Standard errors in parentheses.
a Significant at 90% level (marginal).
b 95%.
c 99%.
d 99.9%.
FE, fixed effects; RE, random effects. Fixed effects analysis uses unit dummies.
To sum up these tests, it is surprisingly hard to find statistical evidence of an effect of financial openness or vulnerability on the relative weights of consumption and income taxes in public revenues. The strongest support for the importance of capital mobility comes from the testimony of policymakers and, more generally, the terms of public debates on economic policies that are thought to affect the investment climate. We also find weak support in four regressions on (total) net foreign assets over the Latin American sample with corporate income taxation as an outcome. Still, what these debates would lead us to expect – financial vulnerability, measured as de jure openness or negative net assets, inducing a greater reliance on consumption taxes – does not appear. Nevertheless, due to data limitations, we could not evaluate the slice of capital for which policymakers have evidently made the greatest accommodation – capital that produces personal income for residents.
2.4 Summary
The median-voter model has serious shortcomings. We can blame fiscal inertia for some of its failures, although this excuse becomes less plausible over time. The model's fit to Latin American reality, circa 2005, improves somewhat if we posit particular institutional barriers to median-voter preferences. However, rather surprisingly, the effects of capital mobility show up only weakly in analyses relating financial openness or vulnerability to tax structures. We can grant, however, that mobility probably has the greatest influence in the area hardest to measure and analyze--resident personal capital income. All in all, it is hard to explain either historical patterns or fiscal-policy effects (as of about 2005) using the median-voter model.
3. Alternatives to the median-voter model
3.1 Power constellations/oligarchy
An important critique of the median-voter model comes from the power resources or power constellations approach (Korpi, Reference Korpi1985; Huber and Stephens, Reference Huber and Stephens2001, Reference Huber and Stephens2012). Starting from nearly opposite premises – namely, that personal wealth bestows a decisive advantage in all capitalist systems – it was originally conceived to explain how welfare states could have arisen under capitalism. It focuses on the institutional, organizational, economic, and symbolic tools available to the contenders for influence over policy – for example, constitutional veto points, the strength of left parties, union density, or the rules governing campaign finance. This approach parallels those analyses that cite institutional barriers to the expectations of the median-voter model. The difference is that here, the institutions are why ordinary citizens have any influence over policy at all.
Although the power constellations model is descriptively rich, its main weakness is that unless the potential sources of power are strictly specified a priori, it can become unfalsifiable. Outcomes that confound expectations could be redescribed as evidence for previously unobserved power resources, keeping the theory intact. Hence the best studies of this kind spotlight a limited number of “resource”’ variables (presidential vs. parliamentary systems, union density or centralization).Footnote 11 For our purposes, let us begin with an even more limiting specification, not far from the theory's default setting: power resources belong entirely by the rich, who avoid taxes while capturing substantial benefits of state spending. This resembles Winters’ model of oligarchy (Winters, Reference Winters2011: Chap. 1). In Fairfield's terms (Reference Fairfield2015b), it amounts to saying that elite “instrumental power” – derived from organization, media domination, and personal connections to officials – is always decisive (cf. Profeta and Scabrosetti Reference Profeta, Scabrosetti, Bernardi, Barreix, Marenzi and Profeta2008: 71–72).
There is plenty of evidence for the proposition that oligarchical domination has driven fiscal policy in the region for much of its history. Several decades ago, Michael Best observed that tax outcomes in Central America fit “the hypothetical preferences of the large landlords and in reverse order to the preferences of the majority of the population” (Best, Reference Best1976: 50; see also Sokoloff and Zolt Reference Sokoloff, Zolt, Edwards, Esquivel and Márquez2007).
3.2 Compensation
A fundamental critique of the median-voter model is that it posits economic agents without strategic relationship to each other or to state actors. On the first, research in psychology and behavioral economics has provided abundant evidence that ethical norms influence judgments about fairness and, by extension, appropriate fiscal policies (e.g., Reuben and Riedl Reference Reuben and Riedl2013). Scheve and Stasavage (Reference Scheve and Stasavage2016) build upon these insights to argue that the advent of highly progressive taxes across most wealthy countries in the twentieth century had its origins in the combination of democracy and mobilization for war, the latter involving mass conscription (135–69).
This appears to fit the inter-regional contrast between Latin America and most developed countries. Many Latin American states have ordered mass conscription under democracy– although in practice the rich and well-connected manage to avoid it (Rouquié, Reference Rouquié1987: 94–97; Torres, Reference Torres2011), and historically the regional norm has been the haphazard press-gang. However, with the possible exception of Nicaragua in the 1980s, in recent years none has drafted people on this scale to a war with mass casualties. So can we say that Latin America has lacked strongly progressive taxation because its poor and young have never been asked to sacrifice to the same extent as did their counterparts in twentieth-century combatant countries? Certainly, Scheve and Stasavage's work calls on us to adjust what we regard as a taxation norm. But this must be only part of the picture, because in addition to avoiding the draft, as noted above the very rich in Latin America also evade taxes (or enjoy tax breaks conceded out of administrative weakness) at higher rates than do the middling deciles. This points us again to state capacity.
3.3 Fiscal contract
A related line of criticism emphasizes the bargaining aspect of obtaining revenue, epitomized in the idea of the fiscal contract. This approach posits that governments tax most effectively when “taxpayers believe that the funds will be spent wisely – that is, in a way that they perceive as benefiting them directly (by providing public services) or indirectly (by strengthening the economy and developing a more adequate legal and political framework to support property rights)” (Bird and Zolt, Reference Zolt2015: 331). At the “micro” level, the fiscal contract model arguably resembles the “benefit principle” of taxation, in the presence of political costs (Wallis, Reference Wallis and Oates2001: 141–45). The model's historical archetype, from early modern Europe, begins with the pressing need for ever-increasing revenue due to recurrent warfare (Levi, Reference Levi1988). Regarding contemporary politics, the model has been invoked to explain why large welfare states rely greatly on highly productive but regressive consumption taxes (Steinmo, Reference Steinmo1993; Kato Reference Kato2003).Footnote 12 It also aligns with the argument that tax compliance depends on tax morale, which in turn depends largely on perceptions of fairness, efficiency and accountability in the political system (Daude and Melguizo, Reference Daude and Melguizo2010; Torgler et al., Reference Torgler, Schaffner, Macintyre, Alm, Martínez-Vázquez and Torgler2010: 141–43).
In Latin America, it is not hard to find examples of taxpayers, ordinary citizens, or tax specialists describing the tax policymaking process in fiscal-contract terms (cf. Carciofi Reference Carciofi1990; UN-ECLAC 2013; on Guatemala, Sanchez Reference Sanchez2009: 122; see also Bird and Zolt Reference Zolt2015). Accounts of tax politics describe fiscal policy changes, like other reforms, as facilitated by concessions on other fronts, in what Fairfield describes as a kind of compensation (Reference Fairfield, Mahon, Bergman and Arnson2015a: 41; see also Sanchez Reference Sanchez2011: 76). This implies that a successful exchange would be more likely where the targets of any tax increase trust those in power to compensate them adequately. Consider the 2001 wealth tax in Colombia – imposed by a right-wing hero and used to build up the security forces, complete with mechanisms of oversight by members of the economic elite (Flores-Macías, Reference Flores-Macías2014; see also Schneider, Reference Schneider2012; Ondetti, Reference Ondetti2015). By the same token, the failure or refusal to enact administrative or spending reform could stifle changes in taxation, as Elizondo (Reference Elizondo2014) and Romero (Reference Romero, Mahon, Bergman and Arnson2015) have argued for Mexico. Beyond this, there have been other, very public and explicit revenues-for-governance bargains in Latin American history, but they involved borrowing, not taxes (Drake, Reference Drake1989: 254–59; Domingo, Reference Domingo1995: 12).
The theory's main weakness is that many or most fiscal contracting relationships are hard to observe. Explicit exchanges of tax revenue for policy or institutional innovations are rare (Prichard, Reference Prichard2015). Deals often take place out of the public eye, and fiscal-contract-style complaints in the financial pages by big taxpayers usually count as evidence that one has not yet been struck. Still, actual bargains are not necessary for the theory to predict outcomes accurately. Besley and Persson (Reference Besley and Persson2011) formally model the “fiscal capacity” to gather tax revenue and the “legal capacity” to protect property rights as pure complements. This is not necessarily unrealistic: in Wallis's “benefit tax” picture of local property levies in the USA, it is the diffuse property-value-enhancing benefit of local public goods, not a formal bargain, which persuades owners to pay (Wallis, Reference Wallis and Oates2001: 141). In Latin America, the fiscal-contract theory would predict efforts by the democratic public to recoup some of its VAT contributions in the form of spending on the benefits it desires. Yet this would be observationally similar to median-voter politics, only distinguished, perhaps, by a discourse of “let's get something back” rather than “let's soak the rich.”
3.4 Summary
All in all, the oligarchy model and the compensatory theories do account for a lot of what is left unexplained by the median-voter model and its derivatives. The power of entrenched elites over tax policy seems to fit the expectations of oligarchy better than it fits the median-voter model under capital mobility. And of course, the gross contrast between Latin America's weakness on personal income taxation and the highly progressive taxes instituted in twentieth-century world war combatant countries suggests that compensatory theories should be part of any explanation for the inter-regional contrast.
As can be gleaned from the previous discussion, many important differences among the models turn on how they conceive of the capabilities and purposes of the state. Under democracy, the oligarchy and (base) median-voter models diverge sharply. In the former, the state serves an economic elite, despite democracy, whereas the latter assumes that it unproblematically serves a relatively poor voter. The former implies a weak and dependent state, the latter a powerful and autonomous one. By contrast, the state is one of the moving parts in the fiscal-contract model. The model assumes that enforcement is costly and voluntary compliance valuable, as officials try to satisfy pressing public-revenue needs while encountering political constraints on a daily basis. Without a basic minimum of state coherence, taxpayers would find it easier to pursue individualistic strategies, such as tax evasion or the pursuit of exemptions, rather than broad rate reductions, universalistic policies, or institutional reforms. But fiscal contracts also lend themselves to the building of state capacity.
A related difference concerns the purpose of the fisc. In the median-voter world, the voter's motive is to redistribute toward herself. But relational theories are about fairness and exchange. Democratic publics push for high taxes on the rich when the state demands the bodies of the non-rich in conditions of total war. Or (as in fiscal contracting) the state has to give the taxpayer something in order to obtain a stream of revenue (Timmons, Reference Timmons2005: 534–36). Public goods – or better, what taxpayers consider public goods – will naturally form a major part of the trade.
Now, two statements of the obvious. First, no Latin American state is the perfectly capable instrument assumed by median-voter theory. Second, it is hard to find a country in which public finance is either all about public goods or all about redistribution. Even the economist's favorite example of a public good, national defense, has always redistributed to somebody, from Royal Navy contractors to the military-industrial complex. And taxpayers often disagree on what constitutes a public good.
Most importantly, state capacity and fiscal purpose seem to have a particular relationship in practice. Where the median-voter model applies best, in Western Europe, the most important moments of state formation did not involve redistribution via the fisc. Rather, they centered on a process by which a ruling group used taxation to solve a coordination problem – above all, to pay for the war. In other words, in countries where the median-voter model actually works, it depends on competent states that formed historically by acting in a way the model does not expect.Footnote 13
A couple of results follow. First, those who use the median-voter model should acknowledge state capacity as a primary scope condition for its applicability (Soifer, Reference Soifer2013). In Latin American experience, elites who fear redistribution prefer a weak state (Cárdenas, Reference Cárdenas2010).Footnote 14 And if the state lacks strong domestic champions, other paths to state formation can become more consequential – as when international financial institutions and other advisors fortify Latin American tax agencies, often against the wishes of domestic oligarchs.
State capacity also relates to important fiscal-policy differences among Latin American countries. Consider the post-Independence fiscal histories of Chile and Uruguay, noted above. Chile established an effective land tax the earliest of any Latin American state. By 1861, 31,000 properties were assessed for tax (Soifer, Reference Soifer2015: 164). In Uruguay, property taxes made up almost 13% of national tax revenue by the fiscal years 1902–05, with business taxes contributing another 6% and inheritance taxes 1.4% (Finch, Reference Finch1981: Table 4.1, 93). By the 1920s its level of revenue from real estate taxes was anomalously high for the region (ibid.: 94–96; Bulmer-Thomas Reference Bulmer-Thomas1994: 181). “The Chilean elite,” Kurtz comments, “was capable of taxing itself –in advance” to fund wars of conquest (Kurtz, Reference Kurtz2013: 90; emphasis in original). In Uruguay, the solution involved the definition – in favor of the largest landholders – of rural property rights (ibid.: 117–22). Hence, much like post-1688 England, in both countries the imposition of taxes on land and other property accompanied a process of liberal, elite-controlled state-building.
The fiscal-contract theory thus becomes particularly useful in accounting for differences rooted in state capacity. It says that states get built by the historical accretion of policies, spending patterns, or institutions whose origins lay in implicit or explicit exchanges for revenue, sometimes far in the past. Thus the shape of a country's tax system could have a counterpart in the institutional capacities – or incapacities – of its government. Chile and Uruguay are known today for their relatively capable states – the only states to have achieved progressive tax reforms in recent years.
4. Recent developments
After the late 1990s, while most accounts of Latin America focused on the rise of a “new Left,” moderate Left governments in Uruguay (2006) and Chile (2015) passed progressive tax reforms, while governments of all persuasions adopted innovative policies on the spending side of the ledger.Footnote 15 These included forms of social protection such as conditional cash transfers and non-contributory pensions, as well as access to health care, a package which came to be labeled “basic universalism” (Filgueira et al., Reference Filgueira, Molina, Papadopulos, Tobar and Molina2006).
The tax changes in Uruguay and Chile would not have been predicted by an oligarchy model. Other power resources clearly mattered. For one thing, both reforms took place under Left governments with control of the legislature. For another, in Chile, the government's hand was strengthened by popular mobilizations that explicitly called for the kind of progressive reform it later proposed. The fact that these reforms took place around 20 years after their countries’ redemocratization confirms a general observation by Huber and Stephens: it takes time for progressive forces to build organizations and gain experience in practical politics (Huber and Stephens Reference Huber and Stephens2012: 143–44, 202–03).
Yet state capacity also played a pivotal role. The considerable competence of the Uruguayan tax authority (DGI) in preparing credible incidence estimates for the 2006 tax package helped weaken opposition from those who perceived themselves as “middle class” (Rius, Reference Rius, Mahon, Bergman and Arnson2015: 73–75). In Chile, protesters championed reforms that would hand several percent of GDP to the country's tax agency, thence to be spent by the state on expanding education. This demand would have been almost inconceivable in Mexico, given the widespread popular doubts regarding the competence of the corresponding ministries there.
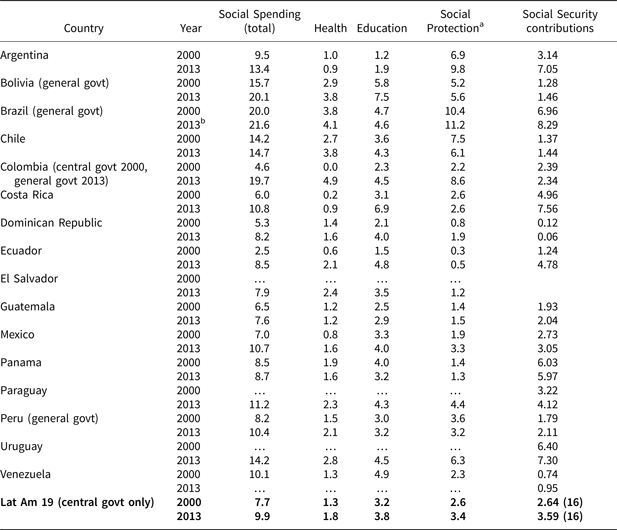
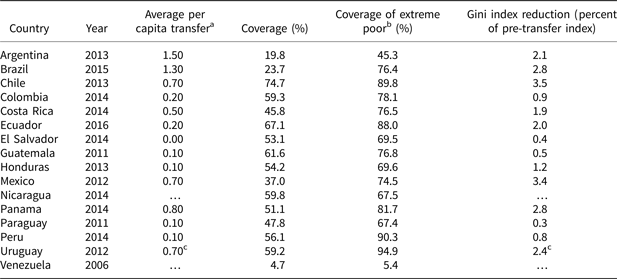
Meanwhile, the new social spending has been innovative, widely adopted, often well targeted on the poor, but relatively modest in its overall size and effect. Table 10 shows measures of social spending from UN-ECLAC, together with OECD figures for social security contributions. From the UN figures we get a sense of how much is spent on cash programs (including contributory social security) vs in-kind provision of health care and education. While the last two columns are not directly comparable, we can see that in general, social security contributions are of the same order of magnitude as the total for social protection, which includes the non-contributory and conditional cash transfer programs. That is, the new programs still represent only a small fraction of social outlays.Footnote 16 Table 11 shows their coverage and effect on household income inequality as of around 2013. As we can see, the transfers are modest and quite often the coverage is incomplete. The figures in the last column show the effect in percent, not percentage points, of the pre-transfer Gini index – so a reduction of 2.8% (Brazil) for a Gini of 0.500 would be a mere 0.014 points.Footnote 17 (Compare this with the figures in Table 2.) We can safely say that for the cash programs at least, “basic universalism” has not amounted to massive redistribution.
Social Spending as a percentage of GDP, central government except as noted, 2000 and 2013 (UN-ECLAC), and social security contributions, same years (OECD)

a Social protection includes both social insurance (pensions) and social assistance in Table 11.
b Brazil 2013 is based on 15 of 26 states and districts.
Impact of Social Assistance Policies, circa 2013

a Daily 2005 US$ PPP.
b Less than US$1.90 PPP a day.
c 2008.
Source: World Bank, Atlas of Social Protection: Indicators of Resilience and Equity.
What do these results mean for modeling fiscal policy in Latin America? They do arguably represent a small step toward what the median-voter model would predict. Politicians seeking election have clearly responded to the concerns of a growing urban informal sector, battered by income volatility in the riskiest precincts of the capitalist economy (Haggard and Kaufman, Reference Haggard and Kaufman2008: 304; Filgueira et al., Reference Filgueira, Reygadas, Luna, Alegre and Blofield2011). But we cannot rule out a fiscal-contract logic, either: the same growth of tax revenues, which has created fiscal space for new social spending, has been based largely on non-progressive indirect taxation. In other words, the urban poor would have reason to believe that they are being taxed on their consumption, even if only indirectly, and now they want something back. If so, this would represent an implicit exchange not very different from the path-dependent logic outlined by Kato (Reference Kato2003).
5 Conclusion
This paper began from the puzzling failure of the median-voter model to explain Latin American fiscal policy. It reviewed various ways of excusing this failure (e.g., fiscal inertia, institutional barriers) or saving the model by adding empirical premises (capital mobility). Adding a condition of capital mobility improves its fit only slightly and only for the reliance on corporate income taxes in Latin America, according to regression analyses reported here. The model does have fundamental flaws, namely its assumption of a perfectly capable state and the implication that taxing and spending are always a matter of redistribution, not the provision of public goods. Theories of compensation and oligarchic domination explain Latin America's historically distinctive fiscal profile better.
We come to two related conclusions about the median-voter model. First, following Soifer, state capacity has to be considered one of its key scope conditions. Second, important moments of state building take place when public finance is about things the model ignores – coordination problems and public goods. Where states are not as perfect as the theory assumes, as they are across Latin America, models of fiscal politics that include the state and describe conditions of its formation –such as the theory of the fiscal contract – do a better job at accounting for differences among countries. Chile and Uruguay stand out for having experienced early state formation as elites solved a collective-action problem, and in recent years, for being the two countries to have had significant progressive tax reforms. In this, they are the countries that come nearest to the expectations of the median-voter model, and in this, too, they illustrate the unacknowledged importance of state capacity to the model's usefulness. Other recent developments suggest a similar connection. The widespread adoption of innovative anti-poverty spending programs has rested, in part, on the expansion of tax revenue (often used as an indicator of state capacity). But insofar as they respond to a felt need for compensation for taxation that still falls mainly on consumption, they could bespeak a fiscal-contract process as well.