Introduction
Theileria parva, which causes East Coast fever (ECF), one of bovine theilerioses, is the most important tick-borne pathogen of cattle on the African continent (Lubembe et al., Reference Lubembe, Odongo, Salih and Sibeko-Matjila2020). It is estimated that almost half of the cattle population on the African continent are at risk of infection with T. parva (Lubembe et al., Reference Lubembe, Odongo, Salih and Sibeko-Matjila2020). Although adult indigenous cattle in Africa rarely develop clinical diseases, calves under 6 months old are highly susceptible (Moll et al., Reference Moll, Lohding and Young1984, Reference Moll, Lohding, Young and Leitch1986). However, in exotic and crossbred cattle, the fatality rate may be as high as 80–100% and this has negatively impacted the development of the dairy industry in the endemic countries (Oura et al., Reference Oura, Bishop, Asiimwe, Spooner, Lubega and Tait2007). The control of ECF in Malawi is mainly based on tick control through acaricide application, livestock movement restriction where cattle from endemic northern and central regions are not allowed to go to the non-endemic southern region. Chemotherapy using buparvaquone is used to manage clinical cases in the endemic areas and immunization of cattle using the Muguga cocktail live vaccine. The infection and treatment method (ITM) which involves inoculating the animal with a dose of the Muguga cocktail vaccine and simultaneous treatment with long-acting tetracycline is currently in use in the northern and central regions where the disease is endemic (DAHLD, 2006). However, in the southern region which has been considered non-endemic, the vaccine has not been deployed although sporadic cases of ECF have been reported (Chinombo et al., Reference Chinombo, Mzoma and Musisi1988). The whole genome sequencing of T. parva by Gardner et al. (Reference Gardner, Bishop, Shah, De Villiers, Carlton, Hall, Ren, Paulsen, Pain, Berriman, Wilson, Sato, Ralph, Mann, Xiong, Shallom, Weidman, Jiang, Lynn, Weaver, Shoaibi, Domingo, Wasawo, Crabtree, Wortman, Haas, Angiuoli, Creasy, Lu, Suh, Silva, Utterback, Feldblyum, Pertea, Allen, Nierman, Taracha, Salzberg, White, Fitzhugh, Morzaria, Venter, Fraser and Nene2005) and the identification of T. parva specific mini- and microsatellite markers which were first described and applied by Oura et al. (Reference Oura, Odongo, Lubega, Spooner, Tait and Bishop2003, Reference Oura, Asiimwe, Weir, Lubega and Tait2005) and Katzer et al. (Reference Katzer, Daniel, Chris, Bishop, Evans, Taracha and Declan2006, Reference Katzer, Ngugi, Walker and McKeever2010) have provided good markers for the genotyping and characterization of the population structure of T. parva.
However, the deployment of vaccine that will be effective against the T. parva strains circulating in cattle requires genotypic and population genetics data in the endemic countries. Despite T. parva being widely spread in central, eastern and southern Africa, there is limited information on the parasite genotypes and population structure available in southern Africa. The information on T. parva parasites from cattle available is only from Zambia (Muleya et al., Reference Muleya, Namangala, Simuunza, Nakao, Inoue, Kimura, Ito, Sugimoto and Sawa2012) and South Africa (Lubembe et al., Reference Lubembe, Odongo, Salih and Sibeko-Matjila2020), although the disease is controlled in South Africa. Lubembe et al. (Reference Lubembe, Odongo, Salih and Sibeko-Matjila2020) investigated the genotypes of T. parva from buffaloes in Mozambique and South Africa. The knowledge about the genotypes and population structure of T. parva on the African continent is important to assess the diversity of T. parva in the continent as these strains may affect the current vaccines being used to control ECF.
This study aimed at investigating the genetic population structure of T. parva among cattle in Malawi using T. parva mini- and microsatellite markers. The specific objectives were (1) to determine if genotypes of T. parva from vaccinated cattle with T. parva Muguga cocktail vaccine will be different from those without vaccination history, (2) to determine if there is the presence of sub-structuring among the T. parva isolates in Malawi and (3) to determine if the population of T. parva in Malawi is panmictic.
Materials and methods
Sample collection and DNA extraction
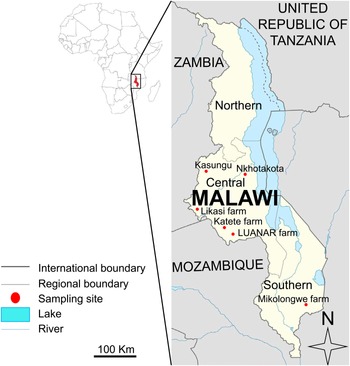
The cattle blood samples from Kasungu (n = 20), Nkhotakota (n = 20) and Katete (Lilongwe) (n = 19) were obtained from our previous study (Chatanga et al., Reference Chatanga, Hayashida, Muleya, Kusakisako, Moustafa, Salim, Katakura, Sugimoto, Nonaka and Nakao2020). The other samples were collected from Likasi farm (33° 17′ 05″ E; 14° 02′ 43″ S) (n = 92) and Lilongwe University of Agriculture and Natural Resources (LUANAR) student farm (33° 77′ 83″ E; 14° 17′ 96″ S) (n = 53) in the central region and Mikolongwe (35° 12′ 30″ E; 15° 51′ 49″ S) (n = 28) in the southern region (Fig. 1). The cattle sampled from Kasungu and Nkhotakota were the indigenous Malawi zebu with no history of T. parva immunization or dipping to control ticks. Furthermore, these animals belong to smallholder farmers who use communal grazing land which allows mixing with herds from other farms.
Map of Malawi showing the sample collection sites.

The cattle sampled from Katete farm were Holstein Friesians only, while those from Likasi, LUANAR and Mikolongwe farms were Holstein Friesians, and crossbreeds with the indigenous Malawi zebu, respectively. At Katete, Likasi and LUANAR farms, cattle are kept under semi-intensive management system and some were immunized with the T. parva Muguga cocktail vaccine 2 years and 3 months before the sampling period as previously described (Chatanga et al., Reference Chatanga, Hayashida, Muleya, Kusakisako, Moustafa, Salim, Katakura, Sugimoto, Nonaka and Nakao2020) and dipping is done weekly to control ticks. At Mikolongwe farm, which is located in the southern region, cattle are dipped weekly but are not vaccinated against T. parva as the farm falls in a non-endemic area. The animals from other farms in Malawi are not allowed into the breeding population at Katete farm for disease control purposes. The farm practices natural breeding and regularly change the bulls used by importing their breeding stock from South Africa where T. parva is not endemic. Although the animals at Likasi, LUANAR and Mikolongwe farms do not mix with cattle from other herds, the introduction of Malawi zebu heifers breeding stock from smallholder farmers in Malawi for crossbreeding with Holstein Friesians is allowed.
Approximately 5 mL of cattle whole blood was collected in ethylene diamine tetra acetic acid (EDTA) vacutainer tubes, aseptically by swabbing the external jugular venepuncture site with methylated spirit swab. The samples were kept on ice before transporting to the laboratory. DNA was extracted from 200 μL of whole blood using Quick Gene DNA whole blood kit S (DB-S) (Kurabo Industries Ltd., Osaka, Japan) according to manufacturer's instructions. The extracted DNA was stored at −20 °C until required for use.
Theileria parva screening
The samples from Likasi, LUANAR and Mikolongwe were screened in this study for T. parva using nested PCR assays targeting the T. parva-specific 104-kDa antigen gene (p104) as described previously by Odongo et al. (Reference Odongo, Sunter, Kiara, Skilton and Bishop2010). The amplification was done using Tks Gflex DNA Polymerase (TaKaRa Bio Inc., Shiga, Japan), the reaction mixture and PCR conditions were set as previously described (Chatanga et al., Reference Chatanga, Hayashida, Muleya, Kusakisako, Moustafa, Salim, Katakura, Sugimoto, Nonaka and Nakao2020). Approximately, 10 ng of the sample was used as DNA template and molecular grade water instead of genomic DNA was used as negative control in each run for quality control.
PCR amplification of mini- and microsatellites
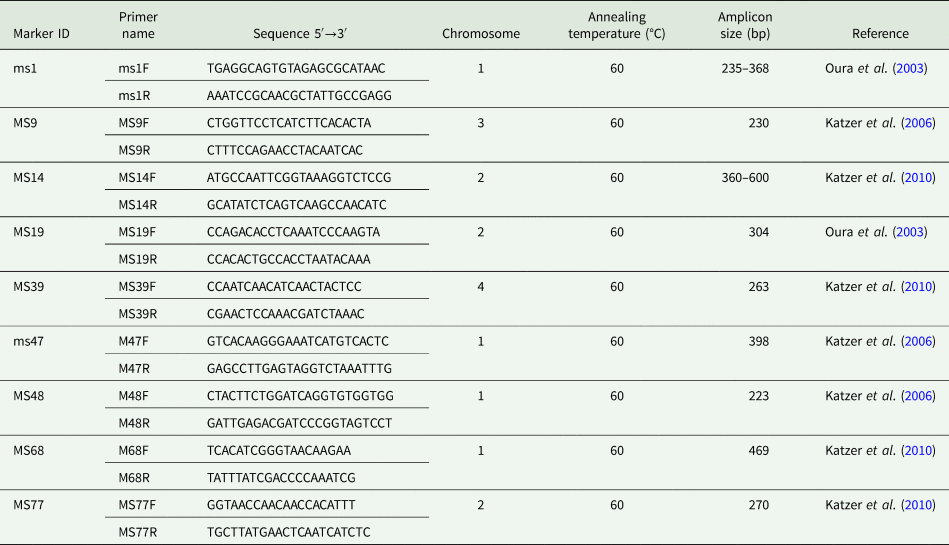
The primers used for satellite amplification and their annealing temperatures are shown in Table 1. The forward primer of each pair was fluorescently labelled with either 6-FAM,/VIC and/or PET at the 5′ end. The amplifications were conducted in a 10 μL reaction mixture, containing 5.0 μL of 2 × Gflex PCR Buffer (Mg2+, dNTP plus), 0.2 μL of Tks Gflex DNA Polymerase, 0.5 μL of 200 nm of each primer, 10.0 ng of the DNA template. The volume was adjusted using distilled water. Negative control containing distilled water instead of DNA template was used for quality control. The cycling conditions were set with an initial denaturation at 94 °C for 3 min, followed by 45 cycles of denaturation at 98 °C for 10 s, annealing for 30 s, and extension at 68 °C for 1 min and final extension at 68 °C for 5 min. The amplicons were electrophoresed in a 1.5% agarose gel stained with Gel-Red (Biotium, Hayward, CA, USA) and visualized under UV light.
List of satellite marker primers used in this study

ms, minisatellite; MS; microsatellite; F, forward; R, reverse; bp, base pair.
Capillary electrophoresis
The capillary electrophoresis was conducted in a 11.5 μL reaction volume comprising of 0.5 μL GS-600 LIZ size standard (Applied Biosystems, CA, USA), 10.0 μL ABI HiDi formamide (Applied Biosystems, CA, USA) and 1.0 μL of 10-fold diluted microsatellite PCR product. The mixture was denatured at 95 °C for 5 min and immediately cooled on ice before capillary electrophoresis on the ABI 3500xl genetic analyser (Applied Biosystems, CA, USA).
Fragment analysis
The DNA fragment sizes were analysed relative to the ROX-labelled GS 600 LIZ size standard using Gene Mapper software version 6 (Applied Biosystems, CA, USA). This facilitated the resolution of multiple products with 1 base pair (bp) difference in a single reaction. Multiple products from a single PCR reaction indicated the presence of mixed genotypes. The output data from the genetic analyser were provided as the area under the peak of each allele (quantitative measurement), with the predominant allele possessing the greatest peak area. In this way, the predominant allele at each locus was identified for each sample, and these data were combined to generate a multi-locus genotype (MLG) representing the most abundant genotype in each sample. Only the alleles with the prescribed base pair range were used to generate the MLG and samples from the same area were electrophoresed and gene scanned on the same plate.
Data analysis
An allele sharing co-efficient (Bowcock et al., Reference Bowcock, Ruiz-Linares, Tomfohrde, Minch, Kidd and Cavalli-Sforza1994) in Excel microsatellite toolkit (http://animalgenomics.ucd.i.e./sdepark/ms-toolkit/) was used for the similarity comparison of the MLGs (Peakall and Smouse, Reference Peakall and Smouse2006, Reference Peakall and Smouse2012). Similarity analysis was determined by constructing a similarity matrix. This was then utilized to conduct principal coordinate analysis (PCoA) and analysis of molecular variance (AMOVA) using the Excel plug-in software GenAIEx6 (http://www.anu.edu.au/BoZo/GenAIEx/) (Peakall and Smouse, Reference Peakall and Smouse2006, Reference Peakall and Smouse2012). The FSTAT computer package version 2.9.3.2 was used to calculate estimates of F statistics for population genetic analysis (http://www2.unil.ch/popgen/softwares/fstat.htm). LIAN (http://adenine.biz.fh-weihenstephan.de/lian/) was used to test the null hypothesis of linkage equilibrium by calculating a quantification of linkage equilibrium/linkage disequilibrium called the standardized index of association (I AS) (Haubold and Hudson, Reference Haubold and Hudson2000). The statistical independence of alleles at all pairwise combinations of loci under study characterizes linkage equilibrium (LE) and this independent assortment was initially tested by LIAN by determining the number of loci at which each pair of MLGs differs. The mismatch values from this distribution were then used to calculate the variance (V D) which was then compared to the variance expected (V E) for LE. Monte Carlo (MC) computer simulation was used to test the null hypothesis that V D = V E. The computer software calculates a 95% confidence limit L. When V D was greater than critical limit L, the null hypothesis of LE is rejected.
Mixed infection of different genotypes was indicated by the presence of several alleles at a locus in one sample. To determine the multiplicity of infection at the nine loci used, the mean number of alleles in each sample was calculated. Finally, the mean for each population as well as the combined population from the index value of each sample was also calculated to show the overall multiplicity of infection for each population and combined population.
Results
Confirmation of Theileria parva infection by PCR
Only samples from Likasi, LUANAR and Mikolongwe (n = 173) were screened in this study while samples from Kasungu, Nkhotakota and Katete were screened in a previous study (Chatanga et al., Reference Chatanga, Hayashida, Muleya, Kusakisako, Moustafa, Salim, Katakura, Sugimoto, Nonaka and Nakao2020). The positive rates for Likasi, LUANAR and Mikolongwe were 18% (17/95), 32% (17/53) and 25% (7/28), respectively. Likasi farm had the least positive rate at 18% despite having high number of sampled animals. The findings of this study confirm for the first time, the presence of T. parva infection in cattle from the southern region using molecular techniques.
Satellite marker diversity and allelic variation
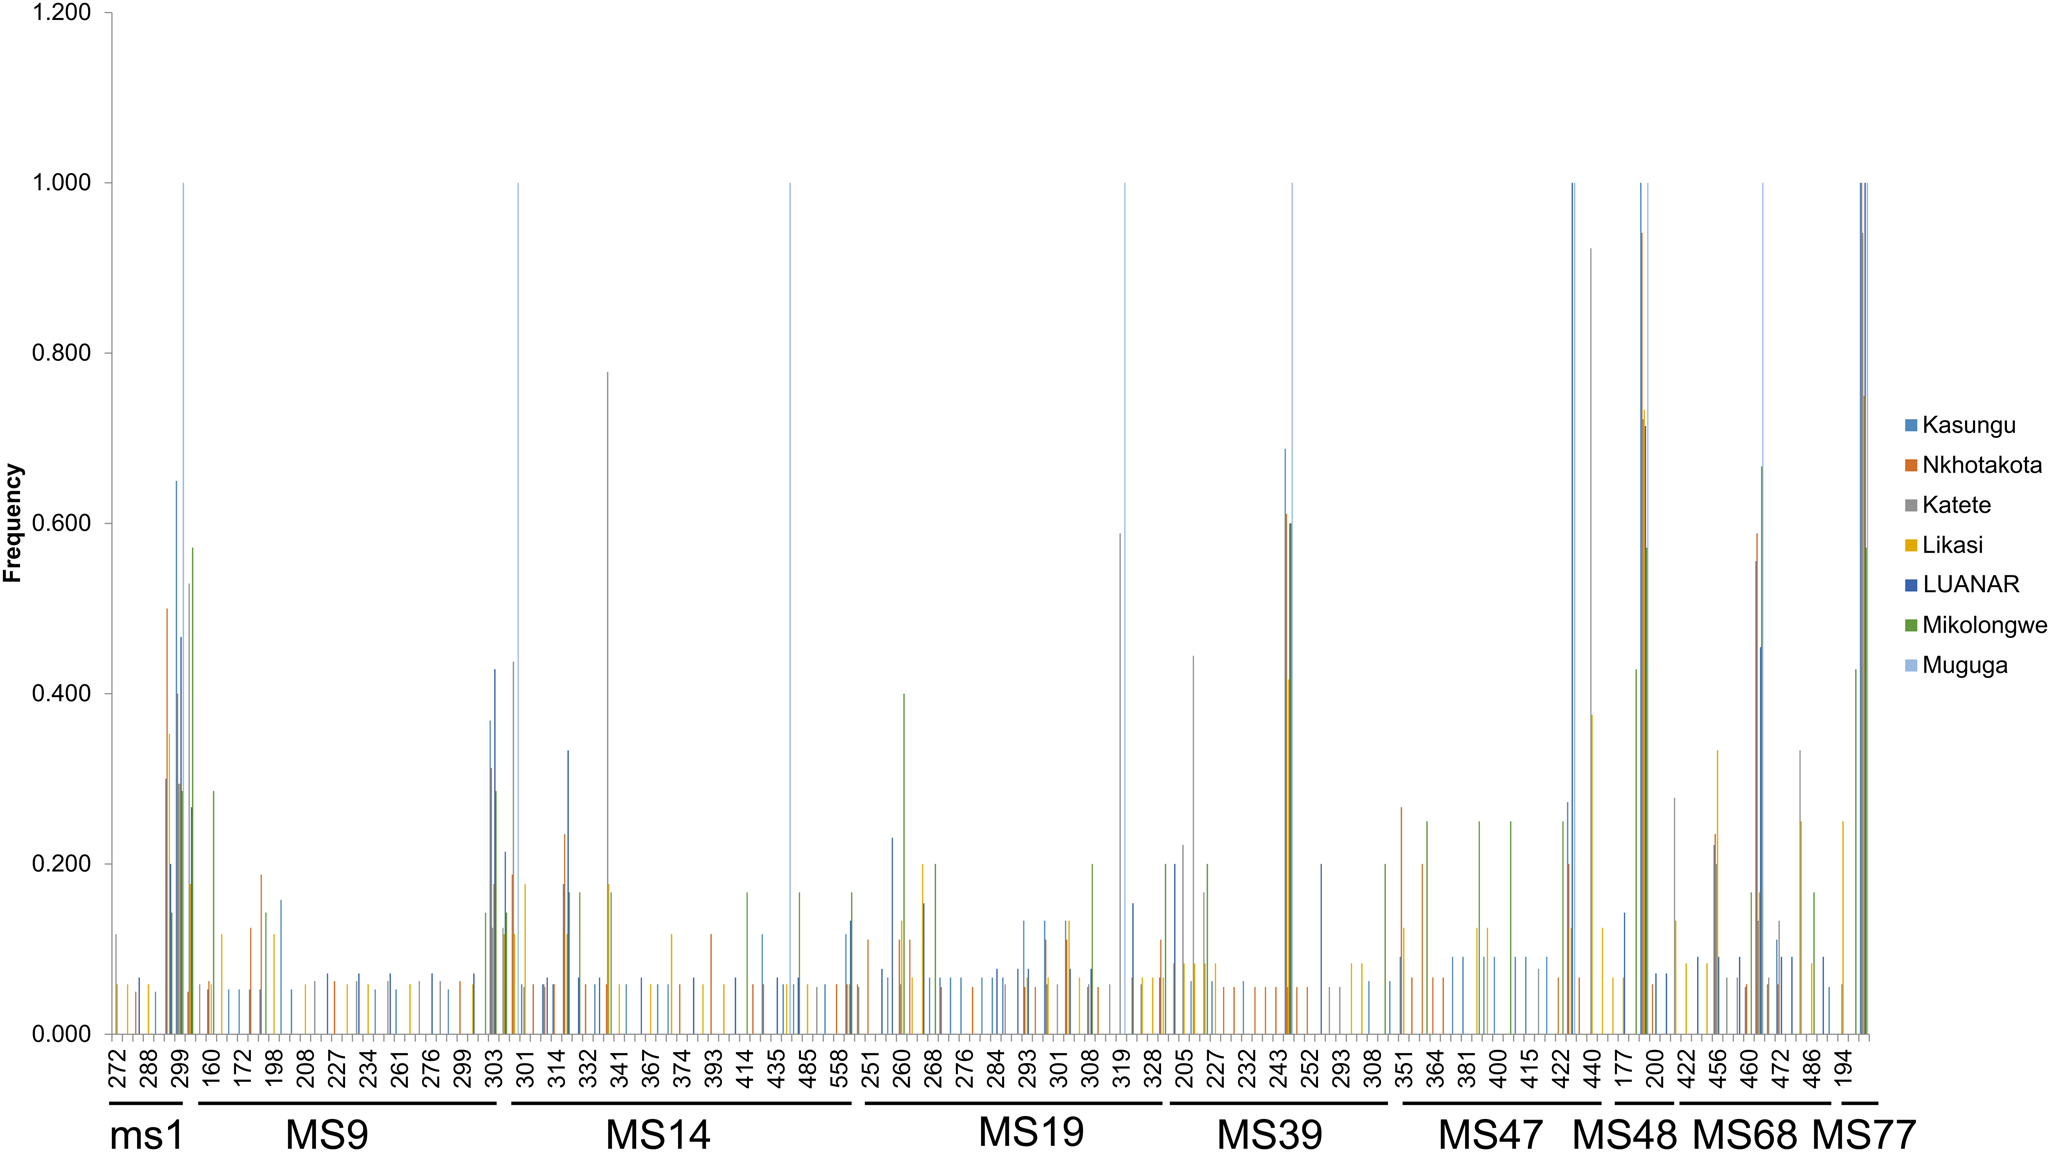
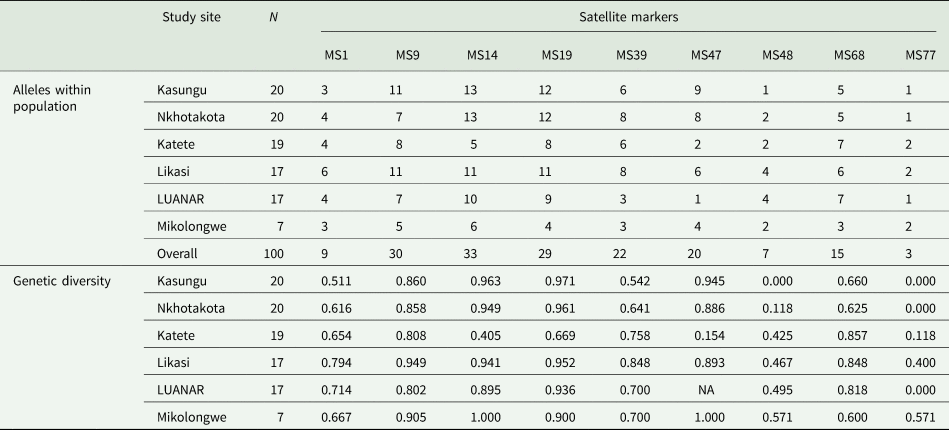
The number of alleles per locus ranged from 3 in marker MS77 to 33 in marker MS14 (Table 2), and the average number of alleles observed per locus was 18.67 (Table 3). Markers MS14, MS9 and MS19 had the highest number of alleles (33, 30 and 29 alleles, respectively). Shared alleles were observed at all the 9 loci investigated with no locus with unique alleles for a particular population (Fig. 2). The number of shared alleles ranged from 2 at locus MS77 to 10 at loci MS14 and MS19 (Fig. 2). Similarly, genetic diversity of the 9 loci investigated showed that markers MS48 and MS77 were the least diverse in all the six populations. The populations from Kasungu and Nkhotakota showed low or no diversity at the loci MS48 and MS77 (Table 2). Similarly, the population from LUANAR showed no diversity at locus MS77, but the diversity of marker MS47 could not be determined in this population due to the low number of samples (n = 3) successfully amplified (Table 2).
Allele frequencies of alleles in field populations of Theileria parva from Kasungu, Nkhotakota, Katete, Likasi, LUANAR and Mikolongwe and the Muguga reference laboratory strain. Shared alleles were observed at all the loci investigated. Multi-locus genotype (MLG) data were used to generate the histogram. The frequency of each predominant allele was calculated as a proportion of the total of each marker.

Allelic variation among Theileria parva from cattle in Malawi

N, number of samples; NA, not determined.
Population genetic analyses of Theileria parva in Malawi

N, number of samples; H, estimated heterozygosity; IAS, standard index of association; VD, mismatch variance (linkage analysis); L, upper 95% confidence critical limits of Monte Carlo simulation; LD, linkage disequilibrium; LE, linkage equilibrium; FST, Wright's fixation index.
Population diversity structure
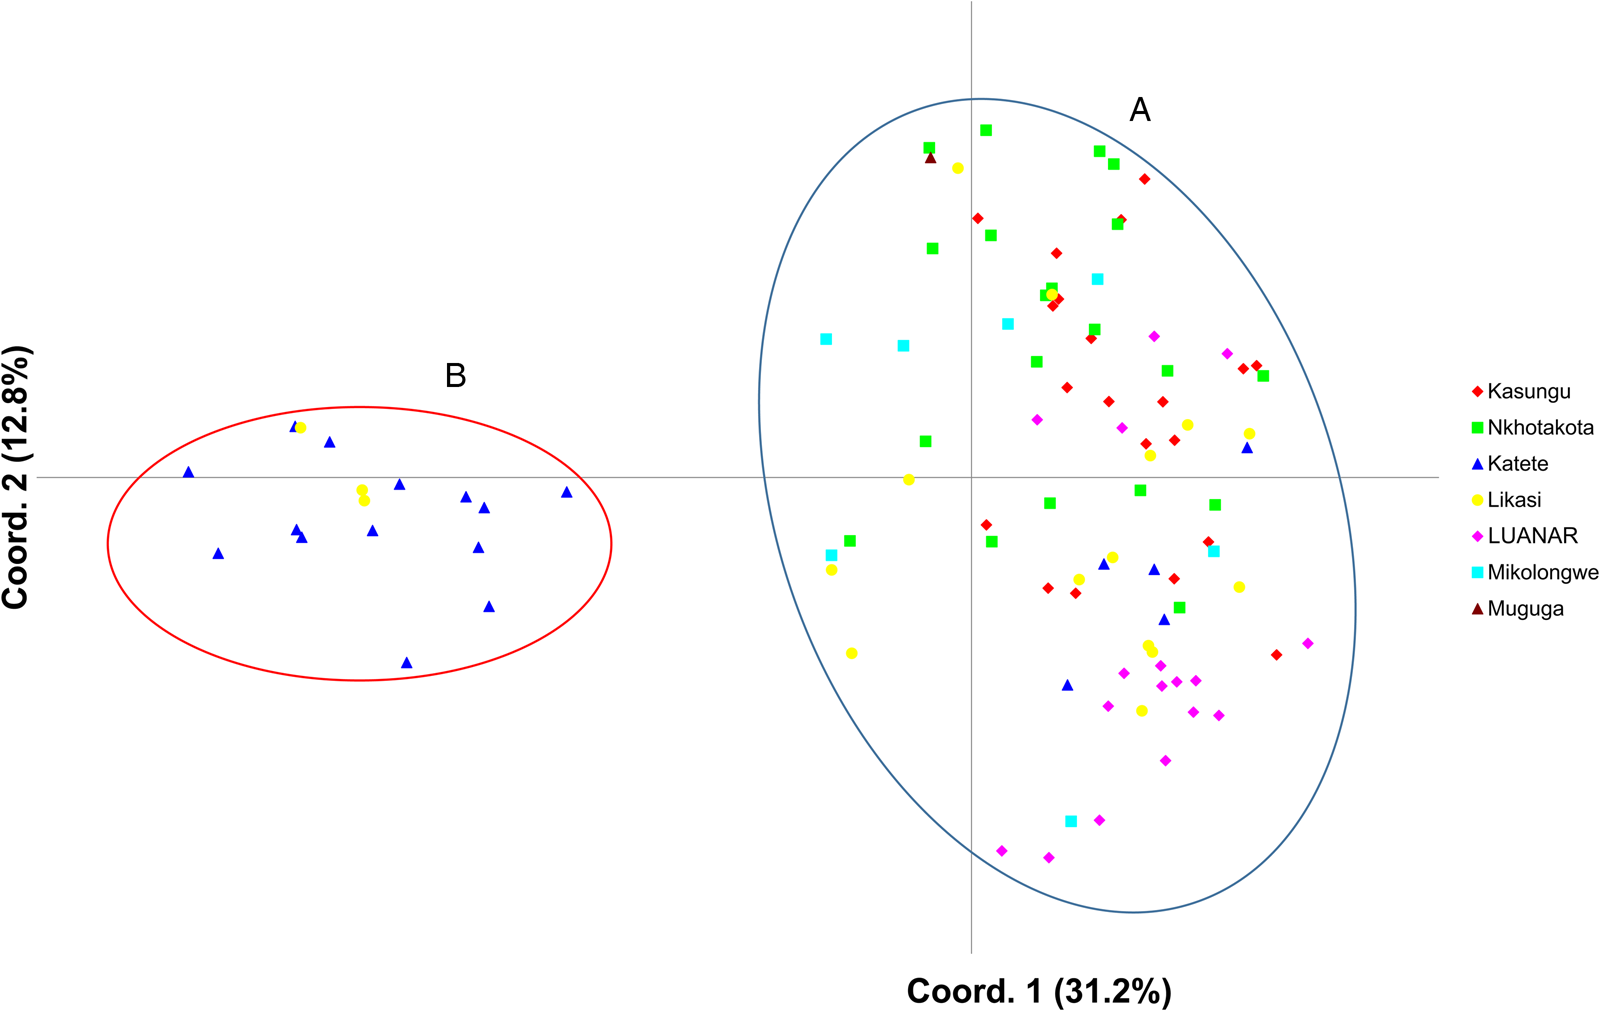
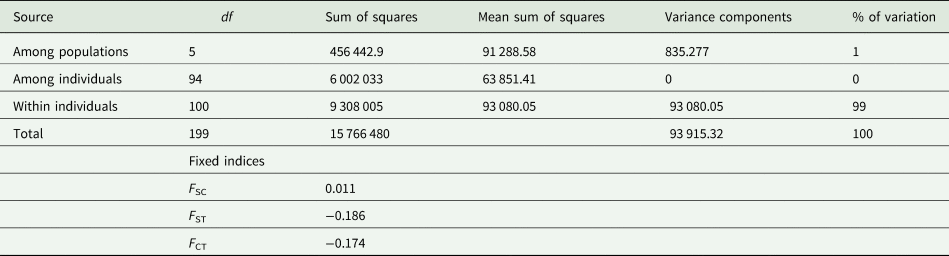
The PCoA of T. parva for the six cattle populations in Malawi and the T. parva Muguga reference strain showed that there were two clusters designated as cluster A and B (Fig. 3). Cluster A had the majority of samples (n = 83) from all the six sampling sites and the T. parva Muguga reference strain while cluster B, had 17 samples from Katete (n = 14) and Likasi (n = 3) farms from the central region. Interestingly, it was observed that even samples from areas without T. parva Muguga cocktail vaccination history, clustered together with T. parva Muguga strain (Fig. 3). The analysis of molecular variance (AMOVA) showed that the genetic variation observed was mainly within populations (99%) while that due to differences between populations was only 1% (Table 4).
Principal coordinate analysis (PCoA) of Theileria parva populations from Malawi and the Muguga reference laboratory strain. The proportion of variation in the population dataset explained by each axis is shown in parentheses. The PCoA was performed using multi-locus genotype data from Kasungu, Nkhotakota, Katete, Likasi, LUANAR and Mikolongwe and Muguga laboratory reference strain.

Analysis of molecular variance (AMOVA) of Theileria parva in Malawi

df, degrees of freedom; FSC, variation among populations within groups; FST, measure of population differentiation due to genetic structure; FCT, Variation among groups of populations.
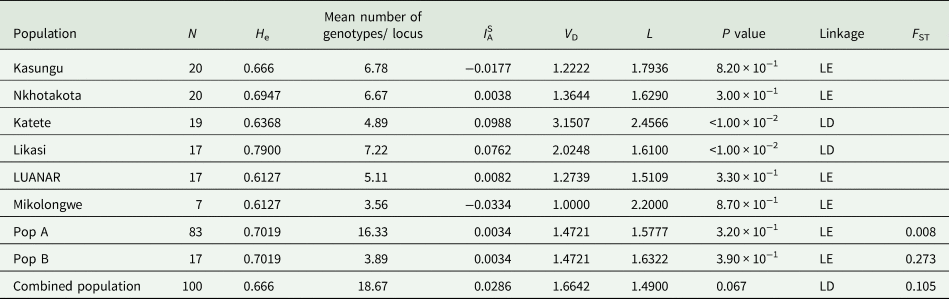
The analysis of the allelic profile data used to determine the linkage of T. parva in Malawi showed that when all the six sub-populations were combined as a single population the standardized index of association (ISA) was greater than zero (0.0286). Furthermore, the pairwise variance (V D) was greater than the 95% critical L value (M L) which indicated linkage disequilibrium (Table 3). However, when each sub-population was treated separately, it was observed that most populations (4 out of 6) had an ISA which was either negative or close to zero and the VD was less than the M L indicating linkage equilibrium (Table 3). Katete and Likasi populations showed linkage disequilibrium when treated separately (Table 3). When populations A and B were treated as separate and individual populations as per PCoA clustering (Fig. 3), both populations were found to be in LE (Table 3).
To determine the differences among the sampled populations, the estimated heterozygosity (H e) and mean number of genotypes/locus were calculated for each of the six population. The estimated heterozygosity (H e) ranged from 0.6127 for Mikolongwe and LUANAR to 0.7900 for Likasi (Table 3). The mean number of genotypes/locus ranged from 3.56 to 7.22 for Mikolongwe and Likasi, respectively (Table 3). The overall estimated heterozygosity (H e) and mean number of genotypes/locus for the combined population was 0.666 and 18.67, respectively.
To determine the degree of genetic differentiation, the Wright's F index was calculated for each of the two clusters based on the PCoA. Cluster A which had majority of the isolates had an F ST value of 0.008 while cluster B with isolates from Likasi and Katete had an F ST value of 0.273 (Table 3). This finding shows significant differences between these two clusters. The combined population had an F ST value of 0.105 (Table 3).
Multiplicity of infection
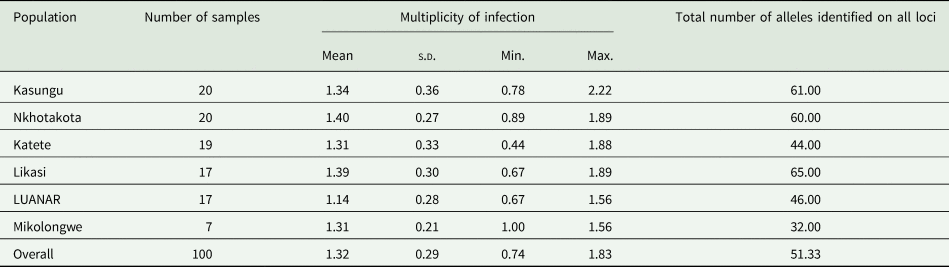
Multiple genotypes of T. parva were observed in the majority of the samples regardless of the sampling site and region. The multiplicity of infection in the six sub-populations ranged from 1.14 to 1.40 for the population from Mikolongwe and Nkhotakota, respectively as estimated by the calculated mean number of genotypes/locus (Table 5). The standard deviation ranged from 0.21 to 0.36 for Mikolongwe and Kasungu populations, respectively. The combined population had the mean value of 1.32 and a low standard deviation of 0.29 (Table 5).
Multiplicity of infection of Theileria parva in Malawi

s.d., standard deviation; Min. and Max. refer to the minimum and maximum, respectively, for the number of alleles identified per locus per sample. The summary of the number of the alleles per locus for each population is provided in Table 2.
Discussion
Knowledge about the genetic information and population structure of T. parva is a pre-requisite to the conception of effective control measures and monitoring of current measures (Lubembe et al., Reference Lubembe, Odongo, Salih and Sibeko-Matjila2020). However, this information is not available in most southern African countries including Malawi although it is one of the endemic regions. Theileria parva is the most important tick-borne pathogen in Malawi and is endemic in the central and northern regions (DAHLD, 2006). Current control measures in use include immunization using T. parva Muguga cocktail live sporozoite vaccine for exotic, crossbreed cattle and Malawi zebu calves below 6 months in the endemic areas (Lawrence et al., Reference Lawrence, Musisi, Mfitilodze, Tjornehoj, Whiteland, Kafuwa and Chamambala1996; Perry, Reference Perry2016). To understand the genetic composition and population structure of T. parva in Malawi, nine mini- and microsatellite markers were employed to examine 100 T. parva samples from six populations; five in the central region where ECF is endemic and one in the southern region which has traditionally been considered as non-endemic until this study. To control the spread of ECF in Malawi, movement of animals from the ECF endemic northern and central regions to the non-endemic southern region is not allowed and vaccination with T. parva Muguga cocktail is not permitted in the latter (DAHLD, 2006).
Almost all the populations investigated had high mean genetic diversity (estimated heterozygosity) that ranged from 0.612 for Mikolongwe and LUANAR to 0.790 for Likasi. The lower estimated heterozygosity at Mikolongwe may be due to limited number of samples as it had the least number of samples among the populations examined. Further, this observation may result from the pathogen being newly introduced in this region as reported previously in South Sudan (Marcellino et al., Reference Marcellino, Salih, Njahira, Ndiwa, Araba, El Hussein, Seitzer, Ahmed, Bishop and Skilton2017; Salih et al., Reference Salih, Mwacharo, Pelle, Njahira, Odongo, Mbole-Kariuki, Marcellino, Malak, Kiara, El Hussein, Bishop and Skilton2018). The lower He for LUANAR could be due to reduced exposure of the animals to the parasites as the animals are kept for a short period of time. The animals are disposed after some studies are concluded at the student farm unlike the other farms which keep animals for longer periods. The high estimated heterozygosity at Likasi farm is also supported by the PCoA results which showed that the isolates at the farm separated into two clusters and majority were in cluster A while the rest were in cluster B. The higher expected genetic diversity observed at Likasi may result from longer history of genetic recombination than the other populations as it was used as a trial site when the T. parva Muguga cocktail live vaccine was being developed for the eastern and southern Africa region (Dolan, Reference Dolan1988; Lawrence et al., Reference Lawrence, Musisi, Mfitilodze, Tjornehoj, Whiteland, Kafuwa and Chamambala1996). The overall estimated heterozygosity for Malawi combined population of 0.67 is close to the values reported in Zambia (0.75) (Muleya et al., Reference Muleya, Namangala, Simuunza, Nakao, Inoue, Kimura, Ito, Sugimoto and Sawa2012), South Sudan (0.73) (Salih et al., Reference Salih, Mwacharo, Pelle, Njahira, Odongo, Mbole-Kariuki, Marcellino, Malak, Kiara, El Hussein, Bishop and Skilton2018) and Tanzania (0.79) (Rukambile et al., Reference Rukambile, Machuka, Njahira, Kyalo, Skilton, Mwega, Chota, Mathias, Sallu and Salih2016). However, it is lower than the 0.91 reported in Burundi (Atuhaire et al., Reference Atuhaire, Muleya, Mbao, Niyongabo, Nyabongo, Nsanganiyumwami, Salt, Namangala and Musoke2021) and the 0.81 from the study combining eastern and southern Africa isolates from cattle and buffaloes (Lubembe et al., Reference Lubembe, Odongo, Salih and Sibeko-Matjila2020). This observation may be due to the fact that the study either included samples from buffaloes or involved sampling from a wider geographical area resulting in a higher mean genetic diversity.
The observation of shared alleles in most samples from most of the sampled populations at all loci investigated shows that almost similar strains of T. parva are circulating among cattle in Malawi. This has also been strongly supported by the PCoA in which the majority of samples from the six populations together with the T. parva Muguga reference strain clustered in population A. This finding is in accordance with a previous study based on Tp1 and Tp2 genes, which showed that most sequences were either identical or similar to T. parva Muguga, T. parva Kiambu-5 and T. parva Serengeti transformed, the components of T. parva Muguga cocktail vaccine (Chatanga et al., Reference Chatanga, Hayashida, Muleya, Kusakisako, Moustafa, Salim, Katakura, Sugimoto, Nonaka and Nakao2020). However, the presence of a separate minority population (cluster B), different from the T. parva Muguga reference strain, was also indicated as per PCoA results and the F ST value of 0.271 between population A and B. The majority of samples from this minority population originated from Katete (n = 17) with Likasi only contributing three (3). The separate population at Katete may result from it being a closed population that does not allow introduction of animals from other farms in Malawi which may introduce other T. parva strains circulating in other cattle populations in Malawi. Since some of the sampled animals were only immunized 2 years and 3 months before the sampling, it may help to explain why only a few samples from the farm clustered in majority of the population The other isolates at Katete farm that clustered in population A may be due to immunization with the T. parva Muguga cocktail vaccine. Although, the other farms also have restricted access to other animals, they allow breeding stock from smallholder farmers in Malawi into their population which is likely to explain the relatedness with those populations from smallholder farmers. The finding of mixed genotypes within a sample shows that mixed infections of T. parva are common among cattle in Malawi. This may be due to prolonged exposure to ticks and the complex life cycle to T. parva which include sexual and asexual stages in the vector tick and host cattle, respectively (Katzer et al., Reference Katzer, Ngugi, Walker and McKeever2010). The genetic recombination phenomenon of T. parva in the vector tick which it has adopted as a strategy to survive and drive genetic diversity ensures that host cattle can still be infected with new strains (Oura et al., Reference Oura, Odongo, Lubega, Spooner, Tait and Bishop2003).
AMOVA showed that T. parva isolates in cattle in Malawi have high chance of exchanging genetic material within each population than between populations. However, the population at Katete was exceptional to this observation. This finding may be due to the point that the immunization with Muguga cocktail vaccine was just done 2 years and 3 months before sampling in some animals which may not have provided enough time for the exchange of genetic material to occur. This was supported by the high genetic variation observed within the population (99%) than between populations (1%). This finding is also in agreement with previous studies which reported similar findings in other countries (Salih et al., Reference Salih, Mwacharo, Pelle, Njahira, Odongo, Mbole-Kariuki, Marcellino, Malak, Kiara, El Hussein, Bishop and Skilton2018; Lubembe et al., Reference Lubembe, Odongo, Salih and Sibeko-Matjila2020). As reported previously by Salih et al. (Reference Salih, Mwacharo, Pelle, Njahira, Odongo, Mbole-Kariuki, Marcellino, Malak, Kiara, El Hussein, Bishop and Skilton2018) in South Sudan, the findings of this study do not support the presence of any correlation between genetic structure of a population and the geographical location of the isolates.
Linkage analysis showed that the majority of the individual populations were in linkage equilibrium and thus in panmixia, further supporting the results of PCoA and AMOVA that gene flow is likely to occur within a particular population. Although this finding is not in agreement with that reported in Zambia (Muleya et al., Reference Muleya, Namangala, Simuunza, Nakao, Inoue, Kimura, Ito, Sugimoto and Sawa2012), it is however supported by the findings by Lubembe et al. (Reference Lubembe, Odongo, Salih and Sibeko-Matjila2020) that individual populations in southern Africa are in linkage equilibrium. When the populations were combined, linkage disequilibrium was observed. This may be due to Katete farm being a closed population that makes it difficult for random mating to occur even with other populations within a 50 km radius. When the population from Katete was excluded, the combined population was in linkage equilibrium even with those from Mikolongwe with almost 500 km distance from the other population. Currently, there seems to be an increase in the detection of infections in the south of the country, this might be attributed to human-assisted movement of animals from endemic to no-endemic regions despite having the livestock movement ban in place. Thus, there is a need to revise the current control measures so that this trend can be reversed.
In conclusion, this study has for the first time provided molecular evidence of the presence of T. parva infection in cattle in the southern region of Malawi. Further, the findings have shown that the T. parva population in southern Malawi is closely related to the populations in the central region which is endemic to ECF. The study has also shown that T. parva genotypes circulating in both the vaccinated and unvaccinated cattle in Malawi are closely related. It has also been shown that there is presence of sub-structuring among the samples investigated. Generally, the population of T. parva in Malawi is not panmictic but individual populations are in panmixia. Furthermore, it has been shown that in Malawi there are at least two clusters of T. parva, one that is closely related to T. parva Muguga reference strain and another that is separate and different from the T. parva Muguga cocktail vaccine strain. It is therefore important to carry out a nationwide study to provide a comprehensive genetic population structure of T. parva in Malawi and to include samples from the neighbouring countries to determine the relatedness of the isolates in the region. This will help to assess the impact of the T. parva strains that are different from the T. parva Muguga cocktail vaccine strain on the control of ECF in Malawi in particular and southern Africa as a region in general.
Data
All the data generated in this study has been provided in this paper.
Acknowledgements
The authors are thankful to the management of the African Union Centre of Excellence for Ticks and Tick-borne Diseases (CTTBDs), Lilongwe, Malawi for providing laboratory space during the sampling period. The authors also wish to extend their sincere appreciation to Professor Richard Bishop for providing the Theileria parva Muguga reference strain to Professor Chihiro Sugimoto which was used as a reference strain.
Author contributions
E. C., W. M. & R. N. conceived and designed the study. E. C. conducted the experiments. E. C., Y. O. & W. M. performed the population genetic and statistical analyses. E. C. wrote the original manuscript. W. M., K. H., C. S. & R. N. provided resources. R. N. & C. S. obtained funding. K. H., C. S., K. K., N. N. & R. N. supervision, writing review and editing. All authors approved the submitted final version of the manuscript.
Financial support
This study was financially supported in part by J. S. P. S. KAKENHI (grant numbers 19H03118, 20K21358 and 20KK0151). International Collaborative Research Programme for Tackling Neglected Tropical Disease (NTD) Challenges in African countries (JP18jm0510001) of Japan Agency for Medical Research and Development (AMED). The funders had no role in study design, data collection and analysis, decision to publish or preparation of the manuscript.
Conflict of interest
The authors declare there are no conflicts of interest.
Ethical standards
This study was approved by Ministry of Agriculture, Irrigation and Water Development (MoAIWD) in Malawi through the Department of Animal Health and Livestock Development (DAHLD) reference number 10/15/32/D and informed consent was obtained from the owners/custodians.