INTRODUCTION
The rate at which a lactating dairy cow secretes water, fat, protein and lactose into milk depends on nutrition, environment and genetics. Prediction of milk component yields has economic value for the management of farm resources and food production, and scientific value for the testing of hypotheses of lactation biology. The unique anatomy of the mammary glands, where milk precursors enter from a single arterial source and milk products exit stoichiometrically via a physically distinct ductal network, means that data can be obtained to treat the mammary glands as a closed system. Simulation models of the mammary system use arterial concentrations of the milk precursors as inputs from which yields of milk components are predicted (Hanigan & Baldwin Reference Hanigan and Baldwin1994; Cant & McBride Reference Cant and McBride1995; Cherepanov et al. Reference Cherepanov, Danfær and Cant2000; Hanigan et al. Reference Hanigan, Crompton, Metcalf and France2001). However, it has become apparent from observations of decreasing mammary plasma flow (MPF) when milk precursor concentrations are high (Cant et al. Reference Cant, De Peters and Baldwin1993a, Reference Cant, DePeters and Baldwinb; Reference Cant, Trout, Qiao and Purdie2002) or increasing MPF when they are low (Bequette et al. Reference Bequette, Hanigan, Calder, Reynolds, Lobley and MacRae2000), and from observations of small effects on milk component yields in response to large changes in precursor concentrations (Cant et al. Reference Cant, Trout, Qiao and McBride2001, Reference Cant, Trout, Qiao and Purdie2002; Purdie et al. Reference Purdie, Trout, Poppi and Cant2008), or from component yields going in opposite directions to precursor concentrations (Mackle et al. Reference Mackle, Dwyer, Ingvartsen, Chouinard, Ross and Bauman2000), that something other than arterial concentration of nutrients is communicating metabolic priorities to the mammary glands. Cant et al. (Reference Cant, Qiao, Toerien, Lobley, White and MacRae1999) proposed that control of the milk-synthesizing system should be conceptualized as a central coordinating (e.g. neuroendocrine) sub-system that signals a desired level of mammary activity, called the setpoint. That setpoint may be in terms of adenosine triphosphate (ATP) production and utilization, oxygen consumption, lactose synthesis, milk protein yield or some combination of such fluxes.
To incorporate the setpoint concept into a model of a closed mammary system, milk protein yield was chosen as the function, which is regulated by the central coordinating force, and for which the mammary glands use the local controls over plasma flow rate and nutrient uptake to maintain. The choice is based on results from euglycaemic insulin infusions into dairy cows, where milk protein yield has increased despite a drop in circulating concentrations of several amino acids (AAs) as observed by Griinari et al. (Reference Griinari, McGuire, Dwyer, Bauman, Barbano and House1997b) and by Mackle et al. (Reference Mackle, Dwyer, Ingvartsen, Chouinard, Lynch, Barbano and Bauman1999). The increment of milk protein yield can be interpreted as being due to the hormonal dictate, while the accompanying increases in MPF, proportion extraction of essential AA from plasma and uptake of glucose (Mackle et al. Reference Mackle, Dwyer, Ingvartsen, Chouinard, Ross and Bauman2000) can be attributed to local mammary controls. A similar interpretation can be applied to the His subtraction experiment of Bequette et al. (Reference Bequette, Hanigan, Calder, Reynolds, Lobley and MacRae2000), in which an increased MPF and extraction of plasma His attenuated a potentially severe drop in milk protein yield. Both sets of evidence support the hypothesis that milk protein yield is one of the setpoints of mammary gland function so that when milk protein yield potential is changed as a consequence of controls over milk protein transcription and translation (Cant et al. Reference Cant, Qiao, Toerien, Lobley, White and MacRae1999), the tissue implements several local strategies to maintain the necessary AA supply.
In the present paper, the structure and behaviour of a mathematical model of the mammary glands of lactating cows are described based on equations where nutrient supply and uptake is locally regulated by a centrally dictated rate of milk protein yield.
MODEL DESCRIPTION
Overall structure
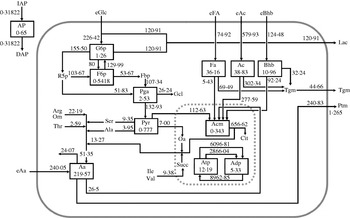
The reference steady state of metabolite flows in the model is shown in Fig. 1. The fate of AA in the mammary gland is based on the uptake:output patterns suggested by Mepham (Reference Mepham1982), with biochemical transactions according to Annison (Reference Annison and Mepham1983). Metabolism in the model takes into account glycolysis, the pentose-phosphate pathway and the tricarboxylic acid (TCA) cycle, employing stoichiometries presented by Baldwin & Yang (Reference Baldwin, Yang, Larson and Smith1974). Milk fat, 0·98 of which is triacylglycerol (TAG; Dils Reference Dils and Mepham1983), is synthesized by the biochemical pathways presented by Bauman & Davis (Reference Bauman, Davis, Larson and Smith1974) and Dado et al. (Reference Dado, Mertens and Shook1993). Synthesis of lactose is based on Baldwin & Yang (Reference Baldwin, Yang, Larson and Smith1974).
Reference steady state diagram. Each individual compartment is represented through a box. Symbols are described in Table 2. AP is the volume of tissue actively perfused by blood. Fluxes are mmol/h except for IAP and DAP. Numbers in the boxes indicate the initial condition size of the compartment (mmol).

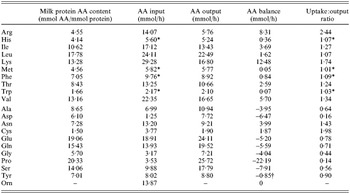
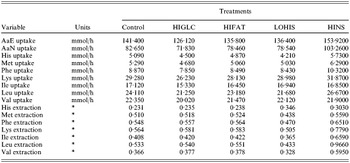
Steady-state rates of metabolite flux through each pathway (Fig. 1) were calculated for a reference state based on data for lactating Holstein cows duodenally infused with 30 g/d of Lys to assure the whole of AA requirements (Guinard & Rulquin Reference Guinard and Rulquin1994). The reference profile of FAs circulating in blood non-esterified FA (NEFA) and TAG, and in milk fat was adapted from Bickerstaffe et al. (Reference Bickerstaffe, Annison and Linzell1974). In order to balance uptake with output and catabolism, some adjustments of nutrient concentrations in blood, milk protein output, AA uptakes, FA uptake and milk FA profile were required. Reference extraction rates of His and Met were set to proportions of 0·231 and 0·510, respectively. These latter values lie within the range reported in the literature for the given plasma arterial concentrations (Metcalf et al. Reference Metcalf, Wray-Cahen, Chettle, Sutton, Beever, Crompton, Macrae, Bequette and Backwell1996; Korhonen et al. Reference Korhonen, Vanhatalo and Huhtanen2002). Reference extractions of glucose, acetate, β-hydroxybutyrate and long-chain FA were set to 0·232, 0·650, 0·400 and 0·500, respectively. The AA content of milk proteins was calculated on the basis of the milk protein fractions reported by Dalgleish (Reference Dalgleish1993) and their AA profiles (Walstra & Jenness Reference Walstra and Jenness1984). Tryptophan was also included in the balance assuming an input:output ratio equal to 1 (Mepham Reference Mepham1982). Uptake:output ratios for the individual AA are presented in Table 1. Finally, the reference MPF was set to 415 litres/h.
AA content in milk protein and balance across the gland in the reference state

* Input of His, Met, Phe and Trp adjusted assuming contribution of small peptides.
† Assuming that excess of Phe assures Tyr synthesis (Jorgensen & Larson Reference Jorgensen and Larson1968).
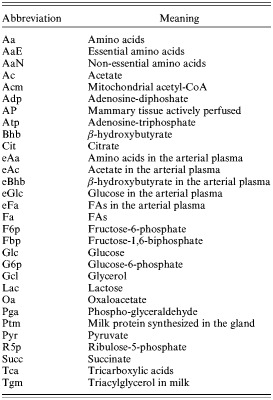
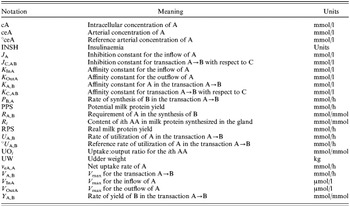
Abbreviations used in the model are listed in Table 2 and general notation of the equations is described in Table 3. The model consists of 12 differential equations (see Appendix), 11 of which are concerned with intracellular biochemical compartments (Aa, Ac, Acm, Adp, Atp, Bhb, Fa, F6p, G6p, Pga and Pyr; Table 2) while the remaining compartment describes the fraction of tissue actively perfused by blood plasma (AP). Initial sizes of the individual compartments at t 0 in the reference state are set to 0·65 for AP and 219·57, 38·83, 0·343, 5·33, 12·19, 10·96, 36·16, 0·5418, 1·26, 2·53 and 0·777 mmol for Aa, Ac, Acm, Adp, Atp, Bhb, Fa, F6p, G6p, Pga and Pyr, respectively. The rate of change of a compartment size (Q i) is described through a differential equation. For the 11 biochemical compartments the conservation of mass principle holds, as follows:

With the aim of speeding up model solution, initial sizes of the compartments Acm, Adp, Atp, F6p, G6p and Pyr were inflated (Baldwin Reference Baldwin and Baldwin1995) by a factor f equal to 10, 10, 8, 10, 10 and 5, respectively. For compartments which were not inflated, f=1. The intracellular concentration of the ith metabolite (cQi, mM) is calculated as:

where ICvol is the intracellular volume (litres) of the tissue:

where UW is the udder weight (kg) computed as 0·0367 of body weight, and 0·741 litre/kg is the water content of the udder (Gibb et al. Reference Gibb, Ivings, Dhanoa and Sutton1992).
Abbreviations used in the model

General notation in the equations of the model

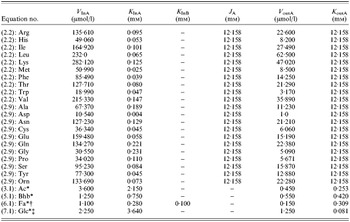
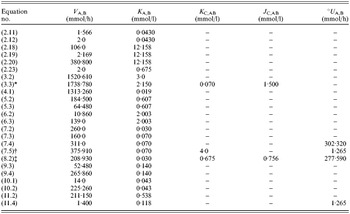
All model parameters are presented in Tables 4 and 5. To parameterize the Michaelis–Menten (MM) equations, affinity (K m) and inhibition constants (J C,AB) were assumed to be equal to the reference concentration of substrate. Reference cA was computed by dividing the initial size of the compartments (Fig. 1) by the reference intracellular volume (i.e. 18·06 litres). Reference °ceA are presented under the control treatment in Table 6. The values of some parameters were adjusted according to model behaviours encountered during testing. After selecting values for K m or J C,AB, the V max of the MM equations were calculated from the reference flux (Fig. 1). The parameters for which adjustments from the standard parameterization procedure were required are described here in the text.
MM parameters of the equations describing uptakes of nutrients

MM parameters of the equations describing transactions

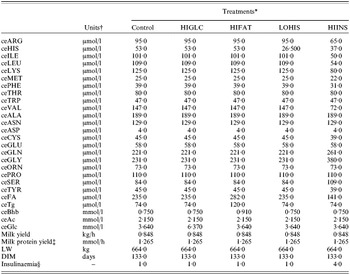
Inputs for analysis of model responses to glucose infusion (HIGLC), fat feeding (HIFAT), His subtraction (LOHIS) and euglycaemic insulin infusion (HIINS)

* Control: control, i.e. reference state; HIGLC, increase in local arterial concentration of glucose; HIFAT, increase in arterial concentration of TAG, NEFA and Bhb; LOHIS, decrease in arterial concentration of His; HIINS, adoption of hyperinsulinaemic euglycaemic clamp.
† Metabolites concentration in arterial plasma.
‡ Only milk protein synthesized in the gland (0·96 of total, Walstra & Jenness Reference Walstra and Jenness1984).
§ Reference value is 1·00.
Driving variables
Model inputs that drive the solution are live weight (LW, kg), days in milk (DIM, days), milk synthesis rate at 133 DIM (MS°, kg/h/kg UW), potential milk protein yield, which corresponds to the hourly yield of milk protein in the mammary tissue (PPS, mmol/h), insulinaemia (INSH) expressed relative to basal insulin concentration, and concentrations in arterial plasma (mM) of individual AA, acetate, β-hydroxybutyrate, glucose, TAG and NEFA.
MPF
MPF in the model is related to AP which, in the reference state, is set to an intermediate value of 0·650 (Renkin Reference Renkin, Renkin and Michel1984). The rate of change in AP is described by Eqn (1.0; see Appendix), where IAP, increase in tissue actively perfused, represents the metabolic tissue processes that stimulate MPF and DAP, decrease in tissue actively perfused, represents processes that inhibit MPF.
Milk protein production is the driving force promoting an increase in MPF in the current model. Based on observations of an increase in MPF when His concentration in plasma was decreased (Bequette et al. Reference Bequette, Hanigan, Calder, Reynolds, Lobley and MacRae2000) or when insulin stimulated milk protein yield (Mackle et al. Reference Mackle, Dwyer, Ingvartsen, Chouinard, Ross and Bauman2000), IAP is calculated (Eqn 1.1) as a function of the simulated milk protein yield (RPS; Eqn 2.21), when it is less than the potential milk protein yield (PPS), and of the insulinaemic status (INSH) of the cow. In the reference state, PPS (an input of the model) and RPS are equal at 1·265 mmol/h. When RPS is lower than PPS during simulation, IAP is elevated, AP rises and consequently MPF increases. INSH is an input of the model which in the reference state is set to 1·00. The term 0·350 is the complement to 1 for the AP, set to 0·650 in the reference state, while 0·035 was selected during early model development on the basis of model response. Following Cant & McBride (Reference Cant and McBride1995), energy charge of the tissue (expressed as cAtp/cAdp) is the driving force that reduces plasma flow in the model. DAP is directly proportional to cAtp/cAdp, where adenosine diphosphate (ADP) and ATP are calculated by Eqns (11.0) and (11.1) respectively, and follows a saturating stimulation by AP (Eqn 1.2).
To obtain MPF (Eqn 1.3), AP is multiplied by: (i) the milk yield at day 133 (MS°=0·034797 kg/h/kg UW), (ii) 0·9974(DIM−133) which describes the decline, relative to day 133 in milk, in udder cell number as lactation progresses (Capuco et al. Reference Capuco, Wood, Baldwin, McLeod and Paape2001), (iii) the UW (0·0367 kg of the animal body weight; Gibb et al. Reference Gibb, Ivings, Dhanoa and Sutton1992) and (iv) the coefficient 753 litres/kg set to give the reference MPF of 415 litres/h.
AA compartment (Aa)
Inputs to the Aa pool are net uptakes of each AA from plasma (Eqn 2.1) and synthesis of non-essential AA (Eqn 2.10). Net uptakes are modelled with MM equations for both influx and efflux (Eqns 2.2 and 2.9 for essential and non-essential AA, respectively). Parameters J Aa and K OutAai are assumed equal to total intracellular AA concentration (cAa=12·158 mm), which is set to six times the total reference AA arterial concentration, consistent with the higher AA concentration observed in mammary cells with respect to plasma (Shennan et al. Reference Shennan, Millar and Calvert1997). On the basis of the response tests carried out during model development, the parameter K InLeu (0·065 mm) was adjusted and set lower than the reference °ceLeu. There are three modifiers of the essential AA influx (see Eqn 2.2) to represent the strategies followed by the gland to counterbalance a low concentration in the arterial plasma of Leu (Bequette et al. Reference Bequette, Backwell, MacRae, Lobley, Crompton, Metcalf and Sutton1996) or His (Bequette et al. Reference Bequette, Hanigan, Calder, Reynolds, Lobley and MacRae2000) or an insufficient supply of AA when mammary blood flow is decreased (Cant et al. Reference Cant, De Peters and Baldwin1993a). The V max is adjusted upward when the ith essential AA concentration in plasma (ceAaEi) decreases relative to its reference concentration (°ceAaEi), the K m is adjusted downward when milk protein yield potential from net uptake of His, Met, Phe or Leu (oRPSi; Eqns 2.3–2.7) decreases relative to the expected protein yield (ePS; Eqn 2.8), and total intracellular AA concentration (cAa) acts as an inhibitor. For His, Met, Phe and Leu, the term oRPS indicates the milk protein yield assured by the net mammary uptake predicted without any adaptation of the influx K m. Uptake is converted to protein yield potential in Eqns (2.3)–(2.7) by accounting for the uptake:output ratio (UOi) and content (Ri) of the ith AA in milk protein (Table 1), while the term 1·1 (Eqns 2.3–2.5) takes into account the contribution of the small peptides to His, Met and Phe supply (Backwell et al. Reference Backwell, Bequette, Wilson, Calder, Metcalf, Wray-Cahen, MacRae, Beever and Lobley1994; Bequette & Backwell Reference Bequette and Backwell1997). For the other essential AA (Arg, Ile, Lys, Thr, Trp and Val) the term oRPS is replaced by the minimum value of oRPS computed for His, Met and Phe (Eqn 2.7), which, along with Leu, are assumed to be the only AA whose undersupply can elicit a change in affinity of the AA transporters. This assumption is based on the first three AA (His, Met and Phe) being used exclusively for milk protein synthesis (Mepham Reference Mepham1982) and the demonstrated response of Leu extraction to its deficiency (Bequette et al. Reference Bequette, Backwell, MacRae, Lobley, Crompton, Metcalf and Sutton1996). Effects on V max and K m are set to approach maxima with an exponent <1·0 on the °ceAaEi/ceAaEi and oRPSi/ePS terms, respectively. Appropriate response of the model to circulating AA deficiencies was obtained with the exponent ε on oRPSi/ePS, set to 0·30 for His, Met, Phe and Leu and to 0·50 for all the other essential AAs. Sensitivity to inhibition by cAa was set in the physiological range with an exponent of 3·5 and inhibition constant J Aa equal to the reference cAa.
Typical mammary function is to have an excess in the uptake of essential AA relative to output in milk protein, and a deficit in non-essential AA uptake that is made up with synthesis from essential AA (Mepham Reference Mepham1982). In the model, AAs are catabolized according to an MM function of cAa (Eqn 2.18). On the basis of observations of reduced uptake:output ratios for essential AA during insulin infusion (Mackle et al. Reference Mackle, Dwyer, Ingvartsen, Chouinard, Ross and Bauman2000), the input insulin concentration (INSH) acts as an inhibitor of U Aa,Deg. Arginine and Orn are catabolized to a much greater extent than the other AA (Mepham Reference Mepham1982), so a separate MM equation (Eqn 2.19) is used to deal with excesses of these AA.
Simulation of non-essential AA synthesis is based on the sizes of the uptake deficits. Proline synthesis is calculated as the difference between uptake and output (Eqn 2.16). Because Ser and Ala are synthesized from Pyr, which is a state variable in the model, their syntheses are simulated with MM functions of cPyr (Eqns 2.11 and 2.12) where the V max is 1·566 (V Pyr,Ser) or 2·0 (V Pyr,Ala) times the Ser or Ala deficit, respectively. Glutamate, Gln, Asp and Asn are synthesized from Pyr (U Pyr,Oa) and Acm (U Acm,Cit) and from Val (U Val,SuccTca) and Ile (U Ile,SuccTca) that enter into the TCA cycle. In the reference state, the fraction of these fluxes required to supply the Glu/Gln and Asp/Asn deficits was 0·019717. This fractional conversion is used to predict synthesis of Glu, Gln, Asp and Asn (Eqn 2.13). Glycine can be synthesized from both Ser (Eqn 2.11) and Thr. The conversion of Thr to Gly is calculated as the balance between Gly uptake and output, minus the Ser excess (Eqn 2.17).
Milk protein yield is calculated on the basis of uptakes of the group I AA His, Met and Phe, which are increased by a factor of 1·09 (Eqn 2.22) to account for contributions of small peptides to their supply (Backwell et al. Reference Backwell, Bequette, Wilson, Calder, Metcalf, Wray-Cahen, MacRae, Beever and Lobley1994; Bequette & Backwell Reference Bequette and Backwell1997). The AA that supports the lowest milk protein yield determines the real protein yield (RPS). To simulate effects of energy supply, RPS is reduced by the factor Y Atp,Ptm in Eqn (2.21) when cAtp falls below the K Atp,Ptm of 0·675 mm according to Eqn (2.23) where V Atp,Ptm is 2·0. Finally, to connect milk protein production with AA use, RPS is used as the V max, adjusted for 380·8 mmol AA/mmol protein (V Aa,Ptm), in a MM function of cAa (Eqn 2.20).
Acetate compartment (Ac)
Input to the cytosolic Ac compartment is net uptake of eAc (v eAc,Ac), and the outputs are transport to mitochondria (U Ac,Acm) and milk fat synthesis (U Ac,Tgm). Net uptake is the difference between influx and efflux (Eqn 3.1), each of which is described with an MM equation. K OutAc is set to a low value of 0·253 mm to produce the high reference extraction of acetate from plasma of 0·65 at the reference cAc of 2·15 mm. Cytosolic Ac enters mitochondria for oxidation in the TCA cycle according to a Hill equation (Eqn 3.2) with a sigmoidicity exponent of 4·5, K Ac,Acm=3·0 mm and V Ac,Acm=1520·61 mmol/h. As behavioural analysis resulted in too small of a response using reference MM equation and values, an exponent and adjusted K Ac,Acm values were used so as to get consistent response in acetate oxidation. The exponent and values were obtained from behavioural analyses that resulted in too small of a response in acetate oxidation using a reference MM equation. Similarly, the use of acetate for milk fat synthesis also follows a sigmoidal relationship to cAc (Eqn 3.3) with exponent 4·5 and K Ac,Tgm equal to the reference cAc of 2·15 mm. The term K G6p,AcTgm/cG6p takes into consideration the permissive role of glucose in de novo synthesis of milk FA in which glucose provides reducing power (NADPH2) and α-glycerol-phosphate (Bauman & Davis Reference Bauman, Davis, Larson and Smith1974). The inhibitory effect of preformed FA on de novo FA synthesis (Wright et al. Reference Wright, Cant and McBride2002) is accounted for by the term cFa/J Fa,AcTgm where J Fa,AcTgm (1·50 mm) is set slightly lower than the reference cFA of 2·003 mm to achieve suitable rates of inhibition of fat synthesis and glucose oxidation.
Mitochondrial acetyl-CoA compartment (Acm)
Mitochondrial Ac is produced from Ac (Eqn 3.2), Bhb (Eqn 5.2), Fa (Eqn 6.2), Pyr (Eqn 10.2), and essential AA which enter the TCA cycle through acetyl-CoA. The latter flux is calculated by subtracting the amount of valine, which enters the TCA cycle through succinate (U Val,SuccTca; Eqn 2.14) from the total amount of essential AA degraded (Eqn 2.18). The coefficients of 8·0, 2·0 and 1·85 in Eqn (4.0) represent the molar stoichiometries of acetyl-CoA production from degradation of Fa, Bhb and Aa (Ile, Leu, Lys and Thr), respectively.
The only output from the Acm compartment is toward synthesis of citrate according to a MM equation (Eqn 4.1).
β-hydroxybutyrate compartment (Bhb)
Net uptake into the Bhb compartment from plasma (v eBhb,Bhb) is described by two MM equations (Eqn 5.1). The parameter K OutBhb (0·420 mm) was set lower than the reference cBhb according to the tests conducted during model development. β-hydroxybutyrate is either oxidized (U Bhb,Acm; Eqn 5.2) or used for milk fat synthesis (U Bhb,Tgm; Eqn 5.3), both of which are MM functions of cBhb.
FA compartment (Fa)
Like Ac and Bhb, Fa are transported bi-directionally between plasma and cell, oxidized in the TCA cycle, and used for milk fat synthesis, all described with MM equations (Eqns 6.1–6.3). The influx Eqn (6.1) considers both plasma NEFA and TAG as substrates. Uptake of FA from plasma comprises both NEFA and FA released from TAG hydrolysed in mammary capillaries. In order to calculate the contribution of FA from TAG in the reference state, a molar ratio of glycerol:FA of 1:3 was assumed. TAG extraction, representing hydrolysis, was set to 0·60 and extraction of FA (either of NEFA or released from TAG hydrolysis) was set to 0·50, close to the value of 0·473 observed by Bickerstaffe et al. (Reference Bickerstaffe, Annison and Linzell1974). On the basis of model development tests the parameters K InNefa (0·280 mm), K InTg (0·100 mm) and K OutFa (0·309 mm) were adjusted and set higher than the corresponding ceFa and ceTg and lower than the corresponding cFa.
Glucose-6-phosphate compartment (G6p)
Inputs to the G6p pool are from net uptake of plasma glucose and synthesis from F6p. Outputs are to F6p, R5p and Lac (Eqn 7.0). Uptake is the standard balance between influx and efflux (Eqn 7.1) where K G6p,eGlc (0·081 mm) is slightly higher than the reference cGlc of 0·07 mm to maintain glucose uptake and lactose synthesis when ceGlc decreases (Miller et al. Reference Miller, Reis, Calvert, De Peters and Baldwin1991). The efflux equation is a function of cG6P, which assumes that higher concentrations of G6p indicate higher concentrations of free glucose.
Both U G6p,F6p (Eqn 7.3) and the reverse U F6p,G6p (Eqn 7.2) are simple MM functions of cG6p and cF6p, respectively.
U G6p,R5p represents the use of glucose in the pentose phosphate pathway for generation of NADPH2 for fat synthesis. Thus, it is an MM equation (Eqn 7.4) modified by the de novo fat synthesis rate U Ac,Tgm. The V max is 311 mmol/h (V G6p,R5p) when U Ac,Tgm=°U Ac,Tgm and increases linearly with U Ac,Tgm.
The MM Eqn (7.5) for lactose synthesis is based on concentrations of both eGlc and G6p. Insulinaemia (INSH) has been incorporated into this equation as an inhibitor with affinity coefficient 10 and exponent 2·5 to take into account the reduced partition of glucose to lactose when insulin rises (Mackle et al. Reference Mackle, Dwyer, Ingvartsen, Chouinard, Ross and Bauman2000). The parameter K eGlc,G6pLac (4·0 mm) was set slightly higher than ceGlc according to the tests carried out for model development. The term RPS/°RPS has been introduced to take into account the correlation between milk protein synthesis and lactose synthesis (Ebner & Schanbacher Reference Ebner, Schanbacher, Larson and Smith1974). Use of glucose in lactose synthesis (U Glc,Lac) is assumed to be equal to U G6p,Lac. Therefore net uptake of glucose in the tissue is given by the sum of U eGlc,G6p (Eqn 7.1) and of U G6p,Lac (Eqn 7.5).
Fructose-6-phosphate compartment (F6p)
Exchange of F6p with G6p (U G6p,F6p and U F6p,G6p) is described above. Production of F6p in the pentose-phosphate pathway (P F6p,R5p; Eqn 8.1) is a stoichiometric 2/3 of the G6p use (U G6p,R5p). The last term in Eqn (8.0), the use of F6p in fructose-1,6-biphosphate (Fbp) synthesis, is carried out by the highly regulated enzyme phosphofructokinase (PFK). The sparing of glucose for lactose synthesis by acetate (Forsberg et al. Reference Forsberg, Baldwin and Smith1985) and long-chain FA (Cant et al. Reference Cant, DePeters and Baldwin1993b) can be accounted for by the inhibition of PFK by ATP and citrate. ATP is both a substrate for PFK and an inhibitor. Hence, Eqn (8.2) has both K Atp,F6pFbp and J Atp,F6pFbp that are set to 0·675 and 0·756 mm, respectively, to accommodate the peculiarities of kinetics relative to ATP (Kemp & Markus Reference Kemp, Markus and Pilkis1990). Cytosolic citrate is a signal of high mitochondrial energy status and inhibits the flow of glucose into the TCA cycle via PFK (Kemp & Markus Reference Kemp, Markus and Pilkis1990). There is no citrate compartment in the model from which U F6p,Fbp could be inhibited so the entry of acetate into the TCA cycle U Ac,Acm is used as a surrogate. Sensitivity to U Ac,Acm as it increases relative to the reference °U Ac,Acm is set high with the exponent 8·50.
Phospho-glyceraldehyde compartment (Pga)
Phospho-glyceraldehyde is produced by cleavage of Fbp in 2 (P Pga,Fbp; Eqn 9.1) and shunting of G6p through the pentose-phosphate pathway (P Pga,R5p; Eqn 9.2). Uses of Pga to make glycerol (U Pga,Gcl; Eqn 9.3) and pyruvate (U Pga,Pyr; Eqn 9.4) are both simulated with MM functions of cPga.
Pyruvate compartment (Pyr)
The only input to the Pyr compartment is U Pga,Pyr (Eqn 9.4), and outputs are to Ser (U Pyr,Ser; Eqn 2.11), Ala (U Pyr,Ala; Eqn 2.12), oxaloacetate and Acm. The latter two outputs are MM functions of cPyr (Eqns 10.1 and 10.2).
Adenosine nucleotide compartments (Atp and Adp)
ATP is used for maintenance (U Atp,Txm; Eqn 11.2) and productive purposes (U Atp,Mlk; Eqn 11.3) and is produced by catabolic pathways (U Adp,Atp; Eqn 11.4). The molar stoichiometries for use and production of ATP in the mammary glands (Eqns 11.3 and 11.4, respectively) reflect the corresponding biochemical pathways. The term R Atp,Mps (2900 mmol ATP/mmol RPS; Eqn 11.3) takes into consideration a ratio of mammary protein synthesis to milk protein output of 2·60 (Bequette et al. Reference Bequette, Backwell and Crompton1998) and assumes a cost of 5 mol ATP/mol peptide bond synthesized and 1 mol ATP mol/peptide bond cleaved. NADPH2 in the mammary tissue is generated through the pentose-phosphate cycle and isocitrate shuttle (Bauman & Davis Reference Bauman, Davis, Larson and Smith1974). The term 3·0(U Acm,Cit−(1·7867U Ac,Tgm+U Bhb,Tgm−2·0U G6p,R5p)) of Eqn (11.4) refers to the reducing power produced in the TCA cycle via isocitrate according to the model overall balance, where NADPH2 requirement for de novo FA synthesis amounts to 1·7867 and 1 mmol per each mmol of acetate and Bhb used in fat synthesis respectively. It is assumed that FA undergoing oxidation are 16 C long, which gives rise to 33 mmol of ATP/U Fa,Tgm. The term V Adp,Atp/(1+K Adp,Atp/cAdp) in Eqn (11.4) takes into account the dependency of ATP synthesis upon ADP availability. The term (RPS/°RPS)0·50 has been introduced to simulate uncoupling between respiration and ATP synthesis when energy supply exceeds the needs for milk synthesis but AA are in deficient supply. RPS is the milk protein yield calculated from the AA supply (Eqn 2.21) while °RPS is the reference milk protein yield. One possible mechanism that could be associated to uncoupling in ATP production and the respiratory chain in the cells is the intervention of uncoupling proteins in mitochondria (Ricquier & Bouillaud Reference Ricquier and Bouillaud2000; Ledesma et al. Reference Ledesma, De Lacoba and Rial2002).
When the stoichiometries of ATP production and utilization were applied to reference fluxes, an excess of 2866·04 mmol/h was found and assigned to the maintenance expenditure. This maintenance cost was set to be a linear function of UW, which is 0·0367of LW (Gibb et al. Reference Gibb, Ivings, Dhanoa and Sutton1992) according to a saturating function of cAtp (Eqn 11.2).
Model outputs
Assuming a constant lactose content, hourly milk yield (P Mlk; Eqn 12.0) is calculated as 0·00701 kg/mmol of G6p used to produce lactose, based on the reference milk yield (MS°) of 0·034797 kg/h/kg UW and U G6p,Lac of 120·91 mmol/h (Fig. 1).
As for milk fat synthesis, it was assumed that 1·00 of C18 and 0·50 of C16 output in milk is accounted for by U Fa,Tgm and the remaining FA in milk are produced from U Ac,Tgm and U Bhb,Tgm. Following Dado et al. (Reference Dado, Mertens and Shook1993) 0·50 of the first 4 C inserted into the FA were assumed to originate from acetate and 0·50 from Bhb. The coefficients 38·89, 43·91 and 289·6 to convert U Ac,Tgm, U Bhb,Tgm and U Fa,Tgm, respectively, to an hourly milk fat yield (P Tgm; Eqn 12.1) were calculated from the reference TAG yield (Fig. 1) taking into account FA profile and molecular weights of FA and glycerol. Coefficients to predict molar yields of milk FA fractions less than, equal to, or greater than 16 C in length were calculated similarly.
The yield of true protein in milk (P Ptm; Eqn 12.6) is calculated by multiplying RPS (Eqn 2.21) by the molecular weight of milk protein synthesized in the mammary glands (MWPtm=22·084 g/mmol) and accounting for the proportion, 0·04, of milk protein not synthesized in the mammary glands (Walstra & Jenness Reference Walstra and Jenness1984).
Model solutions and model robustness and stability
The model was compiled with the software WinSAAM (Wastney et al. Reference Wastney, Patterson, Linares, Greif and Boston1999); which can be freely downloaded at http://www.winsaam.com; Stefanovski et al. Reference Stefanovski, Moate and Boston2003) and differential equations of the model were integrated numerically using a Runge–Kutta fourth-order algorithm. The integration interval was 1·20 min and the model was run for 12 h of simulation time in order to reach steady state solutions. Model stability was confirmed by a return to baseline following a reduction in each compartment size.
MODEL EVALUATION
Model behaviour analysis
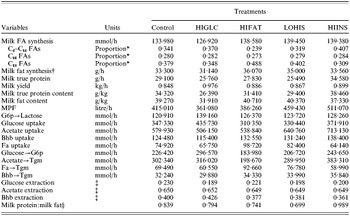
The model is an expression of hypotheses that were developed from observations of mammary responses to changes in circulating concentrations of energy metabolites, AA and insulin. To test whether those hypotheses reproduced the observed effects, responses of the model to the above perturbations were evaluated. The four input scenarios tested were: HIGLC, increased glucose concentration following 10 h of arterial glucose infusion (Cant et al. Reference Cant, Trout, Qiao and Purdie2002); HIFAT, higher arterial concentrations of NEFA; Bhb and TAG due to fat feeding (Cant et al. Reference Cant, De Peters and Baldwin1993a, Reference Cant, DePeters and Baldwinb); LOHIS, reduced His arterial concentration from 53 to 26·5 μM by abomasal subtraction (Bequette et al. Reference Bequette, Hanigan, Calder, Reynolds, Lobley and MacRae2000); and HIINS, the hyperinsulinaemic-euglycaemic clamp of Mackle et al. (Reference Mackle, Dwyer, Ingvartsen, Chouinard, Lynch, Barbano and Bauman1999, Reference Mackle, Dwyer, Ingvartsen, Chouinard, Ross and Bauman2000). Values of input variables for simulations of treatments and control are presented in Table 6, and simulation results are shown in Tables 7 and 8. Inputs were not taken directly from the experiments that inspired the four scenarios because of differences from the reference state used to parameterize the model and because it was planned to examine behavioural responses to small sets of input changes rather than the whole milieu. As a consequence the model outputs presented in Tables 7 and 8 cannot be directly compared to observations in a statistical test of predictive accuracy.
Simulation of milk yield, MPF and energy nutrient metabolism in response to glucose infusion (HIGLC), fat feeding (HIFAT), His subtraction (LOHIS) and euglycaemic insulin infusion (HIINS)

* Molar basis.
† Milk triacylglycerol.
‡ Computed as: ((Uptake of A)/MPF)/ceA.
§ (Milk true protein×0·96)/Milk triacylglycerol.
Simulation of AA metabolism in response to glucose infusion (HIGLC), fat feeding (HIFAT), His subtraction (LOHIS) and euglycaemic insulin infusion (HIINS)

* Computed as: ((Uptake of Aai)/MPF)/ceAai.
When the concentration of glucose in arterial plasma was elevated (scenario HIGLC) from 3·64 to 6·37 mm as in Cant et al. (Reference Cant, Trout, Qiao and Purdie2002), the elevated intracellular cAtp/cAdp caused a reduction in predicted MPF from 415 to 361 litres/h (Table 7) which is not far from the decrease of 16% observed (Cant et al. Reference Cant, Trout, Qiao and Purdie2002). According to the hypotheses expressed in the model, if the AA supply is reduced, the mammary tissue reacts by increasing AA extraction so as to maintain a given milk protein yield. Results shown in Table 7 confirm that despite a reduction in MPF of 13%, milk protein yield was less affected (−11·5%). This result is due to an increase in extraction rate of the AA driving milk protein synthesis (His, Met and Phe) along with Lys and the branched-chain AA (Table 8). The higher extraction rate simulated by the model did not completely compensate for the lower AA supply caused by the reduction in plasma flow and, consequently, overall milk protein yield decreased. These latter results are not consistent with the observations of Cant et al. (Reference Cant, Trout, Qiao and Purdie2002) where, despite a severe reduction in blood flow, milk protein yield remained unchanged. The simulated 15% increase in milk yield from 0·848 to 0·976 kg/h, however, is equal to the 15% increase observed (Cant et al. Reference Cant, Trout, Qiao and Purdie2002). The simulated increase in milk yield explains the reduction in milk fat and protein content (Table 7).
The profile of FA in milk followed patterns expected from experimentation. There was a higher proportion of short and medium chain FA with the higher availability of glucose. The partition of acetate towards milk fat synthesis, as a proportion of total acetate uptake, increased from 0·521 to 0·624 (Table 7), which is consistent with the ability of glucose to stimulate de novo lipogenesis from acetate (Forsberg et al. Reference Forsberg, Baldwin and Smith1984). The FA profile was also influenced by model predictions of a lower uptake of FA.
In scenario HIFAT the model simulated a drop in MPF rate from 415 to 386 litres/h (Table 7) when concentrations of NEFA, Bhb and TAG in arterial plasma were elevated as in the fat-feeding experiment of Cant et al. (Reference Cant, De Peters and Baldwin1993a, Reference Cant, DePeters and Baldwinb). Moreover, the reduction of 7% was equal to that previously observed (Cant et al. Reference Cant, De Peters and Baldwin1993a). The model simulated a reduction in milk protein yield from 29·1 to 27·8 g/h (Table 7) while efficiency of AA extraction by the gland increased (Table 8) as observed (Cant et al. Reference Cant, De Peters and Baldwin1993a).
The predicted flux of acetate into FA synthesis, as a proportion of total acetate uptake, decreased from 0·521 to 0·369, which was a consequence of simulating the inhibitory effect of long chain FA on de novo FA synthesis (Eqn 3.3). The fraction of short and medium chain FA (C4–C14) was lowered to 0·239 while the fraction of long chain FA (C⩾18) was increased to 0·488 (Table 7). The higher oxidation of acetate predicted by the model led to a greater synthesis of lactose, which involves the sparing effect on glucose oxidation described by Eqn (8.2) and resulted in milk yield increasing from 0·848 to 0·886 kg/h. The simulated increase in milk fat yield (+8·3%) was greater than the increase in milk yield (+4·5%), while milk protein yield decreased (Table 7). Consequently, milk protein content decreased from 34·3 to 31·4 g/kg and milk fat content increased from 39·3 to 40·7 g/kg. All these coordinated changes simulated by the model are in accordance with the experimental results reported by Cant et al. (Reference Cant, De Peters and Baldwin1993a, Reference Cant, DePeters and Baldwinb) where feeding fat to lactating cows increased milk fat concentration and decreased protein concentration.
Behavioural scenario LOHIS was concerned with a 50% reduction in arterial concentration of His with respect to the reference value (from 53·0 to 26·5 μm). The aim of this simulation was to challenge the model with a scenario similar to that described by Bequette et al. (Reference Bequette, Hanigan, Calder, Reynolds, Lobley and MacRae2000), where, in experiments with lactating goats, the arterial His concentration was lowered from 73 to 8 μm. Bequette et al. (Reference Bequette, Hanigan, Calder, Reynolds, Lobley and MacRae2000) reported increases in MPF and extraction of His from arterial plasma, and decreases in milk protein yield and exchange of AA other than His. The present model simulated the same four behaviours (Tables 7 and 8). Because oRPS decreased (−5·6, −5·6, −11 and −21% for Met, Phe, Leu and other essential AA, respectively) and cAa increased 8·6%, both the (oRPS/ePS)ε term and the inhibition constant J Aa of Eqn (2.2) were responsible for simulating the decrease in exchange of AA other than His. With a constant arterial concentration of AA other than His, the ratio °cAAE/cAAE of Eqn (2.2) did not differ from 1 so had no effect on the V max of net AA uptake.
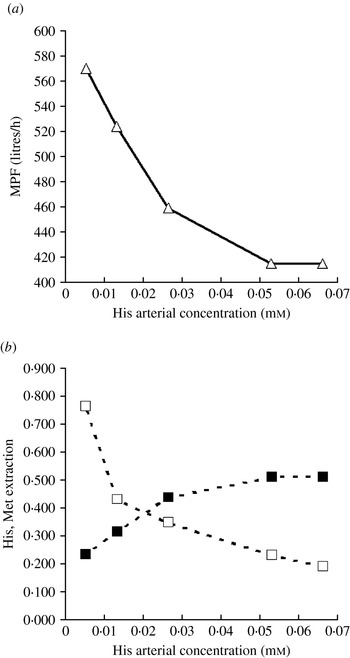
Response of the model to His deficiency was further explored by setting arterial His concentration to 0·10, 0·25, 0·50, 1·00 and 1·25 times its reference value (Fig. 2). Below the reference concentration of His, MPF increased and milk protein yield decreased. A lower milk protein yield increased cAa and consequently Met extraction was reduced (Fig. 2b). Above the reference arterial concentration of His, milk protein yield, MPF and Met extraction did not change.
Model simulations to variations in arterial concentration of His: (a) effect on MPF (—▵—) and (b) effect on His extraction (– –□– –) and on Met extraction (– –▪– –). Extraction is computed as: ((Uptake of Aai)/MPF)/ceAai.

Simulation of milk fat yield in scenario LOHIS is also of interest. Higher MPF rate in the solution increased the supply and uptake of acetate, Bhb and FA, i.e. the main precursors for milk fat synthesis. As a consequence, an increased rate of milk fat output and fat percentage in milk compared to the control were predicted (Table 7). These predictions are consistent with the increased yield and content of fat in milk when His was removed from a complete AA mix infused into the arterial supply of the mammary glands of lactating cows (Cant et al. Reference Cant, Trout, Qiao and McBride2001).
The fourth behaviour that the model equations were specifically aimed at reproducing was the mammary response to an euglycaemic insulin infusion (Mackle et al. Reference Mackle, Dwyer, Ingvartsen, Chouinard, Lynch, Barbano and Bauman1999, Reference Mackle, Dwyer, Ingvartsen, Chouinard, Ross and Bauman2000). When INSH was increased from 1·00 to 4·00 and arterial concentrations of His, Phe, Lys, branched-chain AA and some non-essential AA were decreased (Table 6) as in Griinari et al. (Reference Griinari, McGuire, Dwyer, Bauman, Barbano and House1997b) and Mackle et al. (Reference Mackle, Dwyer, Ingvartsen, Chouinard, Ross and Bauman2000), the model simulated an increase of 19% (from 29·10 to 34·58 g/h) in the yield of milk protein (Table 7). Such an increase was due to an increase of MPF from 415 to 511 l/h (+23%) as well as to an increased extraction of the essential AA. When insulinaemia was elevated 4-fold in lactating cows with euglycaemia, Mackle et al. (Reference Mackle, Dwyer, Ingvartsen, Chouinard, Ross and Bauman2000) observed an increase of 42% in MPF and an increase in the extraction proportion of the essential AA. Bequette et al. (Reference Bequette, Kyle, Crompton, Buchan and Hanigan2001) also observed an increase in MPF rate of 42% by applying this treatment in lactating goats.
The model predicted an increase in glucose uptake of 7·1% which led to a 6% increase in lactose synthesis and milk yield. The increase in predicted milk protein yield was larger than the increase in milk yield and consequently milk protein content rose from 34·3 to 38·5 g/kg of milk. Despite the specific mechanism incorporated into lactose synthesis (Eqn 7.5), the partition of glucose uptake towards lactose synthesis was not remarkably lower than in the control treatment (0·690 v. 0·696). This similarity is not in accordance with the observed reduction of 24% in the partition of glucose towards lactose synthesis (Mackle et al. Reference Mackle, Dwyer, Ingvartsen, Chouinard, Ross and Bauman2000). The results may indicate that INSH should be considered an activator of mammary glucose catabolism, rather than an inhibitor of lactose synthesis.
FA uptake decreased due to lower NEFA concentration in arterial plasma. The model simulated an increased uptake of acetate, glucose and Bhb, and a higher partition of acetate and butyrate towards de novo FA synthesis (+27 and +11% respectively, Table 7). The model predicted a shift in the proportion of FA of different chain length: the fraction of C4–C14 increased while the fraction of C18 decreased (Table 7). This variation is in accordance with experimental findings of a higher yield of C4–C16 FA and a lower C18 yield in lactating cows when insulin concentration was elevated more than 4-fold (Griinari et al. Reference Griinari, McGuire, Dwyer, Bauman and Palmquist1997a).
Sensitivity analysis
Tests of model sensitivity to changes in the values of selected parameters were conducted to identify parameters that highly influence model outputs and therefore require accurate estimation. Parameters selected were those describing novel aspects of AA utilization and the main energetic interaction between acetate and glucose. The sensitivity tests involved multiplying the parameters, one at a time, by 0·70, 0·85, 1·00, 1·15 and 1·30 times their assigned value (Tables 4 and 5) and recording the effect on model predictions of MPF, mammary metabolism, AA uptake and milk protein yield.
Tests were conducted on a lactating cow of 680 kg LW, 90 DIM, 0·950 kg/h of milk yield and 1·39 mmol/h of milk protein yield. Arterial concentration of the input variables were those reported under control treatment in Table 6.
AA uptake parameters
Cant et al. (Reference Cant, Berthiaume, Lapierre, Luimes, McBride and Pacheco2003) reported that His and Met have been shown to be first-limiting AA to milk protein yield. The affinity constants K InHis and K InMet modulate net uptake of His and of Met. Given that in this model His and Met are considered determinants of milk protein yield, different estimates of K InHis and K InMet can deeply affect the overall model response. The model structure in fact states that milk protein yield influences many variables including total intracellular AA concentration, energy balance, MPF, lactose synthesis and milk yield. Moreover, variations in transport efficiency are counterbalanced by variations in MPF. Thus sensitivity analysis on parameters K InHis and K InMet can offer further insights into how the model controls AA supply.
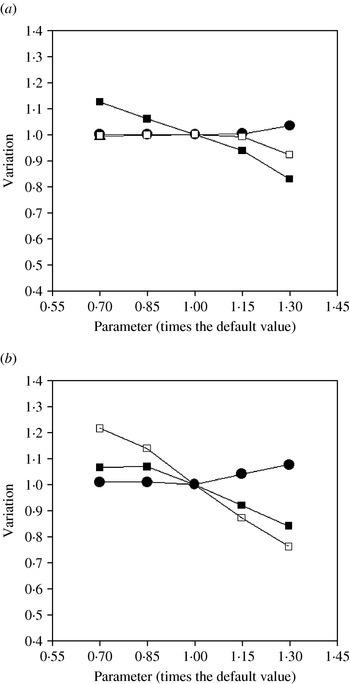
Results of model sensitivity analyses for the parameter K InHis and outputs MPF, His and Met extraction are shown in Fig. 3a. Changes in MPF, Met extraction, Phe extraction and milk protein yield are not remarkable when K InHis is set to 0·7 times its assigned value and only His extraction changes (+12·7%). Increasing K InHis to 1·3 times its default value changes MPF and milk protein yield (+3·6 and −8·5%, respectively). Again His extraction is the most sensitive and is reduced (−17%). A lower extraction of His is accompanied by a reduced extraction of Met and Phe (−7·9%) as a consequence of an increased intracellular concentration of total AA.
Model sensitivity analysis to variations of K InHis and of K InMet: (a) sensitivity to variations of K InHis and (b) sensitivity to variations of K InMet. Effect on MPF (—•—); effect on His extraction rate (—▪—); effect on Met extraction rate (—□—).

Sensitivity of selected outputs to variations of K InMet is shown in Fig. 3b. When K InMet is set to 1·3 its default value MPF, milk protein yield and Met extraction are changed by +7·5, −17·9 and −24%, respectively. Total intracellular AA concentration increases to 13 400 μm (+9·8%), indicating a lower milk protein yield. Consequently the down-regulation mechanism provided by the model (Eqn 2.2) simulates a reduction of His and Phe extraction (−16·2 and −16%, respectively). Decreasing K InMet to 0·7 times its default value affects Met extraction remarkably (+21%), leading to cascade effects on milk protein yield (+13%) and on milk yield (+5·9%). Reduction in total intracellular AA concentration due to increased milk protein yield up-regulates the extraction of His and Phe by 6·6 and 6·4%, respectively.
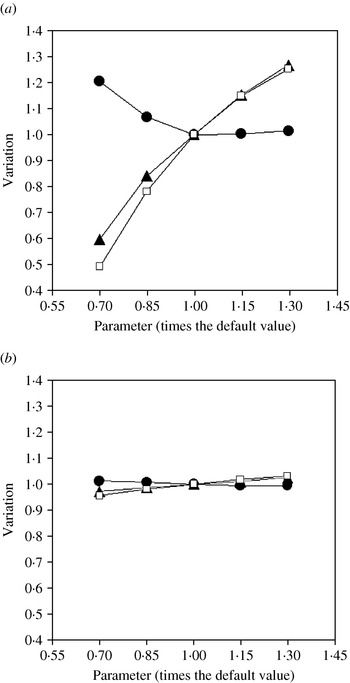
The parameter J Aa is of key importance in the model structure as it is concerned with one of the model assumptions based on the work of Bequette et al. (Reference Bequette, Hanigan, Calder, Reynolds, Lobley and MacRae2000), suggesting that the AA transport by mammary tissue can be up-regulated or down-regulated depending upon AA concentration in arterial plasma and milk protein yield. The model in fact assumes that when the use of AA for milk protein synthesis is lowered then total intracellular AA concentration increases and AA transport is down-regulated accordingly. The inhibition constant J Aa defines the magnitude of this down-regulation of AA transport when total intracellular AA concentration increases. Figure 4a shows results of sensitivity of MPF, milk protein yield and His extraction to variations of J Aa. The extractions of His, Met and Phe are reduced by 51% when J Aa=0·7 default value. Reduced extractions are counterbalanced by a 20·5% increase in MPF which is not, however, sufficient to prevent a remarkable reduction in milk protein yield (−40%).
Model sensitivity analysis to variations of J Aa and of K OutAa: (a) sensitivity to variations of J Aa and (b) sensitivity to variations of K OutAa. Effect on MPF (—•—), effect on milk protein yield (—▴—); effect on His extraction rate (—□—).

Increasing the parameter J Aa attenuates the effect of the intracellular AA down-regulation mechanism captured in the model; as a consequence the extraction of His, Met and Phe improves (c. +25%) and this is accompanied by a greater milk protein yield and by a slight increase in MPF (+27 and +1·5%, respectively when J Aa=1·3 times its default value). The MPF increase is due to a higher ATP expense for milk protein yield, which leads to a narrower ATP/ADP ratio (−1·4%). Variation in J Aa influences many important model outputs. MPF, milk protein yield, His, Met and Phe uptake and extraction and milk yield are all sensitive to the value of the inhibition constant J Aa in Eqns (2.2) and (2.9).
The model computes net uptake of AA from transport in both directions across the plasma membrane. The affinity constant K OutAa modulates unidirectional efflux of individual AA to venous plasma and thereby affects both arterio-venous difference and extraction of AA. Some of the results of the sensitivity analysis test on K OutAa are shown in Fig. 4b. Increasing K OutAa leads to higher extraction of His, Met and Phe, while lower values of the parameter reduce extraction. Blood flow across the gland counteracts the reduction of extraction of these three AA when lower values of K OutAa are imposed. Model outputs are not particularly sensitive to variation in K OutAa: at 0·7 of its default value, changes in MPF, milk protein yield and milk yield rate are +1·2, −2·7 and −0·4%, respectively. Setting K OutAa to 1·3 of its default value results in a slight change in MPF (−0·4%), milk protein yield (+2·7%) and extraction of His, Met and Phe (c. +3%).
Acetate glucose interaction
In the model, glucose catabolism is regulated at the synthesis of Fbp from F6p (Eqn 8.2) by considering both inhibitory (J Atp,F6pFbp) and stimulatory (K Atp,F6pFbp) effects of ATP on PFK activity (Kemp & Markus Reference Kemp, Markus and Pilkis1990). Acetate catabolism (U Ac,Acm; Eqn 3.2), which is regulated by the inhibitory effect of Fa on de novo FA synthesis (J Fa,AcTgm; Eqn 3.3), also affects Fbp synthesis from F6p (Eqn 8.2). To study sensitivity to parameters of the acetate/glucose interaction, the sensitivity analysis of J Atp,F6pFbp, of K Atp,F6pFbp and of J Fa,AcTgm are discussed jointly.
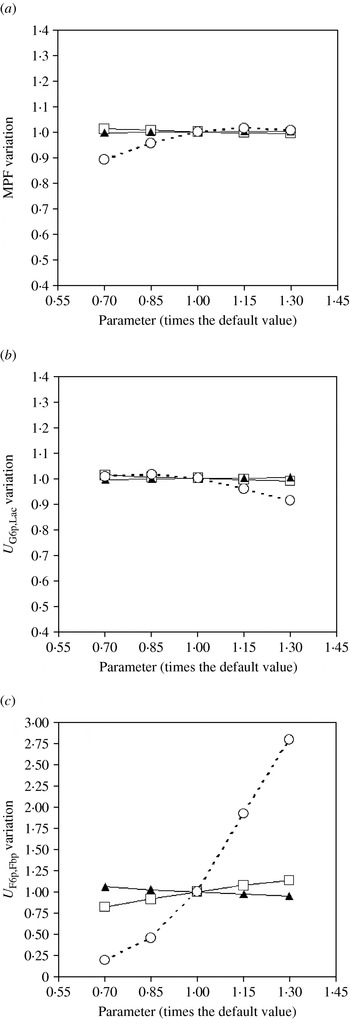
The model response is not sensitive to J Atp,F6pFbp and K Atp,F6pFbp. Figures 5a and 5 b show responses of MPF and of use of G6p for lactose synthesis to variation of J Atp,F6pFbp; when J Atp,F6pFbp is set to 0·7 of its default both outputs increase slightly (+1·0% MPF and +1·1% U G6p,Lac), while higher values of the inhibition constant lead to opposite responses (−0·7% MPF and −0·9% U G6p,Lac when J Atp,F6pFbp=1·3 of its default). The lowest value (0·7 times its default) and the highest value (1·3 times its default) of the parameter K Atp,F6pFbp increases (+5·6%) and decreases (−4·9%), respectively, the amount of Fbp produced (Fig. 5c). Variation of K Atp,F6pFbp from 0·7 to 1·3 times its default only changes MPF and U G6p,Lac by +0·6 and +0·7%, respectively (Figs 5a and 5 b).
Model sensitivity analysis to variations of K AtpF6pFbp (—▴—), to variations of J Atp,F6pFbp (—□—) and to variations of J Fa,AcTgm. (– –○– –): (a) effect on MPF, (b) effect on G6p→Lac and (c) effect on F6p→Fbp.

In contrast, the model is remarkably sensitive to J Fa,AcTgm. Milk fat synthesis is reduced (−22·4%) when J Fa,AcTgm is set to 0·7 times its default value, as a consequence of a 48% reduction in the rate of acetate used for FA synthesis. Conversely, an increase of J Fa,AcTgm to 1·3 times its default value leads to a 11% higher milk fat synthesis, due to a 32·6% increase in the use of acetate for milk fat synthesis. When J Fa,AcTgm is set to 0·7 times its default value, acetate oxidation increases by 19%, which slows down the production of Fbp from 24·9 to 4·81 mmol/h (Fig. 5c). The ATP/ADP ratio increases by 9·8% and is responsible for a 10·9% reduction in MPF (Fig. 5a). Despite a lower MPF rate and a reduced milk protein yield (−6·9%) the sparing effect on G6p causes a slight increase in milk lactose synthesis from 135 to 136 mmol/h. At the highest value of J Fa,AcTgm, the model simulates a 25·4% lower rate of oxidation of acetate. This results in a three-fold increase in Fbp production (Fig. 5c), providing more fuel for the TCA cycle and counterbalancing the reduction in acetate oxidation, while MPF increases only 0·6% (Fig. 5a). The higher production of Fbp negatively affects synthesis of lactose from G6p (−8·6%, Fig. 5b) while glucose extraction and uptake increase (+8·1 and +8·7%, respectively).
Energy cost of protein yield
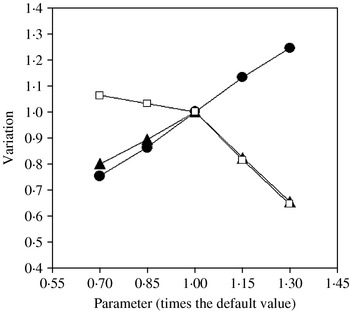
The parameter R Atp,Mps represents the ATP requirement for milk protein yield (Eqn 11.3). The test of sensitivity to this parameter is of particular importance, as the energy demand for milk protein production can affect both the MPF response and the milk protein yield response. Results of model sensitivity analyses for the parameter R Atp,Mps and three selected outputs are shown in Fig. 6. When R Atp,Mps is set to 0·7 times its default value, MPF is reduced by 24·8% because of a 31·5% higher ATP/ADP ratio. The reduction of milk protein yield (−20%) was less than the reduction in MPF because of a 6·1% higher extraction of His, Met and Phe. MPF is positively affected (+24%) by increasing R Atp,Mps to 1·3 times its default value. This latter response is due to the combined effect of a 34·6% lower milk protein yield and the higher ATP requirement. The lower milk protein yield causes the ATP/ADP ratio to increase sharply (+44·5%) but also forces an increase in MPF to attain the potential milk protein yield (Eqn 1.1). The increase in MPF counterbalances the reduction of c. 35% in the extraction of His, Met and Phe.
Model sensitivity analysis to variations of R Atp,Mps. Effect on MPF (—•—); effect on milk protein yield rate (—▴—); effect on Met extraction rate (—□—).

DISCUSSION
The results of the behavioural analysis confirm that the model is able to mimic the MPF patterns observed in response to elevated concentrations of energy metabolites in circulation, low concentrations of His, and euglycaemic insulin infusion. The results from the model evaluation offer further insights into control of mammary function or suggest enhancements in the model structure and experimental data required to introduce and achieve such improvements.
Milk protein yield
In the present model, milk protein yield is regarded as the driving force on mammary supply of nutrients (Eqn 1.1). Potential milk protein yield is one of the inputs of the model. Milk protein production is the result of tissue activity, which in turn is related to the synthetic and degradative capacity of the tissue machinery. For simplicity, milk protein yield is fixed as an input. In the future, a mechanistic representation of the cell machinery involved in regulating polymerization of AA and protein degradation processes may be added.
MPF variations
In the model, MPF is regulated by the effects of the ATP/ADP ratio and of the milk protein yield on the AP proportion of the mammary glands. Previously, intracellular energy charge has formed the basis for simulating changes in MPF (Cant & McBride Reference Cant and McBride1995; Cherepanov et al. Reference Cherepanov, Danfær and Cant2000), according to hypotheses developed for exercising muscle of local vasodilator release in response to metabolic rate (Laughlin & Korzick Reference Laughlin and Korzick2001). The vasodilators relax smooth muscles around precapillary segments of the vasculature to allow a faster velocity of flow or a larger proportion of the capillary space to be replenished with blood. The evidence that similar vasodilatory mechanisms operate in the mammary glands has been reviewed by Prosser et al. (Reference Prosser, Davis, Farr and Lacasse1996).
In contrast to the energy charge effect, the hypothesis that the offset from a milk protein yield setpoint can influence MPF is new and, to the authors' knowledge, has no immediate precedent in other tissues. The need to invoke a setpoint mechanism in the control of MPF arose because of a conflict between the objectives of maintaining energy charge of the cell and of partitioning AA towards the mammary gland through the blood stream. When the arterial concentration of an essential AA is very low, the achievable protein yield is below the tissue potential and uses less ATP so that the energetic control of AP volume would be expected to reduce MPF. The intervention of some uncoupling mechanism between oxidative processes and ATP generation in the mitochondria would allow MPF to increase so that AA supply could match requirements for milk protein production. AA effects on expression of mitochondrial uncoupling proteins in muscle and liver have been noted previously (Petzke et al. Reference Petzke, Friedrich, Metges and Klaus2005; Hurtaud et al. Reference Hurtaud, Gelly, Chen, Levi-Meyrueis and Bouillaud2007), but the mammary glands have not been studied in this regard. The current simulation results, in which ATP consumption for milk protein yield was lowered when low arterial concentrations of His limited protein yield and yet MPF increased, suggest that mitochondrial uncoupling deserves experimental investigation.
Cant et al. (Reference Cant, Berthiaume, Lapierre, Luimes, McBride and Pacheco2003) did not have to invoke an uncoupling mechanism to resolve the elevated MPF with a reduced ATP expenditure in milk protein production during His deficiency. Rather, they suggested that reduced concentrations of acetate and Bhb in plasma, which were observed by Weekes et al. (Reference Weekes, Luimes and Cant2006), could cause the MPF increase by an energy-related vasodilatory mechanism alone. A His-deficiency experiment in which all of the milk precursors and MPF have been measured and could serve as a test of the two competing hypotheses of MPF control, has not, to the authors' knowledge, been published.
AA supply
When challenged with low arterial plasma concentration of essential AA such as His, the model was able to simulate increased MPF and AA extraction rates. However, sensitivity analysis revealed that the model response is sensitive to numerical values of the parameters J Aa, K InHis and K InMet. Milk protein yield was underestimated in simulations HIGLC and LOHIS. Despite appropriate MPF pattern predictions, the magnitude of uptake of essential AA simulated by the model could not sustain the given milk protein yield rate. Underestimation of milk protein yield could have been due to inadequate consideration of the contribution of small peptides or intracellular proteins to AA supply (Bequette et al. Reference Bequette, Backwell and Crompton1998). On the other hand, the extent of MPF variation recorded with the simulations LOHIS and HIINS were not of the same magnitude as those observed experimentally. Further mechanisms governing AA extraction and MPF during AA deficiency should be considered. AA transport in mammary cells depends upon a complex system of carriers (Baumrucker Reference Baumrucker1985) that interact through competition, redundancy and counter-transport (Christensen Reference Christensen1990).
The extent to which MPF and AA extraction react to local signals in the mammary gland, and the extent to which these events and the gland metabolism are the result of coordinated central signalling systems, should also be established experimentally. Weekes et al. (Reference Weekes, Luimes and Cant2006), for instance, reported that different patterns of AA imbalance in lactating cows resulted in the stimulation of IGF-I and of insulin secretion; it was suggested that the endocrine responses could allow the mammary tissue to overcome the non-ideal profile of circulating AA and consequently to maintain higher milk protein yield than that expected on the basis of the AA deficiency provoked.
Acetate and glucose metabolism
The MM curves presented by Forsberg et al. (Reference Forsberg, Baldwin and Smith1985) of mammary glucose metabolism in vitro as a function of acetate concentration have represented a reference scenario for construction and analysis of the behaviour of other metabolic models of the mammary gland (Hanigan & Baldwin Reference Hanigan and Baldwin1994; Cherepanov et al. Reference Cherepanov, Danfær and Cant2000). In the current model, U F6p,Fbp (Eqn 8.2) was set up as the primary point where acetate oxidation U Ac,Acm would directly spare glucose for lactose synthesis. When challenged with increasing arterial concentrations of NEFA, TAG and Bhb, the model predicted an increase of 4·5% in lactose synthesis, which is consistent with the experimental findings of Cant et al. (Reference Cant, DePeters and Baldwin1993b) that it was meant to reproduce. However, a more robust response to acetate will probably require a different approach for describing U F6p,Fbp kinetics. Simulating ATP inhibition of U F6p,Fbp, Hanigan & Baldwin (Reference Hanigan and Baldwin1994) found that acetate was able to spare glucose for lactose synthesis but that the effect was not as large as observed by Forsberg et al. (Reference Forsberg, Baldwin and Smith1985). In the current model, U G6p,Lac was not sensitive to variations in the inhibition constant J Atp,F6pFbp in Eqn (8.2) for U F6p,Fbp.
When challenged with a euglycaemic insulin infusion scenario (i.e. INSH=4·00), the present model was not able to reproduce the reduced partition of glucose towards lactose synthesis observed experimentally by Mackle et al. (Reference Mackle, Dwyer, Ingvartsen, Chouinard, Ross and Bauman2000). The necessity of investigating a different mechanism for this metabolic event is apparent. Insulin could promote glucose catabolism or, alternatively, the higher milk protein synthesis rate could lead to a faster catabolism of glucose. Glucose metabolism in the mammary gland is of specific interest because it influences lactose synthesis. Estimates of flux control coefficients (Wright et al. Reference Wright, Cant and McBride2008) could further elucidate the control of glucose metabolism in the mammary gland.
CONCLUSIONS
A model of mammary metabolism in which MPF was regulated by energy charge and the offset from a potential milk protein yield was able to mimic observed responses to elevated concentrations of energy metabolites, low plasma His, and euglycaemic insulin infusion. However, the model did not always reproduce accurately the changes in milk protein yield observed, or the MPF rate. Sensitivity and behaviour analyses highlighted areas where further data should be collected for a more comprehensive description of the mechanisms governing the milk synthesizing system. Investigations aimed at elucidating the mechanisms of an MPF response to His and other essential AA deficiency, the local and systemic signals coordinating nutrient supply to the gland and the interaction between consumption of energetic nutrients and milk synthesis seem to have the highest relevance.
APPENDIX
MATHEMATICAL STATEMENT OF THE MODEL
Mammary plasma flow

– Inputs:

– Outputs:


AA compartment (Aa)

– Inputs:

Uptake of essential AAs







Uptake of non-essential AAs

Synthesis of non-essential AAs








– Outputs:






Acetate compartment (Ac)

– Inputs:

– Outputs:


Mitochondrial acetyl-CoA compartment (Acm)

– Outputs:

β-hydroxybutyrate compartment (Bhb)

– Inputs:

– Outputs:


FA compartment (Fa)

– Inputs:

– Outputs:


Glucose-6-phosphate compartment (G6p)

– Inputs:


– Outputs:



Fructose-6-phosphate compartment (F6p)

– Inputs:

– Outputs:

Phospho-glyceraldehyde compartment (Pga)

– Inputs:


– Outputs:


Pyruvate compartment (Pyr)

– Outputs:


Adenosine di- and tri-phosphate compartments (Adp and Atp)


– Inputs:


– Outputs:

Model outputs
– Milk yield (kg/h)

– Milk fat yield (g/h)

– Milk FAs (mmol/h)

– Milk C4–C14 FAs (mmol/h)

– Milk C16 FAs (mmol/h)

– Milk C⩾18 FAs (mmol/h)

– Milk true protein yield (g/h)