In recent years, the traditional negative view of the development of late medieval trade has come under attack.Footnote 1 Revisionist historians point to a Malthusian growth in demand, less warfare and technological and institutional change. According to them, these factors caused a revival of commerce already before the mining boom of the period after 1460, when Europe entered its first capitalist age of expansion.Footnote 2 A problem with this view is that the paucity of data on late medieval trade flows makes testing it difficult. Scholars of premodern trade therefore increasingly turn to a different approach, that is, to the analysis of grain prices data.Footnote 3 Their method is based on the insight that extending commercial networks lead to converging prices that develop stable relationships, thereby indicating increasing market integration. Price structures thus allow conclusions on the development of trade.Footnote 4
In the present article, we approach the subject from a new direction: we examine financial instead of grain markets. Our geographical focus is on the Rhineland and other parts of the Holy Roman Empire, whose heterogeneous institutional landscape permits investigating how political institutions shaped trade. Examining financial markets is particularly useful as financial integration and long-distance trade were intimately linked.Footnote 5 Scholars often assume that before the late seventeenth century, there are insufficient data for the quantitative analysis of these markets.Footnote 6 However, there are abundant primary sources on financial transactions and monetary conditions from the late fourteenth to the early sixteenth centuries. On their basis, we compiled a new data set that allows calculating local gold-silver ratios. Such ratios indicate how many units of silver had to be paid for one unit of gold; spreads between them are evidence of deficiencies in market integration.Footnote 7 Using this method, we investigate if and how the integration of money markets progressed. We also explain the process, analyzing patterns of integration in the context of developments in the fields of trade, bullion, geopolitics, transport and information technology, and monetary and political institutions.
We begin by presenting our data. Our analysis of overall trends finds that financial markets integrated from the beginning of the fifteenth century in cycles that seem to have been caused by periodical rounds of debasements aimed at “cleaning” the money market. Specific trends show that integration was widespread but uneven, with the main progress being between weakly integrated distant localities in the Rhineland. Threshold autoregressive analysis detects a decline in costs in this area from the second half of the fifteenth century. Panel data analysis finds that costs declined because of increasing peace and river navigability, the growth of monetary unions, the advent of printing, and the rise of the territorial state. Surprisingly, this rise led to improved integration between, rather than within states—a result that we trace to a synergy between territorial and imperial rule. The concluding section summarizes the results and discusses their implications for future research.
THE VALUE OF THE RHINEGULDEN
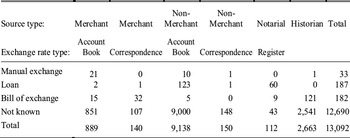
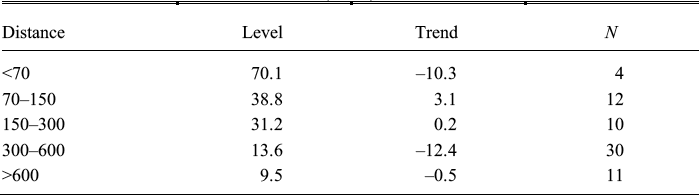
To analyze late medieval financial markets, we compare gold-silver ratios across cities and years. Such ratios refer to how many units of silver were paid for one unit of gold when silver coins were exchanged with the gold coin most popular in fifteenth-century Central Europe, the Rhinegulden. An example serves best to demonstrate how we arrived at the ratios. In Basel in 1472, a transaction is recorded where 17,938 Rhineguldens were exchanged for £20,628 14s. of the local silver currency, the Pound Rappenmünze. At that time, the Rhinegulden contained 2.697 grams fine gold, while the pound, being the equivalent of 60 “vierers” with 0.418 grams fine silver each, equaled 25.106 grams fine silver.Footnote 8 The transaction thus implied the exchange of 517,367.80 grams silver for 48,378.79 grams gold, or, in other words, a gold-silver ratio of 1:10.69. In principle, we calculate all local ratios in this way, using, however, yearly local averages instead of individual observations in our analysis. Table 1 shows the sources and types of exchange rates we used.
We found the majority of the data (c. 70 percent) in urban, princely, and ecclesiastic account books.Footnote 9 Merchant account books yielded about 7 percent, and notarial registers as well as commercial and noncommercial correspondence each another c. 1 percent. We also use rates mentioned by historians; they amount to c. 20 percent of the total.Footnote 10 Exchange rates can also be found in political ordinances and official valuations. However, as sources from our area and period indicate that rulers were rarely able to enforce the circulation of their gold at its nominal par value, we exclude such rates, using market rates only. This, admittedly, addresses only the most obvious form of intervention in the money market. The bare existence of political rates, as well as restrictions on the export of bullion and the number of money changers, must have influenced market rates.Footnote 11 Conversely, market rates must have played a role in the rulers' choices of official rates. How both types of rates interacted is an important issue that we must leave aside.
OBSERVATIONS BY EXCHANGE RATE AND SOURCE TYPE

Sources:
See the text.
Our exchange rates are based on three types of transactions. First, we have the most elementary ones, manual exchange, in other words on-the-spot exchange of coins of different currencies. Second, some exchange rate notations appear in loans where the creditor agreed to repay the sum he borrowed in a different currency. And finally, there is the most sophisticated kind of exchange, which made use of bills of exchange. The Canonical interpretation of usury meant that lending money at interest, though permissible under certain circumstances, was immoral and illegal. Accordingly, rates mentioned in loans and bills of exchange must have contained a hidden interest rate. For those found in bills, this applied if the bills were primarily used as credit instruments. When they were used to transfer money, exchange rates probably contained a transport cost component.Footnote 12 Hence, there must have been systematic differences between these types of exchange rates and those paid in manual exchange. Unfortunately, our sources specify the kind of contract in only about 4 percent of the cases—too few to allow determining the actual share of transactions involving interest or transport cost. As in such cases, exchange rates depended on varying timings and distances, we expect the growing importance of loans and bills of exchange to increase the variability of gold-silver ratios within and between places.
Late medieval exchange rates were also influenced by the special popularity that some gold currencies enjoyed. Consumers were prepared to pay a premium for certain types of gold; in consequence, ratios determined for one place but on the basis of different currencies are not necessarily alike. This is why we limit our analysis to transactions involving the Rhinegulden, the most widely used gold currency. In addition, we include only rates based on the most popular silver currencies used in each locality. Another issue is that transaction size may arguably matter to liquidity and thus to bid-ask spreads. However, when testing this, we found no significant correlation between it and the exchange rate.
The question of how the gold and silver content of the coinage developed involves difficulties of its own. Apart from the fact that the sources are often ambiguous about the coins that were exchanged, there are four issues that need to be highlighted. First, information on the bullion content of coins (primarily from ordinances and contracts between political authorities and the mint personnel) is sometimes difficult to interpret. Medieval and early modern mint technicians were generally unable to produce chemically pure gold and silver. In some cases, thus, it is unclear if the sources refer to pure precious metal that was to be alloyed with specified quantities of base metals such as copper, or just to gold and silver of the highest feasible purity, to which the copper was to be added. Here, we assume that if not explicitly stated otherwise, the sources meant silver and gold of the highest available purity. A second difficulty arises because small denomination coins usually contained proportionally less silver than larger ones. For simplicity, we assume that people used the largest silver denominations available to pay for gold coins rather than small change (sellers would likely have only accepted such larger coins).
Debasements and reinforcements pose a third difficulty because there is no direct information on how long it took to replace old coins in circulation with new ones. The speed of replacement varied depending on whether the bullion content was reduced or increased. If the face value of the coins remained unchanged, debasements created incentives to exchange old for new ones as quickly as possible. By contrast, in case of reinforcements, Gresham's Law implies that old coins stayed in circulation longer. It is also the case that the further the mint was from the market place, the longer it would take for new coins to replace the old ones. How long replacement took, finally, also depended on the mint output in the period after the change in the standard. With few exceptions, relevant data do not exist. As we work with yearly data, we need not worry about potential adjustments within weeks or months after changes in the monetary standards; we nonetheless control for the distance from the mint.Footnote 13
A final difficulty is caused by the fact that, once in circulation, money became worn down. While the higher purchasing power of gold implies that it circulated slower and was exposed to less wear and tear than silver, silver was more often alloyed to a higher degree with base metals—a process that increased its hardness. It is therefore plausible that coins made of both metals suffered similarly from defacement. As mint outputs varied, the average age of coins in circulation must have varied, too. In this respect, assuming that all coins were equally defaced is therefore unrealistic, but since in most cases mint output data do not exist, it is an acceptable simplification.
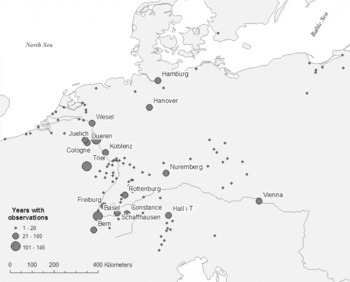
Figure 1 shows the spatial distribution of the yearly means that we use in the analysis. Our observations are a sample of the transactions concluded on the late medieval money market, whose composition is determined by the survival and accessibility of the sources. The drawbacks of such a data set are obvious: the area under study is imperfectly represented and observations are concentrated in West Germany. One implication is that developments further east are poorly covered—for example flows of capital from the Hanseatic cities toward Leipzig or from Nuremberg toward Thuringia and Saxony.Footnote 14 However, the resulting bias has an important advantage: most observations are found along the main artery of late medieval transcontinental trade, which linked Italy and the Netherlands. This implies that the assumption of ongoing trade, needed to carry out analyses such as ours, is not very demanding in this context. Moreover, the sample lends itself to testing the hypothesis that new long-distance trade routes developed in the Rhineland. Despite its limitations, our data set represents the largest assemblage of medieval financial data ever quantitatively examined. It allows the econometric analysis of financial integration offering new insights into the development of late medieval trade.
EXCHANGE RATE OBSERVATIONS, 1350–1560: SPATIAL DISTRIBUTION

CYCLES OF INTEGRATION
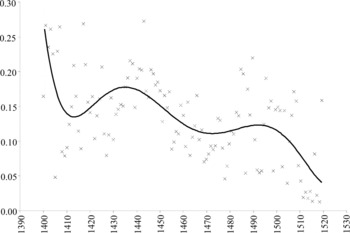
We begin the empirical analysis by asking if and to what extent there was an overall tendency towards integration in our area. The most common measure of overall levels of market integration in an area is the coefficient of variation (a dimensionless measure equal to the standard deviation divided by the mean).Footnote 15 The smaller it is, the lower is the level of “price” dispersion, indicating greater market integration. As well as examining the coefficient's linear trend, we use the augmented Dickey Fuller test, which signals a permanent trend,Footnote 16 and fixed-effects panel data analysis of the spreads.Footnote 17 To investigate nonlinear behavior, we estimate the trend also through the Epanechnikov kernel shown in Figure 2.Footnote 18
FINANCIAL INTEGRATION IN CENTRAL EUROPE: COEFFICIENT OF VARIATION OF THE GOLD-SILVER RATIO, 1400–1520

The data show that financial markets became better integrated in Central Europe during the fifteenth century. By 1520 gold-silver ratios tended to be far more uniform across our cities than in 1400. The negative slope of the linear trend (–0.087 percent), is significant at the 1 percent level. The panel data analysis suggests that spreads in 1511–1520 were about 1 gram silver per gram gold smaller than in 1400–1410, or that they fell by 70 percent. The unit root test rejects the hypothesis of non-stationarity at the 10 percent level because, as the kernel shows, convergence was cyclical rather than continuous. Figure 2 shows that the cycles of 1410–1465 and 1465–1520 were quite different: in the second cycle, long-term integration advanced significantly more rapidly. The overall pattern fits both the revisionist claim that the revival of late medieval trade began in the early fifteenth century, and the widely held view that trade expanded more rapidly after the 1460s.
The timing of cyclical disintegration does not match that of the “bullion famine” periods (1390–1410 and 1440–1460). The disruption that the coin scarcity might have caused to late medieval commerce thus appears to have been overstated. Price adjustments and credit instruments seem by and large to have successfully addressed bullion shortages. In contrast, we find a close correspondence between cycles of convergence and debasement.Footnote 19 This is at odds with the view that debasement can be dismissed as a primarily fiscal and potentially destabilizing policy motivated by warfare.Footnote 20 Arguably, some debasements were responses to the misalignment of gold-silver ratios between localities that triggered bullion flows.Footnote 21 However, usually rulers resorted to monetary debasements to deal with the effects of Gresham's Law.Footnote 22 Since the circulation of “bad” coins that were worn and defaced or of foreign coins of similar nominal but lower intrinsic value increased uncertainty about the quality of the money in circulation, such debasements caused sudden if temporary falls in transaction costs. This explains why they led to shrinking spreads. It also suggests that the cyclical nature of debasements may reflect periodical “cleanings” of the money market.Footnote 23 As the boundaries of our period coincide with the beginning and the end of integration cycles, these dynamics imply that the “real” long-term trend towards financial integration, which we observe, was not quite as marked but more consistent than the above figures suggest. How far does the tendency toward financial integration apply to all of Central Europe?
UNEVEN INTEGRATION
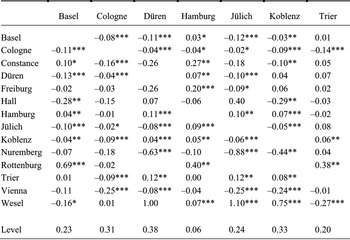
To examine trends in specific markets, we rely on the yearly changes of the absolute value of the percentage gold-silver ratio difference between city-pairs.Footnote 24 These rates indicate if and how well a locality was integrating with others, with a negative sign signaling integration and a positive disintegration. The higher the absolute value, the more rapid was the process. We also examine the correlation coefficients of the gold-silver ratios between pairs of cities to gauge if integration improved among weakly integrated markets or among those that were initially closely linked. In fact, correlation coefficients provide a measure of the extent to which gold-silver ratios developed stable linear relationships and thus of how well two localities were integrated, with higher values signaling greater levels of integration.Footnote 25
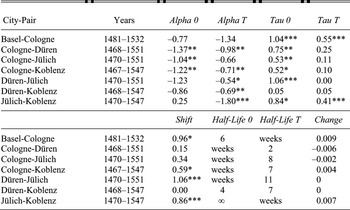
We focus on the seven best-represented cities: Basel, Cologne, Düren, Hamburg, Koblenz, Jülich and Trier.Footnote 26 All these cities except Hamburg are in the Rhineland. Cologne, Düren, Koblenz, and Jülich are relatively close to each other (less than 110 kilometers). Düren, Koblenz, and Jülich were much smaller than Basel, Cologne, and Hamburg, and somewhat smaller than Trier.Footnote 27 The sample thus allows us to explore patterns of long- and short-distance integration among centers of varying size within the Rhineland, as well as the integration of the Rhineland with other parts of the empire. The cells of Table 2 show the yearly changes of the absolute value of the percentage gold-silver ratio difference between the cities in the top row and those in the first column. The last row shows the average of the correlation coefficient.
FINANCIAL INTEGRATION BETWEEN CITIES IN CENTRAL EUROPE: TRENDS AND LEVELS

* = Significant at the 10 percent level.
** = Significant at the 5 percent level.
*** = Significant at the 1 percent level
Sources:
See the text and Table 1.
The process of financial integration was uneven but widespread. In 52 out of 88 cases, the absolute value of the percentage difference of the gold-silver ratios fell over time. In contrast to Tom Scott's assessment, increases in financial integration are well marked in large centers: Basel and especially Cologne.Footnote 28 The small centers tended to be relatively well-integrated, but evidence of progress is not as strong. Further east, Hamburg was poorly integrated, and that situation did not improve much.
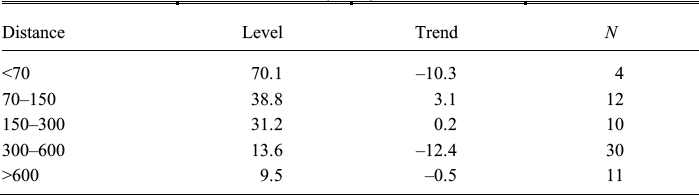
Whereas the average correlation coefficient declines monotonically with distance, the average yearly change of the spread does not. There were two parallel processes of integration at work: there is some evidence of local improvement between well-integrated cities, and strong evidence of long-distance integration between initially weakly linked localities. In this last subsample, the average decline in the spread is by 1.10 grams silver per gram gold. Medium and very distant cities did not tend to integrate (Table 3).
FINANCIAL INTEGRATION IN CENTRAL EUROPE: THE ROLE OF DISTANCE (in km)
N = sample size.
Sources: See the text and Table 1.
Differences in the cost of land transport—which was clearly particularly important in short-distance arbitrage—do not explain why integration broke off beyond the very local level. Political fragmentation in our region suggests that state formation may have played a role, but none of the cities that were neighbors to each other (that is, closer than 70 kilometers) and experienced integration were ruled by the same lord. However, there is evidence that transaction costs mattered: all these very close pairs were linked by an either official or de facto monetary union. By contrast, towns that were at a somewhat larger distance (70 to 150 kilometers), but experienced little or no integration, used different currencies. A number of medium-distant cities (70 to 300 kilometers) are in South Germany, that is, near the largest deposits of silver ore in Central Europe, whose discovery in the 1460s triggered the late medieval mining boom. Basel was comparatively well-integrated with most other cities in this area, but made substantial progress only with one: with Hall in Tirol. This suggests that overall the increase in liquidity that the silver mining boom brought about played a limited role.
This is not to deny the importance of the increase in the supply of silver. The prominence of long-distance integration (distances between 300 and 600 kilometers) between weakly integrated places fits the claim that new long-distance trade routes developed in the Rhineland as a consequence of the mining boom and a growing demand for luxury goods. Still, long-distance integration could also be traced to the concentration of financial services, improving river transport and falling information costs. Most city-pairs that were further apart than 600 kilometers include Hamburg. Accordingly, direct trade between the upper and middle Rhineland, where the observations are concentrated, and those parts of the east from where we have data does not seem to have been very important. In short, the uneven integration in the Rhineland is consistent with both exogenous increases in trade and falling costs. We now explore the relative importance of these factors.
ADJUSTMENT AND COSTS
For this purpose, we use a threshold autoregressive (TAR) analysis of the gold-silver ratio differences, allowing the estimated thresholds and speeds of adjustments to follow a linear trend.Footnote 29 The TAR model relies on three assumptions. First, differences between the gold-silver ratios of two cities follow a random walk when they lie between the thresholds of inaction (i.e., the specie points). If they fall outside the thresholds, arbitrage drives them back toward equilibrium. Second, the thresholds equal transport and transaction costs, which determine if arbitrage is profitable. Third, the speed with which differences that violate the thresholds adjust depends on the market's operational efficiency. This is determined by how quickly information about arbitrage opportunities is transmitted and exploited and by how flexible the gold-silver ratios are. As the transmission and exploitation of information is bound to increase with trade, changes in the speed of adjustment allows us to make inferences on exogenous changes in trade.
As argued earlier, a monetary debasement can cause a sudden fall in transaction costs. Neglecting this can lead to significant distortions. Hence, we use a dummy variable to control for the effect of the debasement on the estimated speed of adjustment, and we allow costs to experience structural break after the debasement.Footnote 30 A consequence of multilateral trade is that whenever differences between gold-silver ratios exceed the difference in transport and transaction costs between any other pair of localities within the same market network, indirect rather than direct arbitrage leads to adjustment.Footnote 31 As a result, the TAR estimates of costs are negatively biased, those of operational efficiency are positively biased, and the biases increase with distance.Footnote 32 To limit them, we analyze only cities probably connected by ongoing trade and mostly located at a short distance from each other: Basel-Cologne, Cologne-Düren, Cologne-Jülich, Cologne-Koblenz, Düren-Jülich, Düren-Koblenz, and Jülich-Koblenz. Basel and Cologne were major commercial centers linked by an established and increasingly important trade route alongside the Rhine. Düren, Jülich and Koblenz were relatively small but belonged to Cologne's hinterland.Footnote 33 According to our previous analysis, these pairs experienced increased integration. Moreover, we have unbroken time series for them from the second half of the fifteenth century.Footnote 34
THRESHOLD AUTOREGRESSIVE ANALYSIS RESULTS

* = Significant at the 10 percent level.
** = Significant at the 5 percent level.
*** = Significant at the 1 percent level
Notes:
Units of Measure: Tau 0, Tau T, and Shift are in grams gold per gram silver; Half-Life 0 and Half-Life T are in months.
Sources:
See the text and Table 1.
Table 4 summarizes the results of the analysis. The “0”- and “T”-coefficients refer to our estimates at the beginning and end of the period. Alpha is the speed of adjustment. Specifically, after a shock, the expected yearly change in the gold-silver ratio difference is a proportion of its distance from the specie point; alpha is this proportion. We expect the speed of adjustment to lie between -1 and 0, with -1 and lower values signaling perfect and 0 and higher values no integration. When the estimated speed of adjustment shows perfect integration, the half-life—that is, the time it takes to reduce a shock by a half, measured in months—is interpreted as being of a lower order of magnitude, i.e., weeks rather than months. Tau is the threshold: the difference between gold-silver ratios needed to trigger adjustment. Shift is the downward shift in the threshold as a result of debasement. “Change” is the slope of the trend followed by the threshold. Following the standard approach, the parameters are estimated by conditional least squares.Footnote 35
Previous studies estimate that in fourteenth- and early-fifteenth- century Central Europe, financial markets adjusted within months, the silver points lying between 0.12 and 0.98 grams silver per gram silver (when silver currencies were exchanged with each other) and the bullion points at about 0.7 grams silver per gram gold.Footnote 36 By contrast, almost half of our estimates place the half-life in the order of weeks. The estimates at the end of our period suggest that this difference is due to exogenous increases in trade, rather than to our focus on local integration. By the early sixteenth century, the Basel-Cologne market adjusted in weeks. In the hinterland of Cologne, most markets adjusted in weeks at the end of the 1460s, but thereafter their operational efficiency progressively decreased. This pattern indicates that different forces were at work in the early and late phase of integration of our period. A plausible interpretation is that in the first half of the fifteenth century, rising wages mainly affected local integration. By the second half of the century, wages had reached a certain threshold, with consumption shifting from necessities to luxury goods that were traded over larger distances. The mining boom contributed to the development of long-distance trade from the supply side. The relative importance of demand and supply factors, however, remains an open question.
Trading costs between Basel and Cologne are broadly in line with previous estimates. Our estimated minimum threshold is lower than in previous studies because we focus on close localities and in part because of a fall in the costs of short-distance trade compared to the first half of the century. In three cases, a positive slope signals that transaction costs tended to increase as the effect of debasement waned, but in all cases except one (where costs were uniformly small), the threshold was considerably lower at the end of the period than at the beginning. For example, shipping 1 kilogram gold from Basel to Cologne, exchanging it for silver, transporting this back to Basel and exchanging it for gold cost over 1.04 kilograms silver in 1481, as compared to over 0.55 kilograms in 1532. The size of this change is representative. Despite the exploratory nature of the analysis, these results suggest that short-distance integration from the later fifteenth century was mainly caused by declining costs—a finding that is consistent with the role of monetary unions emphasized earlier. During the same period, long-distance integration resulted from a combination of exogenous increases in trade and a substantial decline in costs, which raises the question: Why exactly did costs fall?
THE ROOTS OF PROGRESS
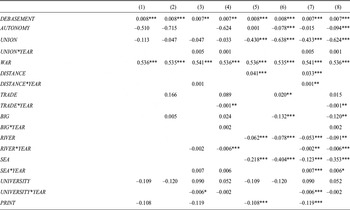
Following the standard approach, we use a panel data analysis to study the causes of financial integration between 1400 and 1520.Footnote 37 The dependent variable is the logarithm of the spread plus 1.Footnote 38 Apart from eleven decade-dummies, the independent variables belong to five categories: money, geopolitics, transport, information, and political institutions. There are three monetary variables. DEBASEMENT is equal to the kernel trend of the sum of monetary alterations of the principal silver currencies used in the area. As argued earlier, this is closely associated with cycles of convergence of the gold-silver ratios. AUTONOMY takes on the value 1 if the governments of both cities were autonomous with regard to monetary policies, as opposed to being subject to secular or ecclesiastic princes. We expect this variable to be associated with fewer potentially destabilizing fiscal debasements.Footnote 39UNION refers to whether the city-pairs were part of the same monetary union. This is expected to reduce transaction costs.Footnote 40
The geopolitical variables are WAR, which indicates if both cities were involved in a military conflict in the given year; TRADE, which is a proxy for trade between the two cities based on the gravity model, and is equal to the sum of the logarithms of the populations of the two cities minus the logarithm of their distance; and BIG, which shows if both cities had a population of 10,000 or more and captures concentration of financial services. We expect the coefficient of the first variable to be positive and those of the other two to be negative. DISTANCE (the distance in kilometers between the two cities) and two dummies indicating if the two cities have access to a river or sea port (RIVER and SEA) are the proxies for transport costs. We expect the coefficient of DISTANCE to be positive and those on RIVER and SEA to be negative.
Human capital and information costs are accounted for by whether both cities had a university (UNIVERSITY) and a printing press (PRINT), and by an estimate of the volume of circulation of the added printing output (CIRCULATION).Footnote 41 The coefficients of these variables are expected to have a negative sign. Finally, we explore the effect of political institutions on integration within polities by controlling for whether the two cities were ruled by the same secular lord (SAME_STATE) or were part of the same city-league (CITY_LEAGUE), and on integration across polities by controlling for whether they were both ruled by secular lords (STATE) or were both autonomous (CITY_STATE).Footnote 42 The bullionist policies practiced at the time constrained bullion flows and raised transaction costs between cities located in different polities; hence, we expect to find that integration within polities was particularly marked.Footnote 43
Changing cost structures imply nonstationary coefficients. We therefore examine how variables whose effect may have evolved significantly (UNION, DISTANCE, TRADE, BIG, RIVER, SEA, UNIVERSITY, SAME_STATE, STATE, CITY_LEAGUE, and CITY_STATE) interact with time (YEAR).Footnote 44 The Hausman test finds strong evidence of correlation between the random-effects and the regressors, so that this technique (or, equivalently, pooled OLS) produces biased estimates. Still, fixed-effects analysis does not allow exploiting information on transport costs, since their proxies are time-invariant. Moreover, heavy reliance on rarely changing (AUTONOMY, UNION, BIG, SAME_STATE, STATE, CITY_LEAGUE, and CITY_STATE) and cross-sectionally dominated (TRADE) variables implies that a fixed-effects specification is vulnerable to inefficiency as well. We therefore rely also on a fixed-effects vector decomposition (FEVD) model.Footnote 45 We estimate panel-corrected standard errors because different levels of transaction costs and common shocks across city-pairs imply cross-section heteroskedasticity and contemporaneous correlation.
Table 5 shows the results of the analysis. For reasons of space, we do not present the constant and the coefficients of the decade dummies. The first four columns show the fixed-effects models, while the following four present the FEVD estimates. Save for the omission of time-invariant variables in the fixed-effects models, the same specifications are estimated with the two techniques. The first specification includes the whole sample, while the second one is limited to those observations for which population data are available. It adds BIG and substitutes DISTANCE with TRADE and PRINT with CIRCULATION. The two following specifications are identical except for the inclusion of interactions with time. Considering that the panels are heavily unbalanced, we expect measurement errors and rely heavily on proxies, the adjusted R-square values signal a very good fit. Moreover, almost all coefficients have expected signs.
This holds for the monetary factors. Whenever the debasement index tended to become more negative, signaling a round of debasements, transaction costs declined and the spreads between cities tended to shrink. Yet fewer fiscal debasements, as implied by AUTONOMY, tended to produce smaller spreads. So did monetary unions: on average, spreads between cities in a monetary union were between 0.09 and 0.72 grams silver per gram gold smaller than in other places, depending on the specification. Only such unions can help explain why costs fell over time. Neither DEBASEMENT nor AUTONOMY became more frequent. In fact, the secular decline in urban autonomy meant that there are twice as many observations where both cities were autonomous with respect to monetary policy (AUTONOMY = 1) in the first half of the period as in the second one (912 as compared to 456). Conversely, the number of city-pairs in monetary unions almost doubles after 1460 (UNION = 1 grows from 63 to 113 observations), reflecting the growing importance of monetary unification.Footnote 46
THE ROOTS OF FINANCIAL INTEGRATION: PANEL DATA REGRESSION ANALYSIS

N = sample size;
* = Significant at the 10 percent level.
** = Significant at the 5 percent level.
*** = Significant at the 1 percent level
Sources:
See the text and Table 1.
According to the FEVD results, large centers tended to be better integrated: the coefficient for large cities (BIG) is in both cases negative and significant at the 5 percent level or less. However, there is no evidence of progress in terms of concentration of financial services (the interaction coefficients are positive, but not significant). War provides another key to understanding progress. As the fifteenth century progressed, trade benefited from a decrease in violence, (there are only two cases of WAR after 1460, as compared to 39 before). The coefficient is positive and highly significant across specifications. The estimates agree in showing that war was disastrous for financial integration. During military conflicts, spreads grew by on average 1.25 grams silver per gram gold. Still, in both periods war was a regional phenomenon that can explain disintegration only between a few places. TRADE has an unexpected sign, though not significant. Overall, stationary population data signal no major changes in wages, suggesting that these mattered little for financial integration. However, the interaction coefficients are negative with the consequence that under one specification a positive association between TRADE and financial integration eventually emerged. The disruption of trade routes by military conflict implies that the gravity model of trade loses predictive power. Hence, these results also suggest that increasingly peaceful conditions contributed to integration, at least to some extent.
The adverse effect of DISTANCE on integration did not decline in a linear way—a fact that reflects the lack of general progress in road quality or land transport technology in our period.Footnote 47 The financial significance of SEA was much greater than that of RIVER. This confirms that—as implied earlier—water transport mainly influenced long-distance integration. However, while the importance of SEA declined, that of RIVER increased.Footnote 48 This suggests that the decline in the cost of water transport was linked to improvements in infrastructure specific to rivers (the construction of towpaths) rather than to technological change in shipbuilding in general.Footnote 49 For the FEVD estimates, in 1400 spreads between river cities were between 0.18 and 0.63 grams silver per gram gold higher than those between other cities; by 1520 they had fallen to the point that they were below those between other cities by at least 0.31 grams. Apparently, trade expansion along the Rhine since the beginning of the mining boom was not the only relevant factor: financial integration tended to substantially improve along rivers in Central Europe.
Turning to human capital and information costs, the evidence that places with universities were better integrated is mild. Without interaction, the coefficient is consistently negative, but not significant. The interaction analysis shows that universities became an asset only after the 1460s. This can be traced to a synergy with printing. The measures of printing produce consistently negative and mostly highly significant coefficients. On average, spreads between cities with printing presses were 0.21 grams silver per gram gold smaller than between other places. Each new printed book was associated with a decrease in the spreads by 0.003 grams silver per gram gold. As shown elsewhere, printing helped financial integration mainly through the publication of “light” media, such as news-sheets with information on monetary standards, forgeries, and exchange rates, which reduced information costs and increased the financial significance of human capital.Footnote 50
As for integration within territorial states and city-leagues, the fixed-effects and FEVD specifications produce inconsistent signs, with only the latter providing evidence that cities under the same lord tended to be better integrated than others. With city-leagues, the situation is reversed. The interaction coefficient shows that state formation did not lead to advances within princely territories, either, confirming that state formation was not the engine behind local integration. In fact, the evidence of intra-organizational integration is stronger for city-leagues than for emerging territorial states. At least in late medieval Central Europe, the ability of princes to promote domestic economic integration more effectively than city-states seems to have been limited, with their bullionist policies being largely ineffectual. We should therefore regard their importance in explaining capitalist development at the time with reserve.Footnote 51
This is not to say that the rise of the territorial state did not matter; on the contrary. Positive interaction coefficients signal that integration between autonomous cities declined. In 1400 they tended to be comparatively better integrated than other cities, with spreads between 0.14 and 0.60 grams silver per gram gold smaller. By 1520, however, the estimates imply that spreads between autonomous cities were statistically no different than in other localities. Conversely, feudal territories tended to be initially poorly integrated, but their integration improved significantly over time. In 1400 the spreads between cities ruled by secular lords were on average between 0.35 and 0.92 grams silver per gram gold larger than between other localities; by 1520 they had fallen to the point that they were below those between other cities by at least 0.18 grams. Thus, what we observe is a reversal of the fortunes of cities and territorial states.
That there was integration between instead of within states suggests that cooperation rather than competition between princes helped capitalist development.Footnote 52 An important contribution to the process of integration must therefore be the revival of the Holy Roman Empire, whose institutions provided an increasingly important forum to coordinate princely policies.Footnote 53 From about the 1470s, the imperial diet evolved from an infrequent and ineffectual gathering of princes and representatives of cities into a forum that produced harmonized regulations and coordinated law enforcement. The emerging “dualism” between empire and estates facilitated what has been described as a “densification” of power.Footnote 54 Cities, however, had always stood outside the feudal structure dominated by the princely courts; as the empire was revived their legally and socially inferior role became more economically relevant.Footnote 55 Institutional change thus helped improve integration among emerging territorial states far more than among cities.
CONCLUSION
Our results help revise the economic history of the fifteenth century. The early part of this century was traditionally seen as a time of depressed commercial development, with a revival setting in only from about the 1460s. From the perspective of financial integration, however, the century experienced commercial improvement from its very start. The 1460s just saw a quickening of this process. Integration was uneven but also remarkably common; it was particularly marked between weakly integrated distant places in the Rhineland like Basel and Cologne. This confirms that new long-distance trade routes between South Germany and the Netherlands played a key role in reviving late medieval trade. The mixed results of regional studies on fifteenth-century grain market integration highlight that questions remain regarding the relationship between this first age of capitalist commercial growth and welfare. Future research needs to systematically examine how strongly financial integration was associated with changes in the real economy, and if market integration led to economic growth.Footnote 56
The cyclical nature of financial integration cannot be explained by the “bullion famines.” In fact, their importance for the late medieval economy appears to have been overstated. Rather, it appears that the cycles were caused by periodic waves of debasement aimed at “cleaning” the money market. These triggered sudden but temporary falls in transaction costs. As we discuss elsewhere, this finding has profound implications for our understanding of debasement.Footnote 57 The sources of the long-term fall in trading costs in the Rhineland were quite varied. Transport costs declined because security increased and especially because rivers became easier to navigate. Transaction costs fell because monetary unions promoted integration between close localities, printing reduced information costs and increased the relevance of human capital, and the emerging territorial states addressed coordination problems. These developments call into question the primacy of exogenous forces such as population in reviving late medieval trade. Recent research has emphasized limitations with Malthusian models of late medieval real wages.Footnote 58 A relative decline in the importance of trade in necessities is also consistent with the changes in the cost structures that we detect.Footnote 59 Preliminary analysis suggests that the mining boom strengthened financial links between the mining districts and other areas in Central Europe, but confirms that overall increases in liquidity had a limited effect on financial markets.Footnote 60
Surprisingly, the rise of the territorial state was closely associated with integration between rather than within polities. This is a development that we trace to the synergy between territorial and imperial rule, which intensified toward the end of the fifteenth century. From this perspective, it becomes apparent that overlapping rather than sovereign authorities—cooperation rather than rivalries and competition —contributed to market integration. Theories of state formation and market integration therefore need to be adjusted to take into account how actors at the supraterritorial (or interstate) level can help addressing coordination problems for late medieval Central Europe. David Chilosi's model of political and economic integration can cast light on the causes as well as the consequences of the revival of the empire: if, as a result of market integration, the provision of public goods involves positive externalities between polities, lack of coordination at the interstate level leads to suboptimal prisoner's dilemma-like outcomes.Footnote 61