

INTRODUCTION
“[I]t is difficult to distinguish politics from entertainment, and dangerous to try.”
- Brown v. Entertainment Merchants Association (2011)
“Trump got elected. But TV became president.”
- James Poniewozik, Audience of One (2019)
Americans consume a tremendous amount of television. The 96% of households with a television (Nielsen Reference Nielsen2021) spend between 8 and 9 hours a day watching television (Madrigal Reference Madrigal2018), with individuals averaging over 4 hours of television per day—over half of Americans’ total leisure time (ATUS 2019).Footnote 1 Even in an increasingly digital world, no medium can compete with television’s reach and potential to communicate with the American public. In this light, the extensive scholarship considering broadcast media’s role in American politics should be no surprise. Research has amassed an impressive body of evidence estimating the media effects on election outcomes (Hopkins and Ladd Reference Hopkins and Ladd2014; Martin and Yurukoglu Reference Martin and Yurukoglu2017), polarization (Arceneaux and Johnson Reference Arceneaux and Johnson2013; Levendusky Reference Levendusky2013), agenda setting (Boydstun Reference Boydstun2013), and elite behaviors (Clinton and Enamorado Reference Clinton and Enamorado2014).Footnote 2
While the outcomes differ, most previous studies have focused on the effect of the news media on political outcomes. Yet with the advent of cable television and the Internet, the media landscape has changed dramatically. Fewer and fewer are tuning in to traditional news (Arceneaux and Johnson Reference Arceneaux and Johnson2013; Bakshy, Messing, and Adamic Reference Bakshy, Messing and Adamic2015; Flaxman, Goel, and Rao Reference Flaxman, Goel and Rao2016; Van Aelst et al. Reference Van Aelst, Strömbäck, Aalberg, Esser, De Vreese, Matthes and Hopmann2017). Audiences for the evening newscasts, once the most watched time slot, have dropped by 31% in the past decade alone (Moskowitz Reference Moskowitz2021). Our fragmented media environment provides countless alternatives to conventional news coverage, breaking its previous monopoly over content and allowing the less politically attentive to choose entertainment instead. Despite a handful of studies that examine the effect of entertainment on political attitudes—ranging from foreign policy knowledge (Baum Reference Baum2011) to the perceived legitimacy of radical political action (Jones and Paris Reference Jones and Paris2018), from beliefs in the American Dream (Kim Reference Kim2023) to politicized views of ESPN (Peterson and Muñoz Reference Peterson and Muñoz2022)—the extent to which entertainment media shape contemporary electoral politics remains largely unknown.
In this article, we bridge neighboring theories in political science and communication to conceptualize the potential power of entertainment media in the realm of electoral politics. As most voters lack personal interactions with politicians, the candidate–voter connections are primarily parasocial. We argue that entertainment media offer unique opportunities for politicians to build parasocial ties with voters, not only because Americans primarily consume entertainment over the news but also because it provides some of the only uncontested, “one-sided information flows” (Zaller Reference Zaller1992). Accepted without much resistance in an ostensibly apolitical context, these considerations can then be accessed in more explicitly political arenas.
We begin by describing how entertainment media provided Trump the opportunity to develop a public persona that would benefit his eventual political career. For 11 years, The Apprentice presented Trump to an audience of millions as “America’s Boss”—a successful businessman; a savvy negotiator; a tough, but supportive mentor; adept at reaching profitable deals in high-pressure situations. While scholars have presented a range of compelling explanations for his unconventional path to the White House (Hochschild Reference Hochschild2016; Inglehart and Norris Reference Inglehart and Norris2017; Sides, Tesler, and Vavreck Reference Sides, Tesler and Vavreck2019), we use an eclectic array of data to describe how this program fostered a favorable image of Donald Trump, which would in turn propel his successful, insurgent 2016 campaign.
We then turn to national survey data to probe the mechanism of parasocial ties. Using a survey of white voters conducted before the 2016 presidential election, we find that regular viewers of the program were more likely to trust Trump, feel a personal connection to him, and reject information critical of his candidacy. Open-ended answers further reveal that avid Apprentice viewers were explicitly relying on aspects of his television persona, such as his business experience and leadership potential, to explain their support. In contrast, nonviewers supporting Trump were more likely to evaluate his campaign along more typical partisan dimensions.
Next, by exploiting the geographic variation in viewership induced by channel inertia—the estimated spillover in ratings driven by the previous time block’s viewership—we show that exposure to The Apprentice increased Trump’s electoral performance in the 2016 Republican primary. Such effects do not exist for other Republican presidential candidates in either general or primary elections, or other prime-time TV shows on NBC during the same TV season. We report no effect of The Apprentice on the general election, a finding that sheds light on the possible scope conditions of entertainment media effects; they might matter more in a setting where partisan heuristics are lacking.
Together, these results suggest that The Apprentice allowed Trump to cultivate a reputation that would bear fruit for his nascent political career through the parasocial ties he established with the viewers/future voters. By providing a deluge of uncontested, seemingly apolitical considerations, entertainment media provides a unique route into the public consciousness.
Early theories of media effects relied on “an implicit acceptance of the media regime in place at the time” (Williams and Delli Carpini Reference Williams and Delli Carpini2011, 63)—an era where Walter Cronkite was a household name and 60 Minutes was America’s most watched television program. This tradition often discounts entertainment media as politically irrelevant, driving a research agenda removed from the daily media diet of ordinary Americans. But in this high-choice media environment where public attention increasingly turns from news and toward entertainment (Boydstun and Lawrence Reference Boydstun and Lawrence2020; Chadwick Reference Chadwick2017; Krupnikov and Ryan Reference Krupnikov and Ryan2022; Nielsen, Palmer, and Toff Reference Nielsen, Palmer and Toff2023; Prior Reference Prior2013), what entertainers can accumulate is political power (Archer et al. Reference Archer, Cawston, Matheson and Geuskens2020; Street Reference Street2004). Our findings here serve as a sober reminder that the study of the American voter can’t be removed from the study of the American viewer.
THE POWER OF ENTERTAINMENT MEDIA IN BUILDING PARASOCIAL TIES
Does entertainment media matter for the study of politics? By any metric, the American consumption of entertainment dwarfs that of the news (Jones and Paris Reference Jones and Paris2018). Yet the prevailing assumption has been that the political consequences of entertainment would be trivial because of its scattered messaging and seemingly apolitical narrative. The substantive content of entertainment programs was deemed “too sporadic to produce large-scale message effects of the sort described by the classic persuasion paradigm” (Bennett and Iyengar Reference Bennett and Iyengar2010) or a force that simply dilutes news media effects (Arceneaux and Johnson Reference Arceneaux and Johnson2013) and distracts the public from current affairs (Prior Reference Prior2013).
This isn’t to suggest that entertainment can’t deflect or dilute. For example, Velez and Newman (Reference Velez and Newman2019) explore the effect of Spanish-language television (SLTV) within Latino communities, focusing specifically on its introduction in North Carolina and Florida. By comparing Latinos residing just inside and outside the stations’ reception boundaries, they find that exposure to SLTV dampened political participation. Why? Because, as the authors note, very little SLTV programming is devoted to political news (821).
When political science research does consider the effects of entertainment media, it focuses on its role as an alternative source of information, especially for those who avoid more traditional news. Baum (Reference Baum2011), for instance, argues that foreign affairs covered in “soft news” programs get viewers otherwise uninterested in politics to pay attention to international crises. Scholars have also found that exposure to satire, comedy, and talk shows can promote political learning, whether knowledge of campaign finance regulations (Hardy et al. Reference Hardy, Jeffrey Gottfried, Kenneth Winneg and Hall Jamieson2016) or recognition of political candidates (Brewer and Cao Reference Brewer and Cao2006; Hollander Reference Hollander2005).
It would be remiss not to recognize the contributions of communication studies and cultural sociology to our understanding of entertainment media effects (Appel Reference Appel2008; Bartsch and Schneider Reference Bartsch and Schneider2014; Bryant and Miron Reference Bryant and Miron2002; Mulligan and Habel Reference Mulligan and Habel2011). Here, scholars have long explored cultivation theory—the idea that habitual exposure to the wider entertainment media environment can affect the audience’s perception of social and political realities. For instance, heavy television viewers are more likely to perceive the world as a meaner and scarier place, and support more restrictive criminal justice policies (Gerbner Reference Gerbner1998; Gerbner et al. Reference Gerbner, Gross, Morgan and Signorielli1986). Similarly, exposure to prime-time dramas featuring progressive portrayals of women was found to enhance support for increased gender equality (Holbert, Shah, and Kwak Reference Holbert, Shah and Kwak2003), while watching science fiction programs, such as The X-Files, reduced trust in government (Pfau, Moy, and Szabo Reference Pfau, Moy and Szabo2001).
However, much of this evidence is correlational in nature, limiting our ability to make causal claims about the effects of entertainment. Some research has leveraged experimental tools to address this problem. Mulligan and Habel (Reference Mulligan and Habel2011) find that watching the film Cider House Rules induced more pro-choice abortion views in its audience. Jones and Paris (Reference Jones and Paris2018) find that exposure to dystopian narratives, such as those present in the popular young adult films The Hunger Games and Divergent, increased the willingness to justify radical, even violent, forms of government resistance. Kim (Reference Kim2023) shows that exposure to “rags-to-riches” narratives common in reality television programs can increase viewers’ beliefs in the American Dream and promote tolerance for income inequality. Other scholars have utilized natural experiments to quantify the effects of entertainment, ranging from the impact of America’s first blockbuster movie, Birth of a Nation, on white supremacist activities (Ang Reference Ang2023) to the effects of cable soap opera on female school enrollment in India (Jensen and Oster Reference Jensen and Oster2009).
Yet it is unclear whether the entertainment media can influence electoral politics in contemporary America. On the one hand, the powerful force of partisan identity, which increasingly aligns with racial and social identities, suggests that the impact of other factors may be negligible, if not nonexistent. In this context, the idea that entertainment media could have a significant influence on voting patterns may seem a bit far-fetched. On the other hand, some empirical studies—all of them from earlier eras and different countries—highlight the potential of entertainment media. Xiong (Reference Xiong2021) finds that exposure to Ronald Reagan as a television host in the 1950s led to greater support for his early bids for elected office. Similarly, Durante, Pinotti, and Tesei (Reference Durante, Pinotti and Tesei2019) find that early access to Italy’s Mediaset all-entertainment content increased the likelihood of voting for its founder, Silvio Berlusconi, decades later.
This evidence underscores the potential of entertainment media to shape candidate–voter connections. Just as humans form attitudes and impressions toward other people, how voters evaluate politicians tends to be grounded in interpersonal notions of attraction and familiarity. Citizens’ perceptions of candidates’ personality traits, such as their perceived competence, empathy, integrity, or warmth, have a well-documented electoral impact (Fridkin and Kenney Reference Fridkin and Kenney2011; Hayes Reference Hayes2010; Lodge, McGraw, and Stroh Reference Lodge, McGraw and Stroh1989). But as most citizens do not interact with politicians in person, the candidate–voter connections are primarily parasocial—one-sided psychological bonds viewers cognitively develop with images of people they see through mass media (Cohen and Holbert Reference Cohen and Holbert2021; Giles Reference Giles2002; Horton and Wohl Reference Horton and Wohl1956). While parasocial ties can form through various media experiences, including news media, the majority of evidence on the media’s role in cultivating such relationships is situated within the context of entertainment media. This body of work demonstrates how parasocial interactions between audiences and celebrities—be they actors, comedians, or show hosts—can trigger various attitudinal and behavioral changes.Footnote 3
In many ways, these parasocial relationships are particularly well-positioned to influence political behavior. First, entertainment constitutes the vast majority of the average American’s media diet (Kim Reference Kim2023; Madrigal Reference Madrigal2018; Pinsker Reference Pinsker2018), providing a greater opportunity to form these bonds. Second, messages and narratives provided through entertainment media are more likely to be accepted. For example, comedy has been shown to reduce the tendency to counterargue a persuasive message (Boukes et al. Reference Boukes, Boomgaarden, Moorman and De Vreese2015), as a comedic message focuses people on processing the humor making them less likely to resist the underlying argument (Young Reference Young2008). And third, in comparison to the traditional news media environment where political candidates actively counter their opponents’ messages, entertainment media usually provides a one-sided information flow—notably lacking a “countervailing signal” that reduces susceptibility (Zaller Reference Zaller1992, 267).
When celebrity candidates take center stage in the electoral processes, the lines between politics and entertainment blur, allowing nontraditional candidates to exploit the parasocial relationship they have built from popular culture (Adam and Maier Reference Adam and Maier2010; Balmas and Sheafer Reference Balmas and Sheafer2015; Boydstun and Lawrence Reference Boydstun and Lawrence2020). For example, WWF star Jesse Ventura can present himself as a “political action figure” ready to “battle special interest groups” (Ventura Reference Ventura1998). Arnold Schwarzenegger, The Terminator star and former Mr. Universe, can criticize the “girlie men” in Sacramento during budget negotiations (Broder Reference Broder2004). Fred Thompson had little difficulty convincing Tennesseans he could serve as a statesman in the Senate, having “played a White House chief of staff, a director of the Central Intelligence Agency, a highly placed F.B.I. agent, a rear admiral, [and] even a senator” on the big screen (Bragg Reference Bragg1994). Mehmet Oz’s major Senate campaign slogan during the pandemic was “A Dose of Reality,” priming both his medical and celebrity reputations cultivated through The Dr. Oz Show. Yet no case could be a more prominent test of the parasocial ties that entertainment media can forge than Donald Trump and The Apprentice.
THE APPRENTICE: PRIME-TIME EXPOSURE TO TRUMP AS “AMERICA’S BOSS”
How did entertainment media provide Trump the opportunity to develop a public persona that would benefit his eventual political career? Many commentators from left and right have suspected the role that a popular reality TV show, The Apprentice, may have played (Nussbaum Reference Nussbaum2017; Poniewozik Reference Poniewozik2019).Footnote 4 Heritage (Reference Heritage2016), for instance, rather bluntly argued: “You might think that the rise of president-elect Trump is down to sexism, or social media filter bubbles, or a country’s ability to put partisan politics ahead of personal judgment, or the dying roar of a frightened white majority. But it isn’t. It’s because of The Apprentice.” Though disentangling the causal link between the TV show and Trump’s electoral success is not as easy as pundits would put it, we argue that exposure to The Apprentice gave Trump a unique opportunity to build parasocial ties with viewers (see also Gabriel et al. Reference Gabriel, Paravati, Green and Flomsbee2018).Footnote 5
First, The Apprentice was popular. This competition-based reality TV—in which a group of contestants fight for the opportunity to run one of Donald Trump’s companies—drew 28.1 million viewers at its peak popularity. Its early seasons were NBC’s ratings juggernaut and nominated for the 2004 Emmy’s Best Reality Television Program. As seen in Figure 1, it attracted an average viewership of around 20 million viewers in its first year, an audience nearly three times greater than NBC Evening News and ten times greater than Fox News. Though the popularity dwindled over time, it continued to attract a greater or comparable audience to the evening news until 2015 (Appendix A of the Supplementary Material).
The Apprentice and NBC Evening News Viewership Over Time
Note: The figure displays the average viewership (in millions) for NCB Evening News and The Apprentice for 2003–15. If two TV show seasons were aired, then two bars are shown (i.e., in TV season 2004–5, seasons 2 and 3 of The Apprentice were on air). Appendix A of the Supplementary Material has further information, such as the specific time window for each season of The Apprentice and the viewership for the finale. We gathered the rating data from Wikipedia, which report the official estimates from Nielsen.

Second, with its universally positive portrayal of Trump, The Apprentice helped re-brand his public persona. By no means an unknown quantity, Trump had long used television as a means of brandishing his image. As early as the mid-1980s, Trump would appear as the sharp-dressed landlord or the wealthy suitor in cameo appearances on different television programs. But as Nussbaum (Reference Nussbaum2017) describes, his cameos throughout the 1980s and 1990s were that of an “arrogant self-promoter,” “omnipresent in pop culture,” but “often as a punch line.” The Donald Trump of the early 2000s, fresh off public divorces and bankruptcies, was held in nothing like the esteem “America’s Boss” would be in The Apprentice. For 11 years, The Apprentice presented Trump to an audience of millions as a savvy businessman and a decisive mentor.
Third, reality television provides an effective avenue for generating parasocial ties. Unlike other programming, reality TV is billed as reality. As Von Drehle described in his coverage of the Reference Von Drehle2016 election, “the crafted characters of reality TV experience a different kind of stardom from the TV and movie idols of the past. Fans are encouraged to feel that they know these people, not as fictional characters but as flesh and blood” (Reference Von Drehle2016). Trump, in this view, is not playing the role of a successful, powerful businessman, he is a successful, powerful businessman.
A closer look at the scripts themselves sheds light on how the The Apprentice contributed to revamping Trump’s image. The phrases that contestants used to describe Trump throughout the 13 seasons align with his own 2016 campaign messages. Trump is portrayed as someone who “has certainly given everybody a shortcut to the American Dream” (Season 1: Episode 1); “one of the most powerful men in the world” (S2:E1); “…a humanitarian. And somebody who’s also concerned about important causes” (S4: E13); “the greatest businessman ever” (S6: E1); “the Mack Daddy of the United States” (S3: E7); “an icon […] an amazing individual and everybody looks up to [Trump]” (S7: E13); There is even a scene in which Senator Chuck Schumer (D-NY) lent credence to Trump’s success, saying that “even when [Trump] was much younger,” he knew that “[Trump] was gonna go places” (S5: E8). Season 6, aired in 2007, features a person holding a “Trump for PRESIDENT” sign.
Public attitudes toward Donald Trump were not systematically measured while he was a (mere) reality TV celebrity, but scattered surveys between 1999 and 2005 (Appendix B of the Supplementary Material), hint that The Apprentice may have helped boost Trump’s favorability ratings. After the first two seasons were aired, more than half of Americans viewed Trump favorably.
Finally, the mainstream media frequently referenced The Apprentice during the 2016 election cycle. Figure 2 displays the weekly number of news articlesFootnote 6 that mentioned Donald Trump and one of four issues—immigration (white), health care (light gray), social security (dark gray), and The Apprentice (dark red). Perhaps not surprisingly, immigration was more discussed than issues of health care and social security in the articles that refer to Trump throughout the 2016 election cycle. Yet the total number of articles that refer to The Apprentice or Donald Trump’s former career as the reality TV show host was twice as high than the number of articles that mention social security (N = 697 vs. 306). For every three articles about Trump and immigration, there was one article that mentioned Trump’s reality TV program (N = 1,938 vs. 697). This is in sync with existing evidence that finds that the heavy mainstream media coverage of Trump (Patterson Reference Patterson2016), driven by the collision of celebrity politics with traditional journalism resulted in “as much clown-like coverage as serious coverage” throughout the campaign (Boydstun and Lawrence Reference Boydstun and Lawrence2020).
News Reference to Key Issues and The Apprentice during 2016 Election Cycle
Note: The stacked bar chart displays the weekly variations in the number of news articles that mention Trump and one of the four keywords: immigration, health care, social security, and apprentice. For the apprentice search, we included references to reality television as well. The period is from June 16, 2015 (when Trump announced his candidacy for president) to November 5, 2016 (the last Saturday before the election day). We used the Nexis Uni database, which allows us to do a keyword search for all major U.S.-based national and local newspapers, news magazines, and broadcast transcripts.
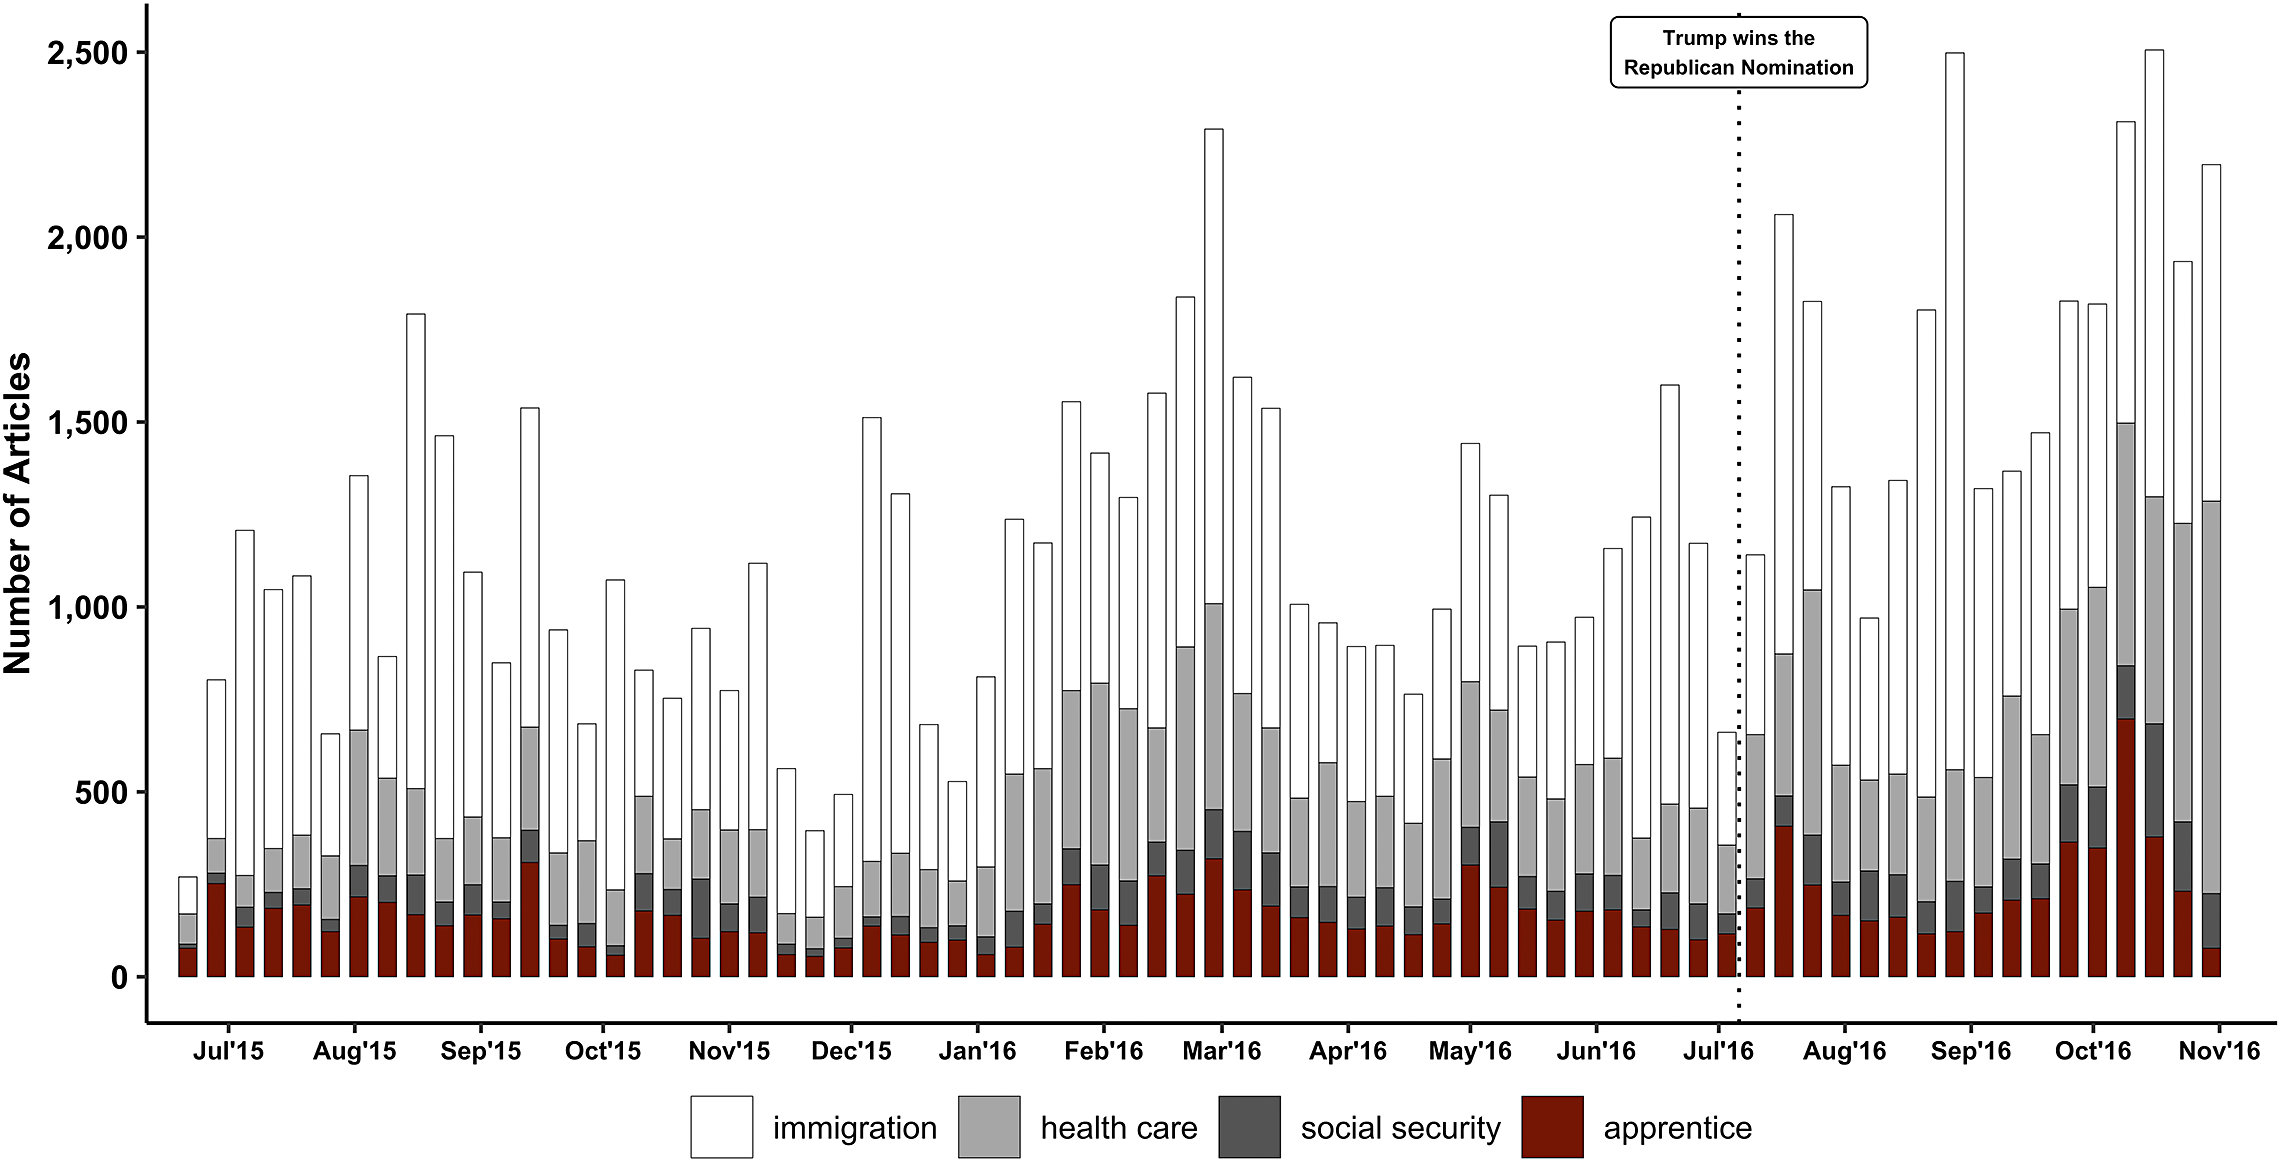
This is not to suggest that The Apprentice was more potent than other substantive political issues such as immigration. Rather, our goal is to illustrate that the mainstream media often depicted Trump through the lens of his reality TV persona from The Apprentice or as the successful businessman that the show helped to craft in public perception.Footnote 7 Though we do not have direct empirical evidence to probe whether such reminders could strengthen the connections between candidate Trump and “America’s Boss” for those who previously watched The Apprentice, we speculate that it is likely given the long-standing evidence on priming and cue activation in campaign communications. It is well-documented, for instance, how various explicit and implicit cues, as well as appeals to racial and gender identities, family upbringing, and former occupations, can influence the public’s evaluation of candidates (Druckman Reference Druckman2004; Hutchings and Jardina Reference Hutchings and Jardina2009; Mendelberg Reference Mendelberg2001; Sides, Tesler, and Vavreck Reference Sides, Tesler and Vavreck2019).
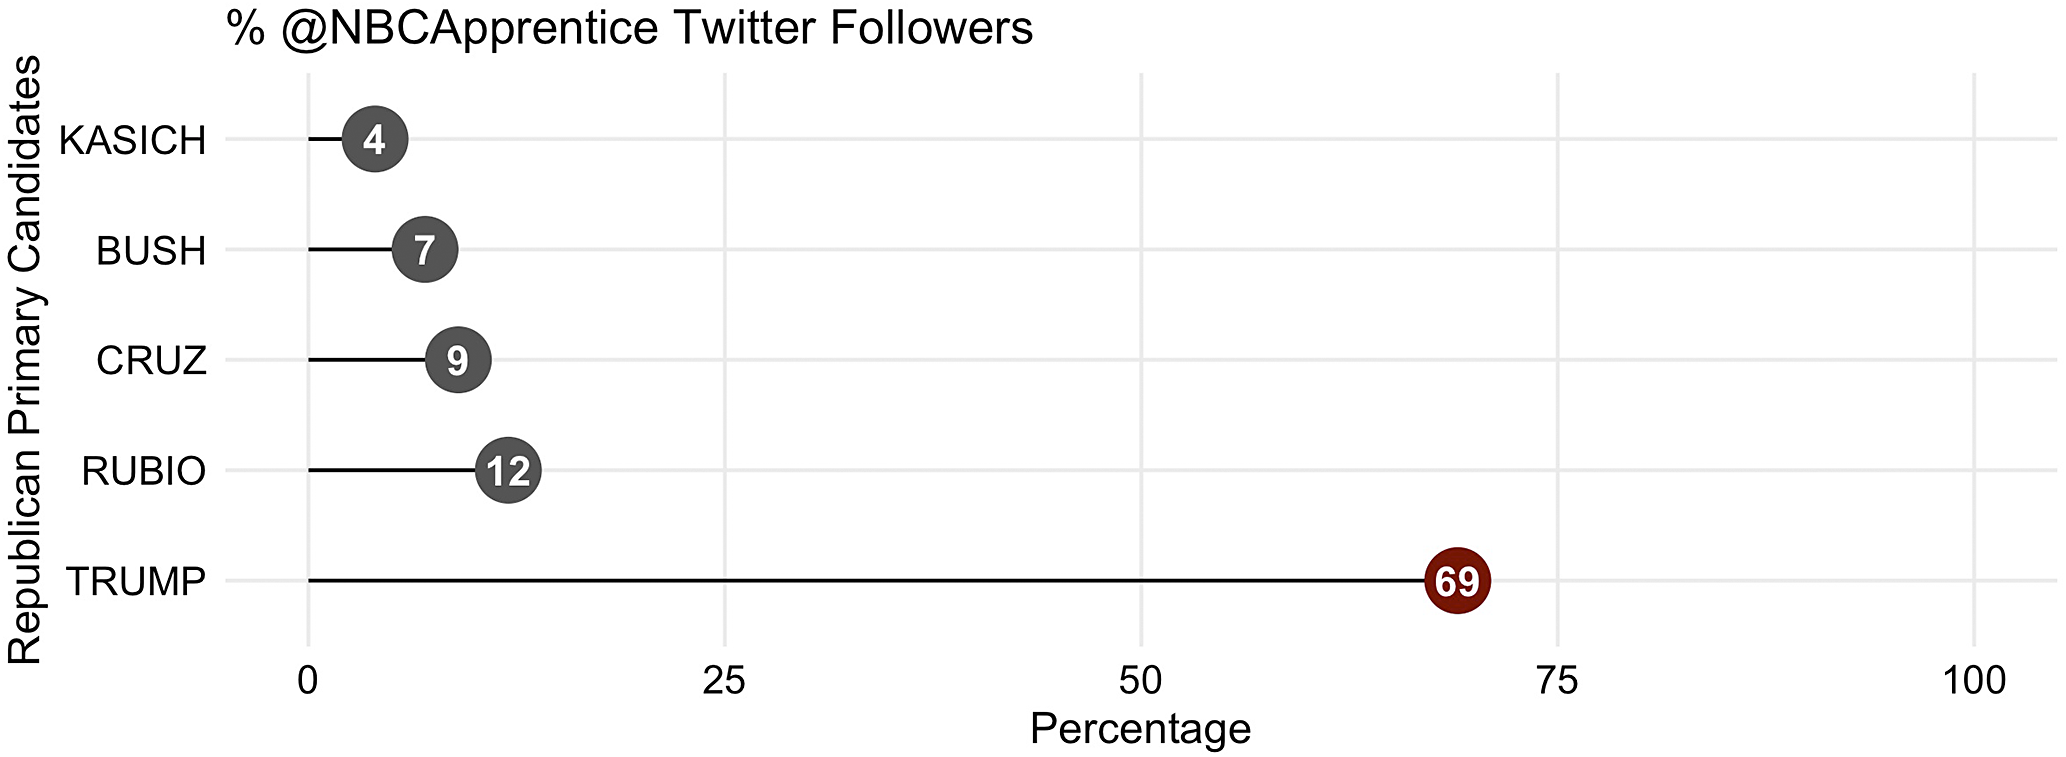
The link between Trump and The Apprentice—ironically activated by the mainstream media—is reflected in social media data as well. We scraped the Twitter handles of every user who follows the @NBCApprentice account (N = 114,121 in October 2020), and determined whether each user followed any other 2016 Republican primary candidates.Footnote 8 Figure 3 shows the percentage of the overlapping audience. We find that less than 15% of The Apprentice fans follow other Republican politicians, while 69% of them follow Trump on Twitter. Granted, as we do not know when a user started following Trump on Twitter, it is possible that they began to follow NBC’s The Apprentice account after becoming a supporter of Donald Trump. However, it would be hard to explain this scenario without the psychological bond of The Apprentice, particularly as Trump was no longer hosting the program.
 $ @ $
NBCApprentice Followers Who Follow 2016 Republican Primary Candidates
Note: This figure displays the percentage of @NBCApprentice account followers who also followed one of the 2016 Republican primary candidates. As of October 2020, @NBCApprentice had a total of 114,121 followers. We gathered data from Twitter and crossed-checked whether each follower also follows the official Twitter accounts of John Kasich, Jeb Bush, Ted Cruz, Marco Rubio, and Donald Trump.
Altogether, an eclectic array of descriptive data we assembled here—viewership statistics, TV transcripts, public opinion polls, news coverage, and Twitter data—strongly suggest that Trump’s candidacy could have benefited from the parasocial ties built via the entertainment media.
PROBING THE MICRO-MECHANISM OF PARASOCIAL TIES
While many have argued that The Apprentice contributed to the electoral success of Donald Trump, demonstrating this empirically is difficult. The first problem is a lack of data. Scholars were not thinking about the potential impact of The Apprentice per se, let alone thinking about the scenario of Trump running for office. Widely used national election surveys rarely ask about people’s entertainment media preferences, let alone their particular consumption of The Apprentice. Contemporary survey experiments that would have people watch The Apprentice and then measure their attitudes toward Trump would all suffer from post-treatment bias.
Given these limitations, to probe whether The Apprentice provided Donald Trump the opportunity to build parasocial ties with viewers, we first turn to one existing survey of white voters launched before the 2016 election—that happened to include several questions about Trump’s character and, importantly, reality television consumption habits. To the best of our knowledge, this is the only preelection survey that addressed both support for Trump and The Apprentice viewership.Footnote 9
Table 1 presents the relationship between self-reported viewership of The Apprentice and attitudes toward Trump. Support Trump measures the strength of electoral support for Trump. Both Trump believes in his policies and Trump cares about people like me measure agreement with that statement. Do not mind the Access Hollywood tape measures how respondents’ assessment of Trump was affected by the Access Hollywood tape (reverse coded). All outcomes have been re-coded to range from 0 to 1. We control for general television habits, preference for reality TV, political ideology, trust in politicians, as well as a host of demographic variables (age, income, education, and gender)Footnote 10 and state fixed effects in each regression. Even after controlling for observables, the frequency of watching The Apprentice is positively correlated with all dimensions of Trump support. Frequent viewers of The Apprentice are more likely to say that Trump believes in his policies and cares about people like them. They are less likely to say that the Access Hollywood tape—in which Donald Trump bragged about groping women—negatively affected how they think of Trump.
The Apprentice Viewership and Attitudes toward Trump
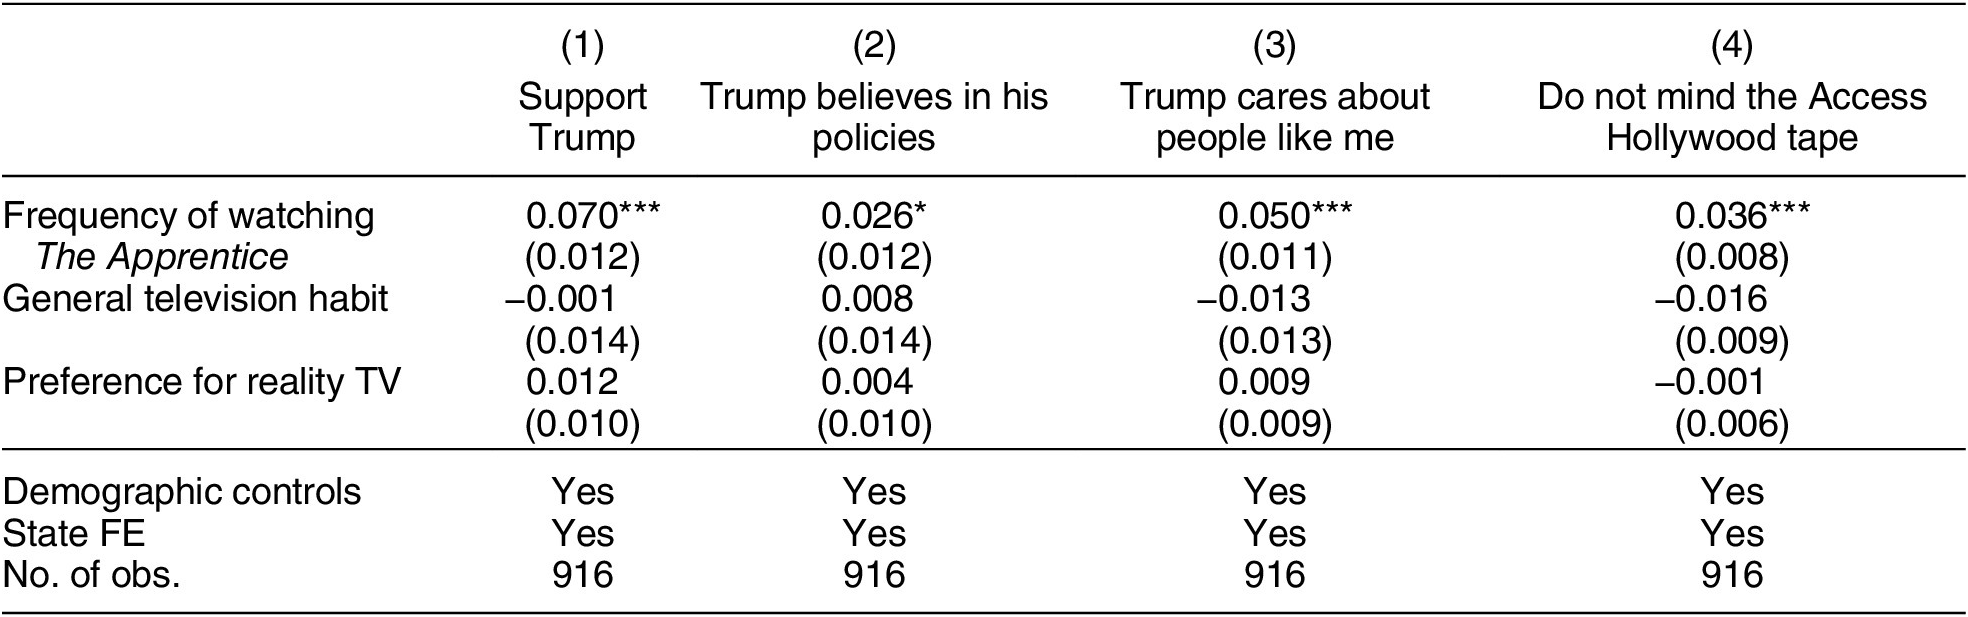
Note: All outcomes are re-coded to range from 0 to 1 for ease of interpretation. See Appendix E of the Supplementary Material for full results. *
 $ p< $
0.05; **
 $ p< $
0.01; ***
 $ p< $
0.001.
These effects are not negligible. In our full model specification (Appendix E of the Supplementary Material), we find that female voters on average are 7.3 percentage points less likely to support Trump than their male counterparts. The size of the coefficient on The Apprentice viewership in column 1 is of similar magnitude. If we compare those who are avid fans—who indicated that they watched The Apprentice every season—to those who never watched The Apprentice, then the avid viewers (N = 40 out of 916) are 28 percentage points more likely to support Trump. Given that 33% of the entire sample or 22% of those who are not liberal reported that they watched The Apprentice, the findings here shed light on how the parasocial ties built via entertainment media made Trump as a politically viable candidate in spite of a host of typically disqualifying political setbacks.
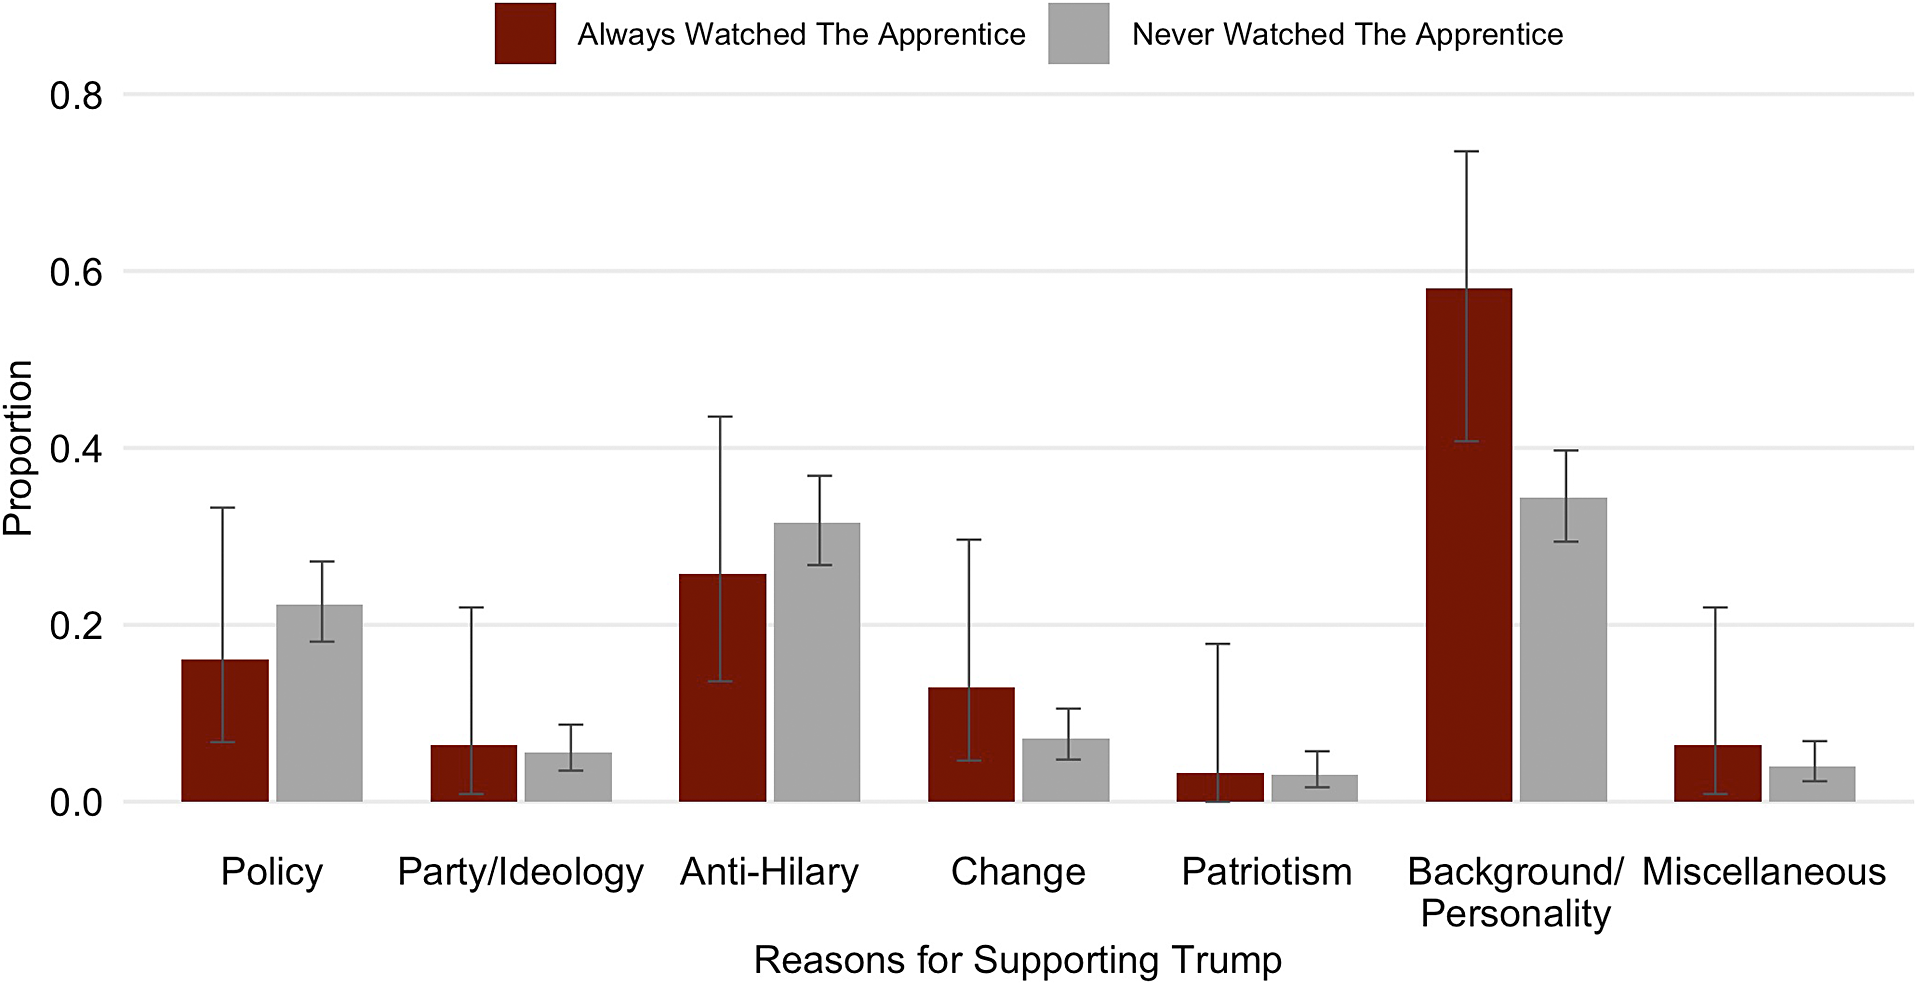
Among Trump supporters who never watched The Apprentice, we find frequent references to various policy issues (“Illegal immigrants,” “not planning war with Russia,” “Wall. Trade. Foreign policy.”) or the fact that he is just a better alternative than Clinton (“He’s not Hillary,” “He’s the only one that can save our country. Hillary belongs in jail.”) in their open-ended justifications for supporting Trump. In contrast, those who always watched The Apprentice relied more so on his personality traits (“a lot tougher,” “speaks his mind”) and business expertise (“Business man and not a politician”)—the Trump persona that The Apprentice cultivated. While the small sample size prevents a more systematic, rigorous text analysis of these open-ended answers, Figure 4 summarizes the content analysis of the open-ended answers (Cronbach’s Kappa = 0.889, see Appendix F of the Supplementary Material). Out of seven thematic categories, the only category that showed a meaningful difference between the avid viewers and nonviewers was the one on Trump’s background and personality. While 58% of open-ended answers from avid viewers referred to Trump’s personal characteristics, 34% of the answers from nonviewers contained such references.
Content Analysis of the Open-Ended Answers for the Reasons Supporting Donald Trump
Note: The figure displays the proportion of open-ended answers classified into seven themes for those who indicated that they have always watched The Apprentice (N = 31) and for those who never watched the show (N = 324). Cronbach’s Kappa for intercoder reliability is 0.889. See Appendix F of the Supplementary Material.
Our goal here is not to argue that the results—both the regressions and content analysis—are causal. If a respondent indicated that she regularly watched The Apprentice and intended to vote for Donald Trump, we could not know whether her vote intention prompted her to claim that she used to watch the TV show. It is also possible that the correlation between exposure to The Apprentice and electoral support for Donald Trump could be due to some other unobservable characteristics (Fioroni et al. Reference Fioroni, Lotz, Soroka and Hiaeshutter-Rice2022). While this concern is partially mitigated by the small and insignifificant coefficients on the impact of general television habit and preference for reality TV on supporting Trump, we now turn to a causal inference strategy using observational data to more convincingly claim that The Apprentice affected Trump’s political prospects.
IDENTIFYING THE ELECTORAL CONSEQUENCES OF THE APPRENTICE USING CHANNEL INERTIA
To identify the electoral consequences of The Apprentice, we exploit the fact that in the early 2000s, channel inertia—viewers staying on the same channel even when a program ends—was quite common (Gershon Reference Gershon2013). A rich strand of social psychology research finds that the default options substantially affect viewers’ choices and substantial inertia exists even when the cost of switching—such as requiring a press of a button on a remote control—is negligible (Esteves-Sorenson and Perretti Reference Esteves-Sorenson and Perretti2012). As one advertising executive put, the media environment in pre-Netflix America was the one in which “you could read the phone book after Seinfeld and get a 25% viewer share.”Footnote 11 Indeed, network producers designed TV programs to encourage a natural audience flow so that people can transfer from the completion of one program to the beginning of another without much resistance (Gershon Reference Gershon2013, chap. 2). Such an idea is captured in the phrase “watching television” as opposed to watching a particular program; for network producers, television viewing was about promotion and information for an entire evening (Turner and Tay Reference Turner and Tay2009).
Building on this insight, we exploit the fact that early seasons of The Apprentice used to be aired on Thursdays after popular 8 p.m.-sitcoms Joey and Will & Grace—programs that attracted around 20 million viewers. We use the 8 p.m. Nielsen ratings in 2004 as an instrumental variable for the ratings for the 9 p.m. program, The Apprentice, as we expect those ratings are correlated due to channel inertia. In particular, we rely on ratings data during the “sweeps” periods (November, February, and May) for 2004–5 period where two early seasons of The Apprentice (seasons 2 and 3) were aired.Footnote 12 We argue that this is a valid instrument as it is implausible to believe that viewership of those two sitcoms—while related to the ratings of The Apprentice—would affect people’s vote choice in a Republican primary more than a decade later, after conditioning on a host of sociodemographic variables.Footnote 13
Formally, this is encapsulated by the following system of equations:
 $$ \begin{array}{rl}Apprentic{e}_i={\delta}_1Ratings\hskip0.3em 8p{m}_i+\alpha {X}_i+{\alpha}_s+{u}_i,& \end{array} $$
 $$ \begin{array}{rl}Vot{e}_i=\beta \hat{Apprentic{e}_i}+\alpha {X}_i+{\gamma}_s+{\epsilon}_i.& \end{array} $$
The first-stage regression describes how viewership of The Apprentice varies with the popularity of the program immediately preceding it (Joey or Will & Grace) in county i. The idea is that viewers who just finished watching the program immediately preceding The Apprentice might be more inclined to remain and continue watching television on the same channel. The resulting variation would be driven by channel inertia rather than explicit preferences for The Apprentice. In the second stage, we estimate our coefficient of interest by regressing the Trump vote share on predicted viewership of The Apprentice.
We argue that our instrument is correlated with vote support for Trump, but uncorrelated with the error term. People choose to watch entertainment media primarily to entertain themselves. Some of the characteristics that lead people to watch entertainment (i.e., low education) might lead them to vote for the populist political candidate, for instance. But after conditioning on relevant factors in the first stage, we find that 8 p.m. rating is a relevant instrument, as evidenced by the strong first-stage results in Table 2. If our instrument affects our outcome through some mechanism other than our endogenous regressor, the validity of our instrument would be called into question. The exclusion restriction is difficult to verify empirically. To address the possibility that there might be some unobservable traits that affect the instrument (watching Will & Grace and Joey), the treatment (watching The Apprentice), and support for Donald Trump, we conduct three tests.
The Apprentice Effect on Trump Vote Share

Note: All regressions are weighted by the number of TV households in each county. Appendix I of the Supplementary Material has full regression results. Trump vote share is measured as a percentage, ranging from 0 to 100. *
 $ p< $
0.05; **
 $ p< $
0.01; ***
 $ p< $
0.001.
First, we address the possibility that existing attitudes toward the LGBTQ could affect both the likelihood of watching Will & Grace and electoral support for Trump in 2016. The fact that Will & Grace—TV show widely considered to cultivate pro-LGBTQ attitudes—was one of the lead-ins to The Apprentice raises the question about the validity of the instrument, particularly if the effect of viewership of Will & Grace on support for Trump in the 2016 primaries was at least partly mediated through attitudes toward gays and lesbians (Mason, Wronski, and Kane Reference Mason, Wronski and Kane2021; Schiappa, Gregg, and Hewes Reference Schiappa, Gregg and Hewes2006). To alleviate this concern, we include county-level measures of religiosity and the proportion of same-sex couples as covariates, as rough proxies for attitudes toward LGBTQ.Footnote 14
Second, we also show that it is unlikely that attitudes toward LGBTQ were electorally consequential among Republican primary voters in 2016. For example, the 2016 CCES asked respondents to rate the importance of 15 different political issues. Among voters who either identified with or leaned toward the Republican Party, all considered “gay marriage” overwhelmingly a “not important” issue, regardless of which Republican candidate they supported. Indeed, it was considered the least important issue regardless of whom they supported in the primary (see Appendix G of the Supplementary Material).
Third, we also address the potential concern that our instrument might be correlated with nontraditional sources of support for the Republican party since Trump was an outlier candidate. We test to see if the county-level viewership of the 8 p.m. program is correlated with the factors that have been argued as precursors to Trumpism, such as the Tea Party movement (Skocpol and Tervo Reference Skocpol and Tervo2019) and backlash against trade liberalization (Hochschild Reference Hochschild2016; Mutz Reference Mutz2018). As reported in Appendix H of the Supplementary Material, we find no evidence that our instrument—8 p.m. rating—correlates with any of these factors that may have foreshadowed Trump’s candidacy.
Results
Table 2 presents our instrumental variable estimates of the effect of The Apprentice on two outcome measures using a two-stage least squares (2SLS) model. All regressions are weighted by the number of households with a television in each county and include state fixed effects. Column 1 presents the first-stage relationship between 8 p.m. ratings and The Apprentice (9 p.m.) ratings. This estimate indicates that 8 p.m. ratings are indeed positively related to 9 p.m. ratings. The statistical significance here underscores the relevance of the instrument and serves as evidence of channel inertia. The first-stage F-statistics for the excluded instrument are all over 270, which means that it is unlikely that a weak instrument biases our estimates.
Columns 2 and 4 show the ordinary least squares estimates. Analyzing the OLS estimates first, 9 p.m. ratings have a positive association with Trump’s vote share in the primary election (column 2), but not in the general election (column 4). Panel A columns 3 and 5 present the second-stage estimates of the effect of 8 p.m. ratings on the Trump vote share for the Republican primary and presidential election. As shown, there is a clear causal effect of The Apprentice for the Trump vote share for the Republican primary. Note that our 2SLS estimates are larger than OLS estimates because our instrumental variable strategy estimates the local average treatment effect (LATE)—treatment effect among those who saw The Apprentice if and only if they were watching the previous show. This heterogeneity will make the IV estimates larger than the OLS estimates. Substantively speaking, the 2SLS estimate from column 3 indicates that one standard deviation (4.83) increase in the (instrumented) Apprentice ratings would lead to a roughly 1 percentage point increase in county-level vote share for Trump. In the context of a competitive primary election with more than 10 candidates, these effects are not insignificant. In the Iowa caucus, the difference in vote share between Trump and Rubio was 1 percentage point. In Arkansas, Trump’s overall vote share was 33% whereas it was 31% for Cruz. Considering the winner-take-all delegate allocation in Republican primaries, these increases can lead to dramatic changes in primary outcomes.Footnote 15, Footnote 16
But one might wonder whether those who watch television, not The Apprentice per se, are inherently different from those who don’t. Those fundamental differences somehow made them more prone to voting for Trump. For instance, frequent TV viewers might be more vulnerable to populist rhetoric (Durante, Pinotti, and Tesei Reference Durante, Pinotti and Tesei2019). We address this concern by exploiting the fact that later in the 2004–5 TV season (i.e., July 2005), at 9 p.m., instead of The Apprentice, Will & Grace was aired—followed by Joey (8 p.m.–9 p.m.). If there is something about those who watch television at 9 p.m. that made them more likely to support for Trump—regardless of The Apprentice, then we would see the significant effects when we use the July 9 p.m. ratings data. We find that both a simple OLS regression and an instrumental variable regression show no effect, as shown in Table 3.
No Effect of Another NBC 9 p.m. Program (Will & Grace) on Support for Trump

Note: All regressions are weighted by the number of TV households and include state fixed effects. Appendix J of the Supplementary Material has full regression results. *
 $ p< $
0.05; **
 $ p< $
0.01; ***
 $ p< $
0.001.
We also conduct placebo tests where we use the same IV specification but look at the vote share of the major candidates for the previous election’s Republican primary. As seen in Table 4, the results are either null or substantively not meaningful. The (instrumented) The Apprentice ratings seem to have tangential, negative effects on Gingrich’s primary vote share, but the size of the 2SLS coefficient (−0.001) is a fraction of the one predicting Trump’s primary vote share (0.239). We find these placebo tests reconfirming our main findings on the unique role of The Apprentice in cultivating support for Trump.
The Apprentice Effect on Republican Primary Candidates in 2012
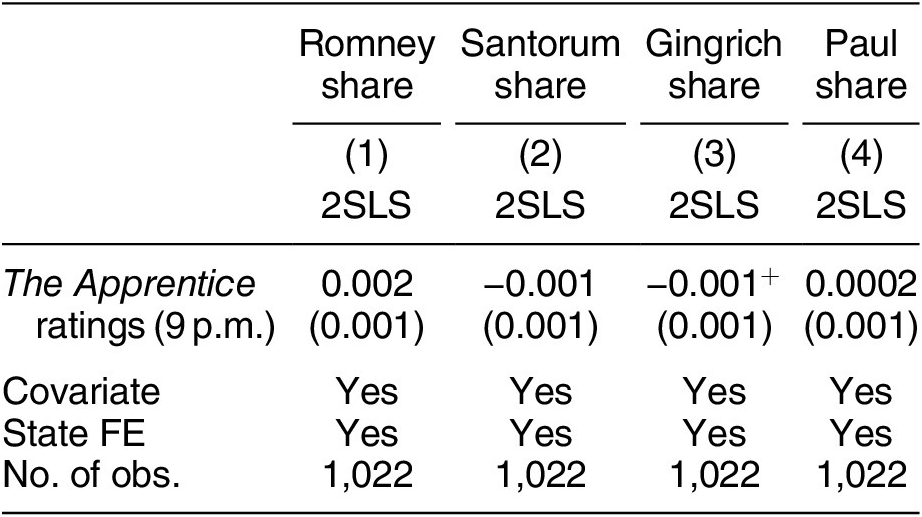
Note: All regressions are weighted by the number of TV households and include state fixed effects. Appendix K of the Supplementary Material has full regression results.
 $ +p< $
0.1, *
 $ p< $
0.05; **
 $ p< $
0.01; ***
 $ p< $
0.001.
It is also worth reflecting on how our LATE relates to our underlying theory of parasocial relationships. These relationships are typically characterized by strong, habitual connections with media figures. This could appear at odds with our estimand in the instrumental variable analysis, which identifies the impact of incidental viewership of The Apprentice. However, this is why we focus on early ratings for The Apprentice. We think it reasonable to assume that the 2004 compliers are more likely to become habitual viewers (in later years) than nonviewers. The incidental viewership induced by channel inertia would not have immediately sparked the parasocial ties, but increased the opportunity for them to form. By the end of Trump’s tenure on The Apprentice, it becomes more difficult to make causal arguments about exposure to the program.
In many ways, our approach echoes those of studies of Fox News, which use channel positioning as an instrumental variable. This approach is based on the observation that viewers are more inclined to watch Fox News when it’s assigned a lower channel number (Ash and Poyker Reference Ash and Poyker2023; Li and Martin Reference Li and Martin2022; Martin and Yurukoglu Reference Martin and Yurukoglu2017). However, once viewers become familiar with Fox News’ channel number, cease channel surfing, and start directly selecting Fox News, they are no longer the “compliers” in an IV analysis. Despite this shift, these studies remain insightful regarding the influence of Fox News on viewers who initially discovered the channel by chance, while follow-up observational studies can shed light on the impact of Fox News on its habitual audience.
Similarly, we pair our correlational evidence on the effects of habitual viewership with our better-identified effects of incidental viewership to suggest that Donald Trump was able to cultivate a politically relevant persona from his tenure on The Apprentice. By exposing “America’s Boss” to millions of Americans over many years, we believe his persona was transmitted into the public’s consciousness, providing Trump fertile ground for his 2016 election.
DISCUSSION
Donald Trump’s unprecedented electoral success has produced no shortage of scholarly explanations. Some work highlights the very predictable nature of the 2016 election (Dassonneville and Tien Reference Dassonneville and Tien2021), while others have attributed his rise to numerous specific factors, including white working-class economic anxieties (Porter Reference Porter2016); long-term economic deprivation (Gest, Reny, and Mayer Reference Gest, Reny and Mayer2018); exposure to greater trade competition (Ballard-Rosa, Jensen, and Scheve Reference Ballard-Rosa, Jensen and Scheve2021), attitudes surrounding race, ethnicity, and religion (Lajevardi and Abrajano Reference Lajevardi and Abrajano2019; Reny, Collingwood, and Valenzuela Reference Reny, Collingwood and Valenzuela2019; Sides, Tesler, and Vavreck Reference Sides, Tesler and Vavreck2019); and the status threat and cultural backlash felt by white voters in the face of growing domestic diversity and globalization (Inglehart and Norris Reference Inglehart and Norris2017; Mutz Reference Mutz2018). All of these factors contributed to Trump’s election, but our evidence suggests another: the consequences of entertainment media.
We argue that The Apprentice allowed Donald Trump to form parasocial bonds with his audience and, eventually, with his electorate. Using a pre-election survey of white voters, we show that regular viewers of the program were more likely to feel connected with Trump and reject negative information about him than other white respondents. They were also more likely to rely explicitly on aspects of his business mogul persona in describing their support for his campaign. Using the estimated effect of spillover ratings, we then show that exposure to The Apprentice fostered electoral support for Donald Trump in the 2016 Republican primary.
Granted, each piece of evidence alone is an imperfect test of our hypothesis: Nielsen’s ratings data back in 2004 is incomplete; the survey of white voters was conducted right before the general election, instead of the primary, and due to its sampling frame is unrepresentative of the electorate at-large; the open-ended responses are too sparse for more systematic text analysis; and the potential priming mechanism is speculative. Yet with all available data taken together, we interpret our findings as evidence that Donald Trump’s role as “America’s Boss” on The Apprentice provided him with the public credibility necessary to secure an advantage in the Republican nomination in 2016.
We find little evidence that The Apprentice increased campaign contributions to the Trump campaign or improved his performance in the general election, suggesting possible scope conditions for entertainment. Theses null effects in the general election likely reflect classic explanations of voting behavior—ranging from partisan identity to the state of the national economy. Yet in an electoral setting lacking partisan heuristics, where voters struggled to differentiate him ideologically (Eady and Loewen Reference Eady and Loewen2021), Trump, like all celebrity candidates, came with the natural advantage of built-in ties and familiarity with voters. To the extent that voters follow party cues regardless of who the candidate is for a presidential election, then the power of entertainment media to influence the nomination is all the more consequential.
Some have argued that Donald Trump’s unprecedented success was in many ways an anomaly, a reality TV star who stumbled his way into the White House. However, the use of entertainment media to propel political campaigns well predates Trump’s success. From 1954 to 1961, Ronald Reagan hosted General Electric Theater, which at its peak was viewed by over 25 million households per week. Using CBS signal strength as a proxy for viewership, Xiong (Reference Xiong2021) finds that exposure to this ostensibly apolitical programming increased Reagan’s electoral performance in the 1976 Republican primaries and to a lesser extent his gubernatorial and presidential general elections. In 1988, Salvatore “Sonny” Bono leveraged his fame to become mayor of Palm Springs, and later a member of Congress. Sean Duffy, once a cast member in a MTV reality show The Real World: Boston, has been serving as the U.S. Representative for Wisconsin’s seventh congressional district since 2011. From Jesse Ventura to Al Franken, from Arnold Schwarzenegger to Cynthia Nixon, entertainment has and continues to serve as an avenue for candidate emergence (Wright Reference Wright2019). These are not isolated incidents. As Knecht and Rosentrater (Reference Knecht and Rosentrater2021) show, there has been a steady increase in the number of celebrity candidates seeking elected office in the United States since the 1980s (see Appendix L of the Supplementary Material). Increasingly blurred boundaries between entertainment and politics mean that the actors from one space can easily enter and shape the other with increasing frequency (Lawrence and Boydstun Reference Lawrence and Boydstun2017).
Nor is this trend unique to American politics. Durante, Pinotti, and Tesei (Reference Durante, Pinotti and Tesei2019) leverage the staggered introduction of Silvio Berlusconi’s Mediaset all-entertainment television programming to show that it increased support for his party persistently over five elections. Jimmy Morales, who served as president of Guatemala (2016–2020), rose to fame starring in the comedy television program Moralejas; Marjan Sarec, who served as the Prime Minister of Slovenia (2018–2020), began as a political satirist and impressionist; twin brothers and child actors Jarosław and Lech Kaczyński would later co-found the Polish Law and Justice party and serve concurrently as President and Prime Minister of Poland, respectively; George Weah, often described as one of the greatest African football players of all time, served as the President of Liberia. Positions of celebrity in mass entertainment often serve as springboards to public office and political power around the globe.
What these celebrity politics portend for democracy, however, remains unclear. On the one hand, the influence of entertainment can foster and reinforce democratic norms. Long before Volodymyr Zelensky was elected as the president of Ukraine, his comedy show was watched by millions of viewers across countries previously colonized by the Soviet Union. His previous career is viewed as something that de-polarized the country in terms of language and forged a nationalist Ukrainian identity (Pisano Reference Pisano2022). He used entertainment to foster a new “capacious form of patriotism focusing on love for Ukraine,” without which “the country might not have unified” in the face of Russian invasion (Pisano Reference Pisano2023). Here, we can see the tremendous potential of entertainment—accepted without much resistance in an ostensibly apolitical context, these attitudes can make or break a democratic state.
Meanwhile, we see an important parallel between the increasing prevalence of populist celebrity candidates who campaign as “outsiders” and the rise in polarization, nativism, and the politics of othering (see also Durante, Pinotti, and Tesei Reference Durante, Pinotti and Tesei2019; Hameleers, Bos, and de Vreese Reference Hameleers, Bos and de Vreese2017; Lindstaedt Reference Lindstaedt2020). Relying on public support unmediated by traditional political institutions, these leaders can drive dramatic, heterodox shifts in mass opinion and public policy. For example, long the party of free trade, Trump’s protectionist platform (Bown and Irwin Reference Bown and Irwin2019) drove Republicans to adopt anti-free trade positions (Essig et al. Reference Essig, Ping, Garand and Keser2021). Trump’s trade war with China reportedly cost the U.S. economy nearly a quarter million jobs, not to mention a tremendous amount of uncertainty in the world of diplomacy (Pettis Reference Pettis2021).
Many keen observers of politics from Harold Lasswell to the thinkers of the Frankfurt School have long speculated that popular culture is political, significantly affecting how average citizens understand their political environment (Dorzweiler Reference Dorzweiler2017). However, the consumption of nonpolitical media has sparked debates more attuned to how voters make political decisions given limited information, rather than how entertainment media affects their political behaviors (Delli Carpini Reference Delli Carpini2014; Van Zoonen Reference Van Zoonen2005). American viewers have been tuning in nonetheless, with politics happening there all along.
SUPPLEMENTARY MATERIAL
To view supplementary material for this article, please visit https://doi.org/10.1017/S0003055424000728.
DATA AVAILABILITY STATEMENT
All data, except for proprietary Nielsen ratings data, that support the findings of this study are openly available at the American Political Science Review Dataverse: https://doi.org/10.7910/DVN/EWXQQH.
ACKNOWLEDGMENTS
We thank the excellent research assistance offered by Dylan Hanson, Suiyang Mai, Blake Mills, and Zaid Rami Sahawneh. We are thankful for feedback from the participants of RIPS seminar, 2021 EPOVB online seminar, 2021 LatinPolmeth, 2022 MPSA, and 2022 SPSA. We are particularly grateful to Josh Clinton for his encouragement and Heyu Xiong for the early-stage brainstorming and for generously sharing the survey data.
CONFLICT OF INTEREST
The authors declare no ethical issues or conflict of interest in this research.
ETHICAL STANDARDS
The authors affirm this research did not involve human participants, as all of the analyses relied on secondary (already-collected) data.


 Open access


Comments
No Comments have been published for this article.