1. INTRODUCTION
Laser matter interaction initiates different phenomena that are responsible for ablation from the surface of matter that causes a thermal spike, material ejects from the surface leading to generation of forwardly peaked plasma (Rai et al., Reference Rai, Shukla and Pant2000; Anwar et al., Reference Anwar, Latif, Iqbal, Rafique, Khaleeq-Ur-Rahman and Siddique2006; Doria et al., Reference Doria, Lorussoni, Belloni, Nassisi, Torrisi and Gammino2004; Laska et al., Reference Laska, Badziak, Gammino, Jungwirth, Kasperczuk, Krasa, Krousky, Kubes, Parys, Pfeifer, Pisarczyk, Rohlene, Rosinski, Ryc, Skala, Torrisi, Ullschmied, Velyhan and Wolowski2007; Reference Laska, Jungwirth, Kralikova, Krasa, Pfeifer, Rohlena, Skala, Ullschmied, Badziak, Parys, Wolowski, Woryna, Torrise, Gammino and Boody2004a; Reference Laska, Jungwirth, Krasa, Pfeifer, Rohlene, Ullcshmied, Badziak, Parys, Wolowski, Boody, Gammino and Torrisi2004b; Reference Laska, Jungwirth, Krasa, Pfeifer, Rohlene, Ullschmied, Badziak, Parys, Wolowski, Gammino, Torrisi and Boody2005; Reference Laska, Jungwirth, Krasa, Krousky, Pfeifer, Rohlene, Ullschmied, Badziak, Parys, Wolowski, Torrisi, Gammino and Boody2006a; Reference Laska, Jungwirth, Krasa, Krousky, Pfeifer, Rohlena, Skala, Ullschmied, Velyhan, Kubes, Badziak, Parys, Rosinski, Ryc and Wolowski2006b; Torrisi Reference Torrisi, Margarone, Gammino and Ando2007; Schaumann et al., Reference Schaumann, Schollmeier, Rodriguez-prieto, Blazevic, Brambrink, Geissel, Korostiy, Pirzadeh, Roth, Rosmej, Faenov, Pikuz, Tsigutkin, Maron, Tahir and Hoffmann2005; Jungwirth, Reference Jungwirth2005). The Coulombian acceleration in plasma generates high fluxes of energetic and highly charged anisotropic ions (Rai et al., Reference Rai, Shukla and Pant2000; Anwar et al., Reference Anwar, Latif, Iqbal, Rafique, Khaleeq-Ur-Rahman and Siddique2006; Laska et al., Reference Laska, Badziak, Gammino, Jungwirth, Kasperczuk, Krasa, Krousky, Kubes, Parys, Pfeifer, Pisarczyk, Rohlene, Rosinski, Ryc, Skala, Torrisi, Ullschmied, Velyhan and Wolowski2007; Reference Laska, Jungwirth, Krasa, Krousky, Pfeifer, Rohlena, Velyhan, Ullscmied, Gammino, Torrisi, Badziak, Payys, Rosinski, Ryc and Wolowski2008; Torrisi, Reference Torrisi, Margarone, Gammino and Ando2007; Caridi et al., Reference Caridi, Torrisi, Margarone and Borrielli2008; Malka, 2002; Borghesi et al., Reference Borghesi, Audebert, Bulanov, Cowan, Fuchs, Gauthier, Mackinnon, Patel, Pretzler, Romagnani, Schiavi, Toncian and Willi2005; Roth et al., Reference Roth, Brambrink, Audebert, Blazevic, Clarke, Cobble, Cowan, Fernendez, Fuchs, Geissel, Habs, Hegelich, Karsch, Ledingham, Neely, Ruhl, Schlegel and Schreiber2005; Brambrink et al., Reference Brambrink, Roth, Blazevic and Schlegel2006).
The kinetic energy and charge states of ions depend upon properties of the incident laser beam and that of the irradiated material (Laska et al., Reference Laska, Jungwirth, Krasa, Krousky, Pfeifer, Rohlena, Velyhan, Ullscmied, Gammino, Torrisi, Badziak, Payys, Rosinski, Ryc and Wolowski2008; Krunshelnik et al., Reference Krushelnik, Clark, Beg, Dangor, Najmudin, Norreys, Wei and Zepf2005; Chrisey & Hubler, Reference Chrisey and Hubler1994; Fisher et al., Reference Fisher, Fraenkel, Zinamon, Henis, Moshe, Horovitz, Luzon, Maman and Eliezer2005; Reference Fisher, Henis, Eliezer and Meyer-ter-Vehn2006). Laser energy, fluence, pulse width and focal spot influence the characteristics of emitted ions (Laska et al., Reference Laska, Badziak, Gammino, Jungwirth, Kasperczuk, Krasa, Krousky, Kubes, Parys, Pfeifer, Pisarczyk, Rohlene, Rosinski, Ryc, Skala, Torrisi, Ullschmied, Velyhan and Wolowski2007; Caridi et al., Reference Caridi, Torrisi, Margarone and Borrielli2008; Laska et al., Reference Laska, Jungwirth, Krasa, Krousky, Pfeifer, Rohlena, Velyhan, Ullscmied, Gammino, Torrisi, Badziak, Payys, Rosinski, Ryc and Wolowski2008). The focus position determines the intensity of laser beam (Laska et al., Reference Laska, Badziak, Gammino, Jungwirth, Kasperczuk, Krasa, Krousky, Kubes, Parys, Pfeifer, Pisarczyk, Rohlene, Rosinski, Ryc, Skala, Torrisi, Ullschmied, Velyhan and Wolowski2007; Reference Laska, Jungwirth, Krasa, Krousky, Pfeifer, Rohlena, Velyhan, Ullscmied, Gammino, Torrisi, Badziak, Payys, Rosinski, Ryc and Wolowski2008; Reference Laska, Jungwirth, Kralikova, Krasa, Pfeifer, Rohlena, Skala, Ullschmied, Badziak, Parys, Wolowski, Woryna, Torrise, Gammino and Boody2004a). These ions can be further accelerated by externally applied, strong electric field hence forming a device which generates high energy ion beams namely, “laser driven ion accelerator” (Torrisi et al., Reference Torrisi, Margarone, Caridi, Borrielli and Gammino2008).
The applications of a laser driven ion accelerator include the material processing by multi-energetic ion implantations. The properties of materials which can be altered by high energy ion beams are the chemical and electrical conductivity, mechanical and chemical resistance, hardness and wear. The semiconductor parameters can also be altered by ion implantation technique (Torrisi et al., Reference Torrisi, Margarone, Caridi, Borrielli and Gammino2008; Giuffrida et al., Reference Giuffrida and Torrisi2011; Zhu, 2011; Manova et al., Reference Manova, Gerlach, Neumann, Assmann and Mandl2006). Intense particle beams are used in material modification (Xin et al., Reference Xin, Zhu and Lei2010; Krasa et al., 2009; Li et al., Reference Li, Liu, Cheng, Xu, Ge and Wen2009; Renk et al., Reference Renk, Mann and Torres2008; Stasic et al., Reference Stasic, Gakovic, Krmpot, Pavlovic, Trtica and Jelenkovic2009).
In this research work, the Nd:YAG laser system with, 10 mJ energy, 1064 nm wavelength, and 12 ns pulse width, has been used to generate laser induced plasma ions. A DC high voltage acceleration assembly has been employed. A well-known Thomson parabola technique using SSNTD (CR-39) was employed to extract the ion energy for the applied potential (Springham et al., Reference Springham, Lee and Rafique2000; Rafique et al., Reference Rafique, Khaleeq-ur-Rahman, Siraj and Khan2007). In the next step, Al substrates were irradiated by accelerated ions at different energies. Irradiated surfaces were analyzed by optical microscope, scanning electron microscope, and atomic force microscope. Furthermore, TRIM analyses of total displacements, target vacancies and replacement collisions were performed to have the idea about the damages produced by the ions.
2. EXPERIMENTAL
The purpose of this research work was to fabricate a “laser driven ion accelerator.” The Nd: YAG laser system (1064 nm wavelength, 10 mJ energy, and 12 ns pulse width) was used to generate plasma. The ions emitted from this plasma were accelerated by an externally applied potential to generate a strong electric field (Doria et al., Reference Doria, Lorussoni, Belloni, Nassisi, Torrisi and Gammino2004; Ogawa et al., Reference Ogawa, Yoshida, Nakajima, Hasegawa, Fukata, Horioka and Oguri2003), using a high voltage DC supply (0–30 kV). The external electric field was applied with the help of an acceleration assembly which will be discussed in detail later. The experiment was performed under vacuum (~10−3 Torr).
Figure 1a shows the schematic of the acceleration setup. The laser beam was focused on Al target to generate plasma. Laser beam spot corresponding to 22 cm focal length of the lens was calculated to be 18.62 µm. The laser power density was about 1010 W/cm2. It has been found in literature that, at laser intensity of 1010 W/cm2, 62 keV ions have been generated by using external acceleration potential (Giuffrida & Torrisi, Reference Giuffrida and Torrisi2011). The power density used in this experiment is greater than its threshold value for ion emission which is 108–109 W/cm2 (Ogawa et al., Reference Ogawa, Yoshida, Nakajima, Hasegawa, Fukata, Horioka and Oguri2003; Laska et al., Reference Laska, Badziak, Gammino, Jungwirth, Kasperczuk, Krasa, Krousky, Kubes, Parys, Pfeifer, Pisarczyk, Rohlene, Rosinski, Ryc, Skala, Torrisi, Ullschmied, Velyhan and Wolowski2007; Reference Laska, Jungwirth, Krasa, Krousky, Pfeifer, Rohlena, Velyhan, Ullscmied, Gammino, Torrisi, Badziak, Payys, Rosinski, Ryc and Wolowski2008; Torrisi et al., Reference Torrisi, Ando, Gammino, Krasa and Laska2001; Margarone et al., Reference Margarone, Torrisi, Gammino, Krasa, Krousky, Laska, Pfeifer, Rohlena, Skala, Ullschmied, Velyhan, Parys, Rosinski, Ryc and Wolowski2006). An external electric field was applied to these ions by using an acceleration assembly. This assembly (Fig. 1a) comprised of an extraction box/chamber (EB) and ground electrodes (2.5 cm away from EB). The target (placed inside EB) was kept at positive potential with respect to the ground electrodes. The externally applied potential was increased from 2–10 kV with a step size of 2 kV. As a result, ions were accelerated, along their direction of propagation. The ions accelerated by the externally applied potential were then made to pass through the magnetic field induced by placing permanent magnets (0.01 T) 2 cm away from the ground electrodes as shown by Figure 1a. Two ion streaks are shown in Figure 1a, ions are deflected by the magnetic field according to their charge states. The central one is taken as so-called neutrals; the deflected ions are taken as single charged ions. The deflection values depend on energy of ions. Slower ions shall be deflected to larger distances in comparison with fast ions. Tracks were formed at the surface of CR-39 by these ions. These tracks of deflected ions were etched (6N solution of NaOH) and then observed by optical microscope and were used for ion energy measurements (Springham et al., Reference Springham, Lee and Rafique2000). Figure 1b is a diagram for the Thomson parabola technique, the associated parameters are shown. For ion energy, E = e 2B 2R 2/2 M J was used where, R 2 = a[x + (x 2 + 1)1/2] is the radius of curvature of ion trajectory in magnetic field, and x = L/d. Here “a (1 cm)” is radius of magnetic field region, “L(16 cm)” is the distance from center of magnetic field region to CR-39 substrate, “d” is the displacement of ion track on the CR-39 surface obtained by the optical microscope (Springham et al., Reference Springham, Lee and Rafique2000; Rafique et al., Reference Rafique, Khaleeq-ur-Rahman, Siraj and Khan2007). Increase in acceleration potential resulted in reduced displacement between the so-called neutrals and the ions. The corresponding vales of d in response to applied potential are given in Table 1. In order to explore the high energy ion implantation, another setup was designed to irradiate the samples with these energetic ions.
(Color online) (a) A schematic of ion acceleration setup. (b) Parameters involved in Thomson Parabola Technique.

The acceleration potentials, corresponding values of ion track displacements and the resulting in energies
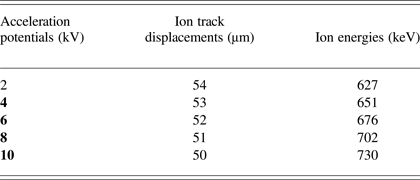
Figure 2 shows a schematic of the ion irradiation setup. The substrates were kept 2 cm away from the ground electrodes to irradiate a well collimated beam at the surface. Five hundred laser shots were used to generate ions at 2 kV, 4 kV, 6 kV, 8 kV, and 10 kV acceleration potentials. The irradiated samples were analyzed by optical microscope and atomic force microscope. A TRIM simulation for a “detailed calculation with full damage cascades” was performed to gather information about the damage produced by energetic ions in the substrate material. The angle of incidence of ions for simulation is considered as 0°. The depth of substrate is an important parameter to calculate the range of ions. For current TRIM calculations a layer depth of 1.5 µm was chosen.
(Color online) A schematic of ion irradiation setup.
3. RESULTS AND DISCUSSIONS
This section comprises of results for ion energy measurements at increasing acceleration potential obtained by Thomson parabola technique and micrographs of Al substrates irradiated by accelerated ions at different energies.
3.1. Ion Energy Measurements
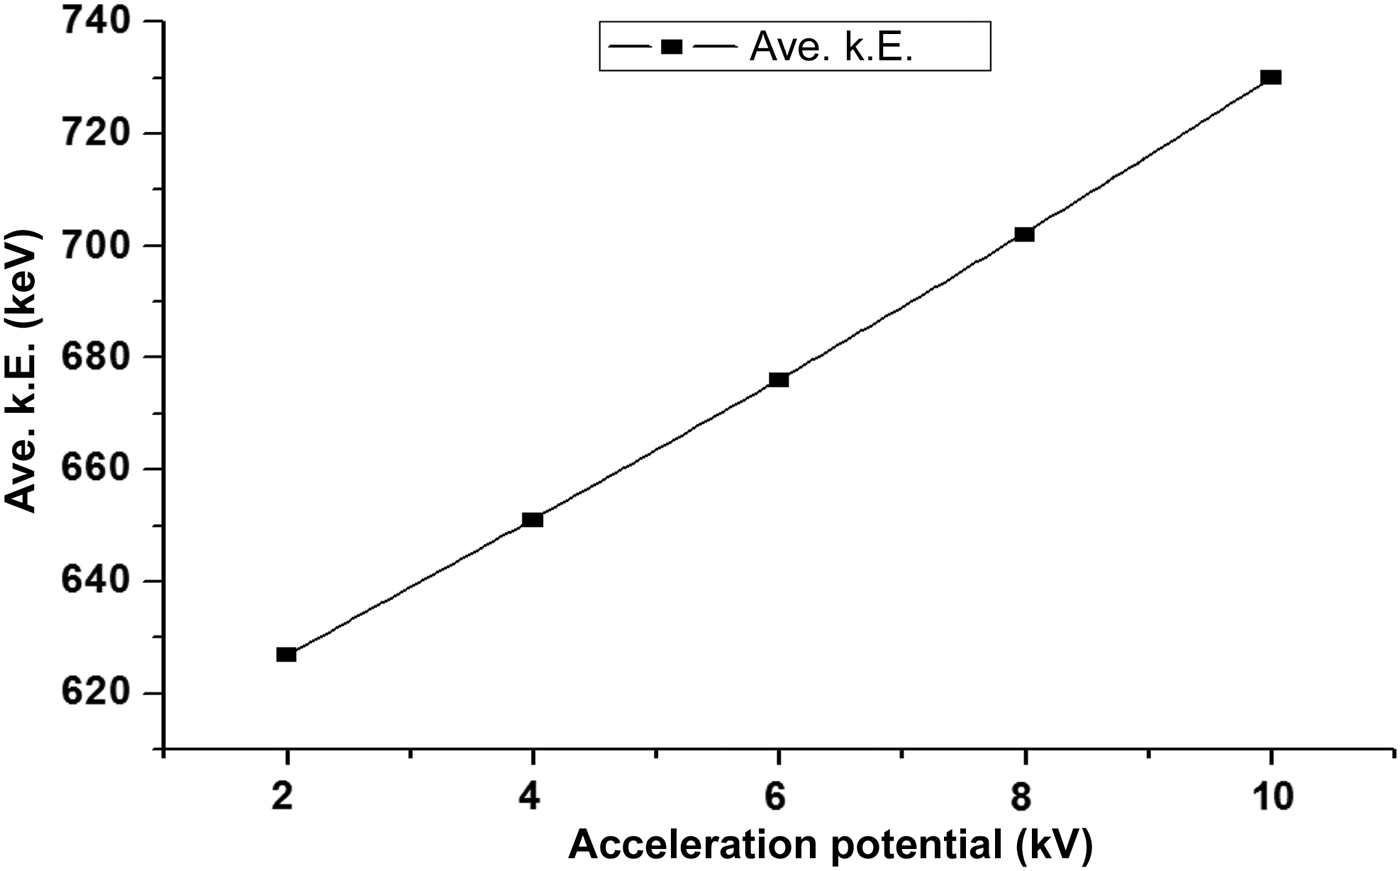
Ion energy measurements were performed by using the Thomson parabola technique. Figure 3 shows the graphical representation of the increase in the average kinetic energy of ions with an increase in the acceleration potential. The ion energies obtained by this method were, 627 keV, 651 keV, 676 keV, and 702 keV, 730 keV in response to the acceleration potentials; 2 kV, 4 kV, 6 kV, 8 kV, and 10 kV, respectively. There is an overall increase in the average kinetic energy of ions (Fig. 3) with the increasing acceleration potentials.
Graphical representation of the increase in energy with increasing acceleration potential.
Plasma is an ionized state; it can be defined as hot electrons and ions. Ions are emitted from the plasma due to space charge effect. There are three phenomena involved in ion acceleration from plasma, thermal interactions, adiabatic expansion of plasma in vacuum, and the coulomb interactions. When an external field is applied on laser induced plasma there are two possible ways in which plasma will be affected. First, the charged species experiences the effects of external electric field according to its polarity. Second, if the target is at high potential, the phenomena occurring in the process of plasma generation and propagation will change altogether. The electric fields in the plasma are bound to be altered in both cases. Applying a positive potential to the metallic target is expected to increase collisions between the plasma species hence increasing number density of the charged particles causing a strong acceleration. Positive biasing of the metallic target can increase ion energy and directivity (Torrisi et al., Reference Torrisi, Margarone, Caridi, Borrielli and Gammino2008). There is evidence of significant variations in plasma emission spectral lines due to change in recombination and collisional processes in response to the externally applied electric field (Park et al., Reference Park, Nam and Park2007; Elhassan et al., Reference Elhassan, Abd Elmoniem and Kassem2010). Increase in ions energy with an increase in acceleration potential is reported by Yeates et al. (Reference Yeates, Costello and Kennedy2010) with the expression of zev, where z is the charge state, e is ion's charge, and v is the ion velocity. In this case, the laser produced ions are delivered to an extraction system with HV electrodes. Surely, the same effect of externally applied electric field cannot be expected from a system that incorporates an acceleration assembly with the target at positive HV potential. Wolowski et al. (2002) has applied a −5 kV potential to the target. This arrangement decelerated ions up to 40%. It can be expected that applying a positive potential to the target would accelerate laser produced ions by more than just 2–3 keV in response to 2 kV increase in acceleration potential. Application of HV to the target will impart effects on the laser produced plasma in an unpredictable way as is the behavior of laser induced plasma. Hence, this phenomenon is still under discussion and yet to be resolved.
3.2. Analyses of Ion Implanted Al Substrates with Varying Ion Energies
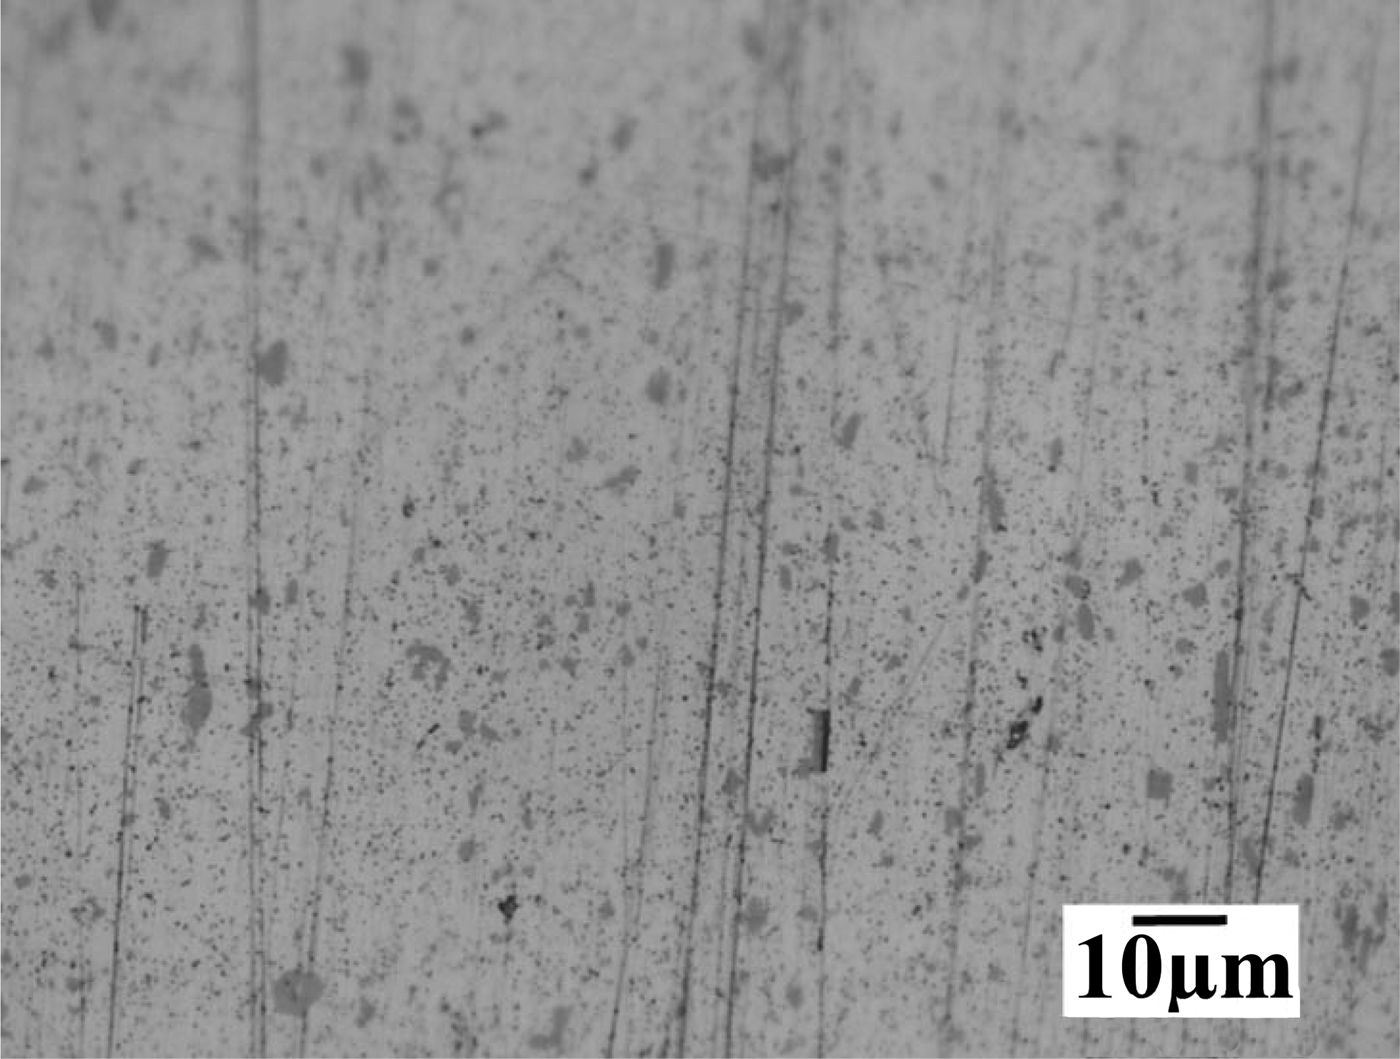
Al substrates were irradiated by Al ions generated by 500 laser shots with energies; 627 keV, 651 keV, 676 keV and 702 keV, 730 keV. The ion implanted Al substrates were analyzed by optical microscope and by atomic force microscope for topography of the irradiated surface. A binary collision approximation simulation namely TRIM was performed to understand the physical phenomena and the type of damage in response to the ion irradiation energies. In a Filippov-type plasma focus device, Al anodes are used because they are changeable after they experience degradation due to its interaction with energetic particles (Roshan et al., Reference Roshan, Rawat, Babazadeh, Emami, Sadat Kiai, Verma, Lin, Talebitaher, Lee and Springham2008). Al and its alloys are the metals being used mostly these days. Al is being used in production of pipes, rods and plates other than wires, foils, painting masses and in production of mirrors for ultraviolet, visible and infrared radiation (mirrors for full sky cameras, space glass, mirrors of projectors, thermo vision cameras) (Bartl & Baranek, Reference Bartl and Baranek2004). The energetic ion irradiation of Al surface can melt the top few micro-meters. A quick temperature rise can be of a few thousand degrees, so the Al surface is restructured and reformed during melting. It results in a decrease in micro-hardness of Al surface (Torrisi et al., Reference Torrisi, Ando, Gammino, Krasa and Laska2001). Figure 4 shows the optical micro-graphs of unexposed Al surface. There are some scratches due to the mechanical polishing at the surface. Figure 5 shows the Al surface irradiated with 627 keV ions, (a) optical micrograph, (b) three-dimensional (3D) AFM image, (c) ion range from TRIM simulation, and (d) is TRIM 3-D target damage plot. Surface damage is observable in the optical micrograph (Fig. 5a). The damaged zone has been marked which comprises of a few craters and small holes at the surface.
Optical micrographs of unexposed Al substrate at 1000× magnification.
(Color online) Al surface irradiated with 627 keV ions. (a) Optical micrographs at ×1000 magnification (b) 3D AFM image, (c) TRIM simulation for ion range, and (d) TRIM total damage plot.
When ions are bombarded on a substrate, they collide with the surface atoms transferring large amount of energy to the surface (Foti, Reference Foti2001). An energetic ion can collide with several atoms before coming to rest. In this process, the atoms in the path of an ion are displaced and energized resulting in a cascade collisional process, which is responsible for the sputtering of the substrate atoms hence creating damage (Foti, Reference Foti2001; Janson, Reference Janson2003; Bhuyan et al., Reference Bhuyan, Favre, Valderrama, Avaria, Guzman, Chuaqui, Mitchell, Wybdham, Saavedra and Paulraj2007). This damage inducing process is defined by two types of collisions between the impinging ions with the substrate atoms. These two types are nuclear and electronic collisions (Janson, Reference Janson2003; Ogawa et al., Reference Ogawa, Yoshida, Nakajima, Hasegawa, Fukata, Horioka and Oguri2003). Due to these collisions, occurring up to certain depth in the substrate material, the thermal effects range in depth is greater than the ion ranges (Ogawa et al., Reference Ogawa, Yoshida, Nakajima, Hasegawa, Fukata, Horioka and Oguri2003). The ion irradiation can also change the structural properties of the substrates (Janson, Reference Janson2003).
In a nuclear (elastic) collision, the incident ion interacts with the nuclei of the substrate atom. This interaction results in the deflection of ion and it can displace the lattice atom. The outcome of this interaction depends on the energy of ion. The displaced atom (primary recoil) can then initiate cascade collisions (Janson, Reference Janson2003; Moller, Reference Moller2004; Ziegler et al., Reference Zeigler, Biersack and Ziegler2008; Correa et al., Reference Correa, Kohanoff, Artacho, Portal and Caro2012; Averback et al., Reference Averback, Diaz de la Rubia, Ehrenreich and Spaepen1997; Satpati et al., Reference Satpati, Goswami, Vaishnav, Som, Dev and Satyam2003). The cascades and sub-cascades can result in a thermal spike. This could generate heat and cause melting and evaporation in substrates (Bringa et al., Reference Bringa and Johnson2002). Phonons can also be generated if the atom does not possess enough energy to move away from its lattice site and hops back into its original position (Ziegler et al., Reference Zeigler, Biersack and Ziegler2008). Nuclear collisions become dominant for ion energies of about 100 keV or below (Janson, Reference Janson2003; Ogawa et al., Reference Ogawa, Yoshida, Nakajima, Hasegawa, Fukata, Horioka and Oguri2003).
In an electronic (inelastic) collision or ionization, the incident ion interacts with the electrons of substrate atoms (Moller, Reference Moller2004; Janson, Reference Janson2003). The electrons gaining energy from this collision leave the atom and possess enough energy to induce electron phonon interaction. It results in heat production and it can also lead to thermal spike. The intense ionization along the path of ions can also lead to coulomb explosion. Electronic collisions become dominant for ion energies of about 1 MeV or above. For ion energies in between 100 keV and 1 MeV, a mixing of both nuclear and electronic collisions occurs (Correa et al., Reference Correa, Kohanoff, Artacho, Portal and Caro2012).
Energetic ions impinging a solid slow down by transferring their energy by elastic or in elastic collisions, ions loose energy until they reach the thermal energy of the substrate. At this point, the ion is considered to be stopped (Correa et al., Reference Correa, Kohanoff, Artacho, Portal and Caro2012; Ziegler et al., Reference Zeigler, Biersack and Ziegler2008). This ion can either become an interstitial or replacement atom (Ziegler et al., Reference Zeigler, Biersack and Ziegler2008). In case of a replacement, the lattice atom will become the interstitial. This is more probable if the ion is of the same material as the substrate. The interstitials induce mechanical tangential stresses in the substrate. By ion irradiations, material can be plastically deformed resulting in observable change in surface structure (Janson, Reference Janson2003; Krasa et al., Reference Krasa, Laska, Rohlena, Perine and Hnatowicz2002; Giuffrida & Torrisi, Reference Giuffrida and Torrisi2011). A vacancy is produced if the ion displaces an atom and still possesses the energy greater than the lattice energy of the substrate. Energetic ions can generate micro voids in the substrate, which can also produce stresses (Foti, Reference Foti2001).
The stress relaxation occurs in two ways namely, fast and slow. Fast relaxation occurs by the annihilation of point defects after ion interruption whereas, defect transformation, movement of dislocations, and crystal interface shift cause the slow stress relaxation after the irradiation (Janson, Reference Janson2003). The stress fields and shocks generated in the substrate can range two times higher than ions’ range in depth (Ogawa et al., Reference Ogawa, Yoshida, Nakajima, Hasegawa, Fukata, Horioka and Oguri2003) inducing damage. A crater at the ion irradiated Al surface can be observed from the 3D AFM image (Fig. 5b). A maximum height of 1.25 µm can be observed.
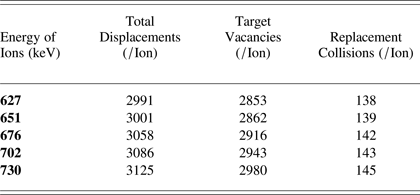
Figure 5c shows the TRIM simulation result for 627 keV ions range in Al substrate. The ion penetration and straggling of ions as well as substrate atoms (recoils) can be observed. Figure 5d shows the TRIM total damage calculations produced by 627 keV ions in depth of Al substrate. There are some limitations to TRIM simulation. TRIM takes every incoming ion at zero doses and does not consider the effects or damage of previously implanted ions which means it performs its calculation considering the surface to be smooth with no roughness (Ziegler, Reference Zeigler, Biersack and Ziegler2008). The highest peak reaches up to 0.09 displacements/ion-Å. The total displacements were 2991/ion, vacancies were 2853/ion and replacement collisions were 138/ion as calculated by TRIM (Fig. 5d). The straggling of ions and recoils can also be observed along the ion path in the substrate, this increase in the depth of damage. The straggling mainly occurs when the ion and recoil atom's energy has reduced due to nuclear collisions and deflections (Janson, Reference Janson2003; Moller, Reference Moller2004).
Figure 6 shows the Al surface irradiated with 651 keV ions, (a) optical micrograph, (b) 3D AFM image, (c) ion range from TRIM simulation, and (d) is TRIM 3D target damage plot. Surface damage is observable in the optical micrograph (Fig. 6a). Energetic metallic ion irradiation can cause sputtering of the substrate surface forming craters and a pattern of linearly arranged dots, at some places they might form a uniform pattern, or/and self-organized surface morphological structures. Surface segregation can also occur at the substrate surface (Krasa et al., Reference Krasa, Laska, Rohlena, Perine and Hnatowicz2002). This surface segregation and linearly arranged dots which can also be called ion chains are present in Figure 6a, which shows the optical micrograph of Al surface irradiated with 651 keV ions. Craters at the ion irradiated Al surface can be observed from the 3D AFM image (Fig. 6b). A maximum height of 2 µm can be observed. Figure 6c shows the TRIM simulation result for 651 keV ions range in Al substrate. The ion penetration and straggling of ions as well as substrate atoms (recoils) can be observed. Figure 6d shows the TRIM total damage calculations produced by 651 keV ions in depth of Al substrate. The highest peak reaches up to 0.09 displacements/ion-Å. The total displacements were 3001/ion, vacancies were 2862/ion and replacement collisions were 139/ion as calculated by TRIM (Fig. 6d). Ions can impinge on the substrate as a bunch which produces non-linear effects in the substrate material. In the form of a cluster, when ions interact with the atoms, it is possible for several ions to transfer their energy to the same atom.
(Color online) Al surface irradiated with 651 keV ions. (a) Optical micrographs at ×1000 magnification, (b) 3D AFM image, (c) TRIM simulation for ion range, and (d) TRIM total damage plot.
Figure 7 shows the Al surface irradiated with 676 keV ions, (a) optical micrograph, (b) 3-D AFM image, (c) ion range from TRIM simulation, and (d) is TRIM 3D target damage plot. The surface segregation and ion chains can be observed at the exposed surface due to irradiation of 676 keV ions as shown by the optical micrograph (Fig. 7a). The size of the holes and ion chains has increased which can be attributed to greater energy transfer of impinging ions to the surface and a deeper range of ions in the substrate. The ion chains observed in this case are longer and wider as compared to previous image.
(Color online) Al surface irradiated with 676 keV Al ions. (a) Optical micrographs at ×1000 magnification, (b) 3D AFM image, (c) TRIM simulation for ion range, and (d) TRIM total damage plot.
The 3D AFM image shows the topography of the damage induced by 676 keV ions. A crater can be observed, in response to acceleration potential of 6 kV, were observed to be deeper than at lower voltages and the height of damage has also increased to 2.4 µm. Damage has increased with increase in energy.
Figure 7d shows the 3D damage given by the TRIM simulation. The surface straggling has increased as compared to the straggling produced by lower energy ions. If compared with the previous 3D TRIM damage plot there is a slight longitudinal as well as lateral spread of damage in the substrate. The total displacements calculated by TRIM 676 keV ions were 3058/ion. The target vacancies were 2916/ion and replacement collisions were 142/ion as calculated by TRIM. Replacements also include the neighboring atoms replacing the primary recoils. The number of total displacements has increased with the ion energy as there is more damage due to higher energy of ions. The highest peak has also increased to a value, 0.1 displacements/ion-Å.
An intense pulsed ion beam when irradiated on a metal surface causes super-fast heating, melting and evaporation or ablation. It also produces holes, weaver on irradiated surface along with creating an amorphous state at the surface. Mass transfer or mixing occurs in the substrate, fast heating and cooling induces defects and generation and propagation of shock waves in irradiated regions. The input power transferred to the substrate is converted in to its internal energy (Ogawa et al., Reference Ogawa, Yoshida, Nakajima, Hasegawa, Fukata, Horioka and Oguri2003).
Figure 8 shows the Al surface irradiated with 702 keV ions, (a) optical micrograph, (b) 3D AFM image, (c) ion range from TRIM simulation, and (d) is TRIM 3D target damage plot. A damaged surface has been focused in the optical micrograph (Fig. 8a). The crater size has increased (encircled) with the spreading of damaged zone. Fast heating and cooling can reform the surface. The depth of damage induced by ion energy transfer is expected to have increased and the damaged surface is reshaped (Belloni et al., Reference Belloni, Doria, Lorusso and Nassisi2006).
(Color online) Al surface irradiated with 702 keV Al ions. (a) Optical micrographs at ×1000 magnification, (b) 3D AFM image, (c) TRIM simulation for ion range, and (d) TRIM total damage plot.
The AFM image shows the pattern formation at the Al surface along with small peaks in response to 702 keV ions irradiation. These patterns are more than 20 µm in length (range of the scanned area) and 3.2 µm of height can be observed (Fig. 8a). Figure 8c is the ion range of 702 keV Al ions in Al substrate, simulated by TRIM.
Figure 8d is the 3D TRIM damage plot for 702 keV ions. The damage is more slightly extensive and has more spread. The surface straggling at depth has increased even farther in this plot. The highest peak has although a reduced value, 0.08 displacements/ion-Å. This can be caused by a spread in ion energy transfer in the depth of irradiated substrates. The total displacements calculated by TRIM were 3086/ion. The target vacancies were 2943/ion and replacement collisions were 143/ion.
Figure 9 shows the Al surface irradiated with 730 keV ions, (a) optical micrograph, (b) 3D AFM image, (c) ion range from TRIM simulation, and (d) is TRIM 3D target damage plot. The extent of surface damage has increased for 730 keV ion irradiation (Fig. 9a). Ion implantation with high current density can induce changes in, lattice parameters and their types and orientation and dimensions of grains until amorphization (Giuffrida & Torrisi, Reference Giuffrida and Torrisi2011; Torrisi et al., Reference Torrisi, Ando, Gammino, Krasa and Laska2001).
(Color online) Al surface irradiated with 730 keV Al ions. (a) Optical micrographs at ×1000 magnification, (b) 3-D AFM image, (c) TRIM simulation for ion range, and (d) TRIM total damage plot.
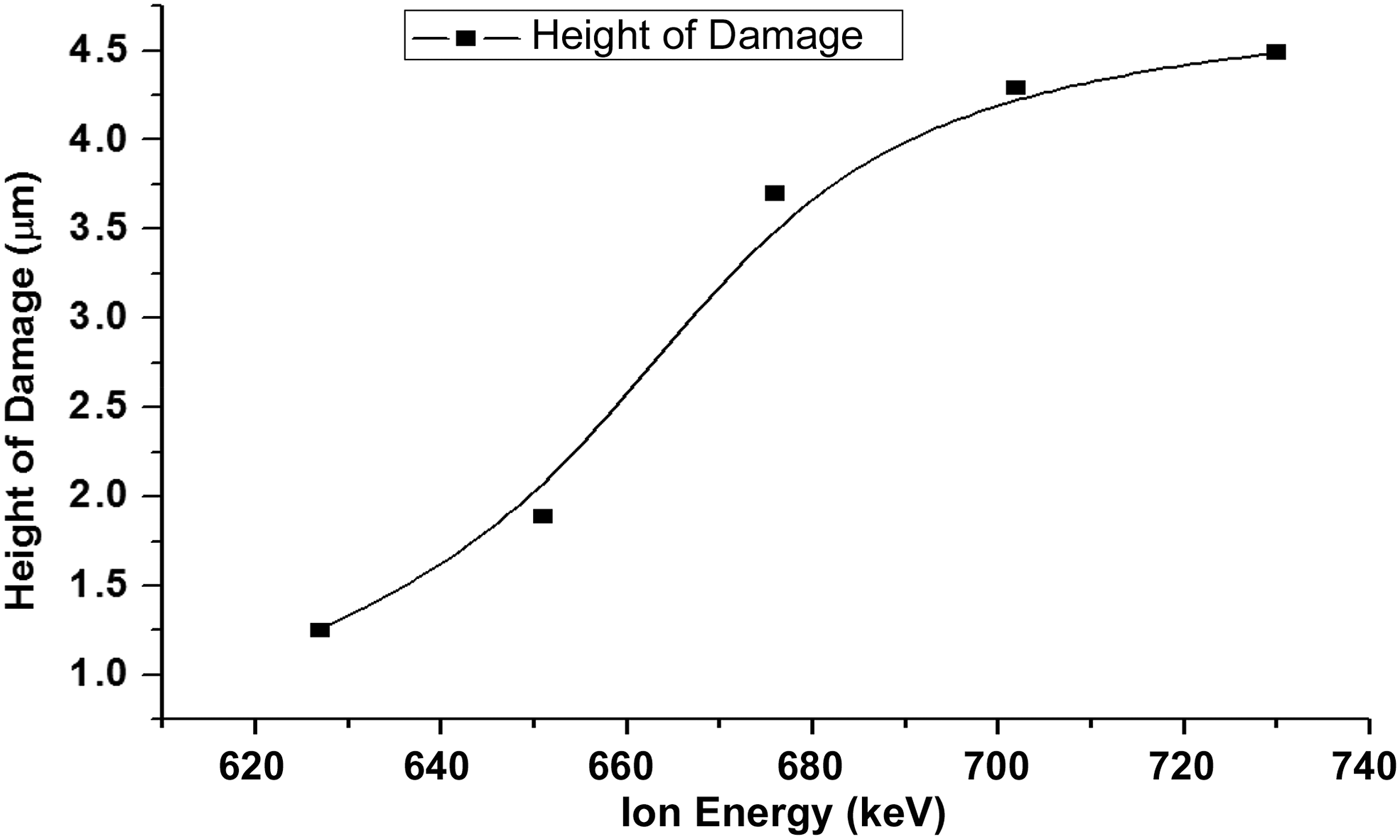
The AFM image (Fig. 9b) shows a more uniform pattern at the surface. The above micro-graph shows increased degree of damage at the surface of Al sample irradiated with 730 keV ions. The height of damage observed in the scanned region was 3.7 µm. Figure 10 shows the graph between ion energy and the height of damage at the irradiated surfaces. Figure 9c is the ion range of 730 keV into Al substrate as calculated by TRIM simulation.
Graphical representation of the increase in height of damage with increasing ion energy.
Figure 9d is the 3D TRIM damage plot for 730 keV ions. The height of the peak reaches 0.09 displacements/ion-Å. The total displacements calculated by TRIM were 3125/ion. Target vacancies were 2980/ion and replacement collisions were 145/ion as calculated by TRIM simulation.
Table 2 summarizes TRIM calculated values of total displacements, target phonons and replacement collisions per ion occurring as a result of incident ion implantations at 627 keV, 651 keV, 676 keV and 702 keV, 730 keV.
TRIM calculated values for total displacements, target vacancies and replacement collisions per ion for increasing ion energies
Figure 10 shows the graphical representation of the increase in height of damage with an increase in the ion energy. The surface damage is mainly produced by the displacements occurring at or near the surface. At higher energies the incident ion energy is being utilized in other phenomena like surface and sub-surface melting and evaporation.
Figure 11 shows the graphical representation of total displacements, target vacancies and replacement collisions per ion for increasing ion energies. The total displacements and target vacancies are close in number. It can be concluded that most of the displacements end up leaving a vacancy. The replacement collisions have much less values as compared to the other two parameters. This indicates that replacement collisions are less probable as compared to the vacancies and interstitial defects generation.
(Color online) Graphical representation of total displacements, target vacancies and replacement collisions per ion for increasing ion energies.
4. CONCLUSIONS
The laser produced ions were accelerated by externally applied potential. The extraction assembly employed in this research was able to accelerate and collimate the ions generated from laser induced plasma. A stepwise increase in the acceleration potential from 0–10 kV resulted in an increase in ions’ energy in the range 627–730 keV. Ion penetration depth, straggling and associated damages in Al substrates increased with energy of ions. Ion straggling was also observed to have increased with ion energy.