


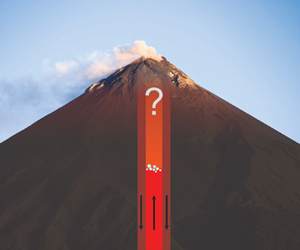

1. Introduction
Some of the most active volcanoes around the world are not primarily locations of magma eruption, but of gas exhaustion: they emit vast quantities of gas while erupting little magma (e.g. Shinohara Reference Shinohara2008). Examples include Erebus (Antarctica), Etna (Italy), Izu Oshima (Japan), Masaya (Nicaragua), Stromboli (Italy), Villarrica (Chile) and Yazur (Vanuatu) (Stoiber & Williams Reference Stoiber and Williams1986; Allard et al. Reference Allard, Carbonnelle, Métrich, Loyer and Zettwoog1994; Kazahaya, Shinohara & Saito Reference Kazahaya, Shinohara and Saito1994; Burton et al. Reference Burton, Oppenheimer, Horrocks and Francis2000; Kazahaya, Shinohara & Saito Reference Kazahaya, Shinohara and Saito2002; Aiuppa et al. Reference Aiuppa, Moretti, Federico, Giudice, Gurrieri, Liuzzo, Papale, Shinohara and Valenza2007; Palma et al. Reference Palma, Calder, Basualto, Blake and Rothery2008; Martin et al. Reference Martin2010; Oppenheimer et al. Reference Oppenheimer, Moretti, Kyle, Eschenbacher, Lowenstern, Hervig and Dunbar2011; Firth et al. Reference Firth, Handley, Cronin and Turner2014). While persistently active at the scale of centuries or millennia, persistently degassing volcanoes exhibit phases of active unrest that alternate with extended periods of relative quiescence. During quiescent phases, gas continues to escape the volcanic edifice passively unaccompanied by active, eruptive behaviour.
Passive gas fluxes can amount to several kilotonnes of volatiles released per day (Allard et al. Reference Allard, Carbonnelle, Métrich, Loyer and Zettwoog1994; Burton et al. Reference Burton, Oppenheimer, Horrocks and Francis2000; Kazahaya et al. Reference Kazahaya, Shinohara and Saito2002; Aiuppa et al. Reference Aiuppa, Moretti, Federico, Giudice, Gurrieri, Liuzzo, Papale, Shinohara and Valenza2007; Martin et al. Reference Martin2010). During passive gas emissions, the primary role of the magma in the conduit is to enable the transport of gas bubbles to the surface. Instead of erupting in the process, the magma returns back to depth degassed, having lost its buoyant cargo. The result is a buoyancy-driven exchange flow in the volcanic conduit with bubble-rich magma ascending and degassed magma descending. In vertical, or near-vertical, conduits, the flow assumes a core–annular geometry if there is a finite viscosity contrast between the gas-rich and the degassed magma (Francis, Oppenheimer & Stevenson Reference Francis, Oppenheimer and Stevenson1993; Kazahaya et al. Reference Kazahaya, Shinohara and Saito1994; Stevenson & Blake Reference Stevenson and Blake1998; Beckett et al. Reference Beckett, Mader, Phillips, Rust and Witham2011; Suckale et al. Reference Suckale, Qin, Picchi, Keller and Battiato2018). In this geometry, a core of buoyant, gas-rich fluid ascends in the centre of the conduit while the heavy, degassed magma descends along the conduit walls, forming an annulus around the core.
Exchange flow has been studied extensively, often in the context of water-lubricated transport of heavy viscous oils (e.g. Joseph & Renardy Reference Joseph and Renardy1992; Joseph et al. Reference Joseph, Bai, Chen and Renardy1997; Brauner Reference Brauner1998) assuming constant fluid density and viscosity. While a meaningful assumption in the context of lubricated pipelining and other engineering applications, magma transcends an enormous pressure range during its ascent through the volcanic plumbing system. The decreasing pressure translates into significant variability in both the density and the viscosity of the magma, because magma contains dissolved volatiles that exsolve upon depressurization (Wallace et al. Reference Wallace, Plank, Edmonds and Hauri2015). Volatile exsolution leads not only to bubble formation, adding buoyancy to the bubble-bearing magma, but also to crystal nucleation, thereby increasing the effective viscosity of the bubble- and crystal-bearing magma, as reviewed for basalts by Applegarth et al. (Reference Applegarth, Tuffen, James and Pinkerton2013).
The goal of this paper is to understand how core–annular flow responds to a sudden change in the density and viscosity of the core magma as a consequence of bubble nucleation. Most existing conduit-flow models describe the one-dimensional, vertical transport of a homogeneous mixture of magma and bubbles during an ongoing eruption (Sahagian Reference Sahagian2005), typically without specifying the physical process that initiated the eruption. Prominent examples of this approach include Conflow (Mastin & Ghiorso Reference Mastin and Ghiorso2000; Mastin Reference Mastin2002), TAK (Koyaguchi Reference Koyaguchi2005), CpiuC (Macedonio et al. Reference Macedonio, Neri, Martí and Folch2005) and Bubbleflow (Gonnermann & Manga Reference Gonnermann and Manga2003). Our study here complements these efforts by focusing on better understanding the processes that could disrupt the phases of passive degassing from which eruptions emerge. By clarifying how and why bubble nucleation affects the relatively steady flow field during passive degassing, we may gain insights into the various physical processes that could initiate an eruption.
One commonly invoked physical process, building on early analogue laboratory experiments by Jaupart & Vergniolle (Reference Jaupart and Vergniolle1988), is the regime transition from bubbly to slug and churn flow in two-phase flow, as reviewed by Sparks (Reference Sparks2003). In addition to being important in accounting for differences in explosive eruption intensity (Melnik Reference Melnik2000) and phreatomagmatic eruptions (Starostin, Barmin & Melnik Reference Starostin, Barmin and Melnik2005), recent laboratory experiments support the possibility that a regime transition from bubbly to slug flow could destabilize core–annular flow by disrupting the mass balance that is essential for stability (Qin et al. Reference Qin, Beckett, Rust and Suckale2021). Similarly, Fowler & Robinson (Reference Fowler and Robinson2018) showed that steady core–annular flow can only be maintained under a very specific set of conditions in the presence of regime transitions in two-phase flow. However, despite its relevance, two-phase flow is probably not the only process that could initiate eruptions at persistently degassing volcanoes.
Here, we hypothesize that bubble nucleation during phases of passive degassing can disrupt both the shallow and the deep portions of the plumbing system, even if the overall gas fraction remains small. Our hypothesis is motivated by the bistability of core–annular flow (Suckale et al. Reference Suckale, Qin, Picchi, Keller and Battiato2018): in thick-core flow, the speed on the interface separating core and annulus is consistently oriented downward, transporting information about the interface's response to volatile exsolution back down into the magma storage zone from where conduit flow is sourced. In thin-core flow, interfacial speed is more variable, spanning the full spectrum from downward oriented to stagnant and upward oriented, and can transport flow adjustments in both directions. We expect that thick-core flow might be particularly relevant for understanding the onset of eruptive sequences, because disruptions can not be released through the free surface. Instead, they are trapped in the deep portion of the conduit where they could build up until released eruptively.
Our model setup in figure 1 mimics the effect of a nucleation event in the volcanic conduit. Bubbles exist prior to this nucleation event, because carbon dioxide is significantly less soluble than other volcanic volatiles such as water (Javoy & Pineau Reference Javoy and Pineau1991; Dixon, Stolper & Holloway Reference Dixon, Stolper and Holloway1995; Dixon Reference Dixon1997; Papale Reference Papale1997, Reference Papale1999; Papale, Moretti & Barbato Reference Papale, Moretti and Barbato2006). Most of the initially dissolved carbon dioxide hence exsolves before the magma reaches the crustal magma chamber (Métrich & Wallace Reference Métrich and Wallace2008), creating a continual flux of bubbles into the conduit. As the magma ascends and pressure decreases, existing bubbles become increasingly water-rich, but laboratory experiments suggest that this diffusive bubble growth is likely accompanied by additional, distinct nucleation events (Le Gall & Pichavant Reference Le Gall and Pichavant2016a,Reference Le Gall and Pichavantb), as also supported by field evidence (Andronico et al. Reference Andronico2021).
Sketch of the core–annular flow geometry in a vertical conduit. Motivated by the volcanic context, we consider a sudden exsolution event in the upper conduit that leads to a step-wise decrease in the effective density (a) and a step-wise increase in the effective viscosity (b) of the core magma. Note that bubbles are not plotted to scale.

We model the response of core–annular flow to nucleation by formulating an evolution equation for the core thickness in a vertical conduit with depth-variable core density and viscosity using a lubrication approximation commonly used to study thin-film flow (Zhou et al. Reference Zhou, Dupuy, Bertozzi and Hosoi2005; Cook, Bertozzi & Hosoi Reference Cook, Bertozzi and Hosoi2008; Wang & Bertozzi Reference Wang and Bertozzi2014; Mirzaeian & Alba Reference Mirzaeian and Alba2018; Picchi, Suckale & Battiato Reference Picchi, Suckale and Battiato2020). We assume that the two magmas are immiscible. While not strictly true in the volcanic context, previous studies show that miscible fluids with low diffusivity behave similarly to immiscible fluids (Stevenson & Blake Reference Stevenson and Blake1998; Suckale et al. Reference Suckale, Qin, Picchi, Keller and Battiato2018). Our model applies as long as the model domain is much longer than wide and the Reynolds number remains low or intermediate. In this limit, the Navier–Stokes equation reduces to a hyperbolic problem for both the incompressible (Taghavi et al. Reference Taghavi, Seon, Martinez and Frigaard2009; Hasnain & Alba Reference Hasnain and Alba2017; Mirzaeian & Alba Reference Mirzaeian and Alba2018) and the compressible limits (Bresch & Desjardins Reference Bresch and Desjardins2006).
2. Methods
We derive a lubrication model to constrain how the core–annular interface responds to a sudden change in the density and viscosity of the core magma. Starting from the general Navier–Stokes equations for immiscible and compressible Newtonian fluids, we derive an asymptotic system of equations governing interface motion. Then, we derive the cross-sectional distribution of the vertical velocity and integrate the continuity equation to obtain a hyperbolic equation that approximates the interface motion for depth-dependent material properties. Table 1 summarizes all of the variables used in our model. We analyse our model through a combination of analytical techniques and numerical analysis using a high resolution total-variations-diminishing (TVD) method following Kurganov & Tadmor (Reference Kurganov and Tadmor2000). A verification of our numerical method is included in § 2.4 of the online supplement available at https://doi.org/10.1017/jfm.2022.346.
List of the dimensionless parameters and variables of the problem.

2.1. Governing equations
We study core–annular flow in a vertical conduit at exchange-flow conditions, as sketched in figure 1. The conduit has length  $\mathcal {L}$ and diameter
 $2R$, where
 $\mathcal {L} \gg R$. We take
 $z$ as the vertical direction and
 ${r}$ as the radial direction. The gas-rich magma in the core has radius
 $\delta$. The subscripts
 $c$ and
 $a$ identify the core and the annulus magma, respectively. The boundary conditions are no-slip and no-penetration at the vertical wall and continuity of velocity and shear stress at the core–annular interface.
The only driving force in the system is buoyancy. The core magma is buoyant with respect to the annulus primarily because it contains small gas bubbles. A rapid increase in the gas fraction at  $z=0$ leads to a decrease in the effective density and an increase in the effective viscosity of the core magma. We assume that the core magma is an homogeneous mixture of magma and small gas bubbles, which reduces the effect of the bubbles to decreasing the effective density,
 $\rho _c(z)$, and increasing the effective viscosity,
 $\mu _c(z)$, of the bubble-bearing magma. To simplify our terminology, we refer to
 $\rho _c(z)$ and
 $\mu _c(z)$ simply as core density and viscosity for the remainder of the manuscript, while keeping in mind that these are effective, phase-averaged material properties.
We emphasize that our model only applies in the limit of relatively small gas fractions, and hence small changes in core density, where a mixture approximation holds at least in an approximate sense. A large change in gas content and the segregated two-phase flow it entails would have dynamic consequences of its own, such as large bubbles forming and disrupting the flow balance, as discussed by Qin et al. (Reference Qin, Beckett, Rust and Suckale2021). We assume that the core viscosity is always lower than in the annulus viscosity, because the core magma is volatile-rich and warmer. We also assume that any potential changes in the properties of the annular magma are much smaller than in the core, because the annular magma represents return-flow of largely degassed magma.
The continuity equations in the two magmas are
 $$\begin{gather} \frac{\partial \rho_c}{\partial t}+ \boldsymbol{\nabla}\boldsymbol{\cdot}\left(\rho_c \boldsymbol{u}_c\right) = 0 , \quad r\in[0,\delta), \end{gather}$$
 $$\begin{gather}\boldsymbol{\nabla}\boldsymbol{\cdot}\boldsymbol{u}_a = 0 , \quad r\in(\delta,R], \end{gather}$$
where  $\boldsymbol {u}_i=(v_i,w_i,u_i)$ with
 $i \in \{a,c\}$ is the velocity vector such that
 $v_i$,
 $w_i$ and
 $u_i$ are the components in the
 $r$,
 $\theta$ and
 $z$ directions, respectively. The momentum equations for the two magmas are
 $$\begin{gather} \rho_c \frac{\mathrm{D} \boldsymbol{u}_c}{\mathrm{D} t}={-}\boldsymbol{\nabla} p_c + \boldsymbol{\nabla}\boldsymbol{\cdot} \left(2\mu_c \boldsymbol{\mathsf{S}}_c \right) -\frac{2}{3} \boldsymbol{\nabla}\left(\mu_c \boldsymbol{\nabla}\boldsymbol{\cdot}\boldsymbol{u}_c\right) +\rho_c \boldsymbol{g} , \end{gather}$$
 $$\begin{gather}\rho_a \frac{\mathrm{D} \boldsymbol{u}_a}{\mathrm{D} t} ={-}\boldsymbol{\nabla} p_a + \mu_a \nabla^2 \boldsymbol{u}_a+ \rho_a \boldsymbol{g} , \end{gather}$$
where  ${\mathrm {D} }/{\mathrm {D} t}$ is the material derivative, and
 $\boldsymbol {g}=-g \boldsymbol {k}$ the gravitational acceleration with
 $\boldsymbol {k}$ being the dimensionless unit vector in
 $z$. The index
 $i \in \{a,c\}$ identifies the pressure,
 $p_i$, the dynamic viscosity,
 $\mu _i$, and the density,
 $\rho _i$, in the respective magma. Since the density of the core varies due to volatile exsolution, the compressibility term only appears for the core magma in (2.2). Specifically, we neglect the coefficient of bulk viscosity, which we assume to be much smaller than the dynamic viscosity, so
 $\boldsymbol{\mathsf{S}}_c$ is the strain rate tensor.
We assume that the annulus magma has constant density and viscosity,  $\rho _a = \text {const.}$ and
 $\mu _a = \text {const.}$, while the density and viscosities of the core magma change in the vertical direction in a step-wise manner:
 $$\begin{gather} \rho_c\left(z\right) = \rho_0\left(1+\Delta_\rho \mathrm{H}\left(z\right) \right) , \end{gather}$$
 $$\begin{gather}\mu_c\left(z\right) = \mu_0\left(1+\Delta_\mu \mathrm{H}\left(z\right) \right) , \end{gather}$$
where  $\rho _0$ and
 $\mu _0$ are a constant reference density and viscosity, and
 $\mathrm {H}(z)$ is the Heaviside step function with
 $\mathrm {H}(z<0)=0$ and
 $\mathrm {H}(z>0)=1$. The coefficients,
 $\Delta _\rho$ and
 $\Delta _\mu$, specify the magnitudes and directions of the jumps in core density and viscosity, respectively. We assume that these jumps are significant in the sense that
 $\Delta _\rho,\Delta _\mu = O(1)$. The sign determines whether the respective material property is increasing or decreasing and the absolute value of the coefficient indicates the magnitude of change. We denote a decreasing core density by
 $\Delta _\rho <0$ and an increasing core viscosity by
 $\Delta _\mu >0$. With these profiles prescribed, an equation of state for the core magma is not necessary.
2.2. Dimensionless formulation
We proceed by assuming that the problem is axisymmetric such that  $w_i=0$ and
 $\partial /\partial \theta =0$. We introduce the following dimensionless quantities:
 \begin{equation} \hat{z}=\frac{z}{\mathcal{L}} , \quad \hat{r}=\frac{r}{R} , \quad \hat{\delta}=\frac{\delta}{R} , \quad \hat{t}=\frac{t}{\mathcal{L}/U} , \quad \hat{u}_i=\frac{u_i}{U}, \quad \hat{v}_i=\frac{v_i}{V} , \end{equation}
where  $U$,
 $V$,
 $R$ and
 $\mathcal {L}$ are the characteristic scales of the vertical velocity component, the horizontal velocity component, the radius and the vertical length. Volcanic conduits are much longer than wide, as captured in the scale parameter
 \begin{equation} \varepsilon=\frac{R}{\mathcal{L}} \ll 1. \end{equation}
For easier comparison, we choose the same scales for the vertical velocity and pressure as in Suckale et al. (Reference Suckale, Qin, Picchi, Keller and Battiato2018) and Picchi et al. (Reference Picchi, Suckale and Battiato2020),
 \begin{equation} U=\frac{\Delta \rho_0 g R^2}{\mu_a} ,\quad p_i=\frac{p_i}{\mu_a U \mathcal{L}/R^2} , \end{equation}
where  $\Delta \rho _0 = \rho _a- \rho _0$ is the density difference. Substituting (2.6) into the continuity equations (2.1) and matching the order, we get
 $V=\varepsilon U$. For simplicity, we will drop the hats for dimensionless variables from here.
The dimensionless continuity equations then become
 $$\begin{gather} (1+\Delta_\rho \mathrm{H}(z))\frac{1}{r}\frac{\partial \left(r v_c\right)}{\partial r}+\frac{\partial \left(1+\Delta_\rho \mathrm{H}(z)\right) u_c}{\partial z} = 0 \quad \text{and} \end{gather}$$
 $$\begin{gather}\frac{1}{r}\frac{\partial \left(r v_a\right)}{\partial r}+\frac{\partial u_a}{\partial z} = 0. \end{gather}$$
The dimensionless momentum equations in the radial and vertical directions for the core flow are
 \begin{align} \varepsilon \mathcal{R} Ar \frac{\mathrm{D} u_c}{\mathrm{D} t} & ={-}\frac{\partial p_c}{\partial z} + \frac{1+\Delta_\mu \mathrm{H}(z)}{M}\frac{1}{r}\frac{\partial}{\partial r}\left(r\frac{\partial u_c}{\partial r}\right)\nonumber\\ &\quad{}-\frac{\mathcal{R}\left(1+\Delta_\rho \mathrm{H}(z) \right)}{1- \mathcal{R}} + {O}(\varepsilon^2), \end{align}
 \begin{align} \varepsilon^3 \mathcal{R} Ar \frac{\mathrm{D} v_c}{\mathrm{D} t} & ={-}\frac{\partial p_c}{\partial r} + {O}(\varepsilon^2) , \end{align}
and for the annulus flow,
 $$\begin{gather} \varepsilon Ar \frac{\mathrm{D} u_a}{\mathrm{D} t} ={-}\frac{\partial p_a}{\partial z}+\varepsilon^2 \frac{\partial^2 u_a}{\partial z^2} +\frac{1}{r}\frac{\partial}{\partial r}\left(r\frac{\partial u_a}{\partial r}\right)-\frac{1}{1- \mathcal{R}} , \end{gather}$$
 $$\begin{gather}\varepsilon^3 Ar \frac{\mathrm{D} v_a}{\mathrm{D} t} ={-}\frac{\partial p_a}{\partial r} + \varepsilon^4 \frac{\partial^2 u_a}{\partial z^2} +\varepsilon^2 \left[\frac{1}{r}\frac{\partial }{\partial r}\left(r\frac{\partial v_c}{\partial r}\right)-\frac{v_c}{r^2}\right] , \end{gather}$$
where
 \begin{equation} \frac{\mathrm{D}}{\mathrm{D} t}=\frac{\partial}{\partial t}+v_i\frac{\partial}{\partial r}+u_i\frac{\partial}{\partial z} , \end{equation}
and
 \begin{equation} Ar=\frac{\rho_a \Delta \rho_0 g R^3}{\mu_a^2} , \quad \mathcal{R}=\frac{\rho_0 }{\rho_a} , \quad M=\frac{\mu_a}{\mu_0} , \end{equation}
are the Archimedes number, the density ratio and the viscosity ratio, respectively. The symbol  ${O}(\varepsilon ^2)$ represents higher-order terms. The boundary conditions are the no-slip condition at the conduit wall, the symmetry condition, the continuity of velocity and shear-stress (tangential and normal) at the core–annular interface, and the kinematic condition for the interface,
 $$\begin{gather} u_a=v_a=0 ,\quad {\rm at}\ r=1, \end{gather}$$
 $$\begin{gather}\frac{\partial u_c}{\partial r}=v_c=0 ,\quad {\rm at}\ r=0 , \end{gather}$$
 $$\begin{gather}(u_c,v_c)=(u_a,v_a) ,\quad {\rm at}\ r=\delta , \end{gather}$$
 $$\begin{gather}p_c-p_a={O}(\varepsilon^2) ,\quad {\rm at}\ r=\delta , \end{gather}$$
 $$\begin{gather}\left(1+\Delta_\mu \mathrm{H}(z) \right) \frac{\partial u_c}{\partial r}=M\frac{\partial u_a}{\partial r}+{O}(\varepsilon^2) ,\quad {\rm at}\ r=\delta , \end{gather}$$
 $$\begin{gather}v_i = \frac{\partial \delta}{\partial t}+u_i \frac{\partial \delta}{\partial z} ,\quad {\rm at} r=\delta , \end{gather}$$
where we neglect surface tension at the core–annular interface, because the two magmas are not strictly immiscible.
2.3. The lubrication model
Volcanic conduits are much longer than wide such that  $\varepsilon \ll 1$ and filled with magma of sufficient viscosity that
 $\varepsilon Ar \ll 1$. We now take the limit
 $\varepsilon \rightarrow 0$ and keep only leading order terms. In this limit, we derive an asymptotic approximation to the system (2.8)–(2.13) by dropping all the terms of orders
 ${O}(\varepsilon )$ and
 ${O}(\varepsilon Ar)$ or higher. We then obtain the one-dimensional set of momentum equations
 $$\begin{gather} \frac{\mathrm{d} p_c}{\mathrm{d} z} + \frac{\mathcal{R}\left(1+\Delta_\rho \mathrm{H}(z) \right)}{1- \mathcal{R}} = \frac{1+\Delta_\mu \mathrm{H}(z)}{M}\frac{1}{r}\frac{\partial}{\partial r}\left(r\frac{\partial u_c}{\partial r}\right) \quad \text{and} \end{gather}$$
 $$\begin{gather}\frac{\mathrm{d} p_a}{\mathrm{d} z}+\frac{1}{1- \mathcal{R}} = \frac{1}{r}\frac{\partial}{\partial r}\left(r\frac{\partial u_a}{\partial r}\right). \end{gather}$$
We integrate the one-dimensional governing equations, (2.14), twice at every horizontal cross-section and use the corresponding boundary conditions in (2.13) to solve for the integral constants. We obtain the following velocity profiles:
 $$\begin{gather} u_c(r,z,t) = \varphi\frac{P-\psi}{4}(r^2-\delta^2)+\frac{P}{4}(\delta^2-1)-\psi \frac{\delta^2}{2} \ln \delta, \end{gather}$$
 $$\begin{gather}u_a(r,z,t) = \frac{P}{4}(r^2-1)-\psi \frac{\delta^2}{2} \ln r, \end{gather}$$
where
 \begin{equation} P(z,t)=\frac{\mathrm{d}p}{\mathrm{d}z}+\frac{1}{1-\mathcal{R}},\quad \varphi(z)=\frac{M}{1+\Delta_\mu \mathrm{H}(z)},\quad \psi(z)=1-\frac{\mathcal{R}\Delta_\rho \mathrm{H}(z)}{1-\mathcal{R}}. \end{equation}
The parameter  $P$ is the driving force, including both the pressure gradient and the hydrostatic term, of the core magma. The parameter
 $\varphi$ can be interpreted as a modified viscosity contrast. It assumes values around the viscosity ratio,
 $M$, unless the core viscosity jump,
 $\Delta _\mu H(z)$, dominates in magnitude. Finally,
 $\psi$ represents a rescaling factor for the driving force,
 $P$, in the core magma in response to the density jump. We proceed to determine
 $P$ by deriving a generalized exchange-flow condition from the conservation of mass.
A jump in the core density induces jumps in both the driving force and the local flux. As derived in more detail in Appendix A, integrating the generalized exchange-flow condition (A6) vertically and assuming zero net flux at the bottom,  $z=-1/2$, gives
 \begin{equation} \int_0^\delta r u_c \,\mathrm{d} r +\int_\delta^1 r u_a \,\mathrm{d} r ={-}\frac{\Delta_\rho\mathrm{H}(z)}{2{\rm \pi}} Te\vert_{z\rightarrow 0^-} , \end{equation}
where we define the flux function as
 \begin{equation} Te :={-} 2{\rm \pi} \int_\delta^1 ru_a\,\mathrm{d} r. \end{equation}
Except for at the jump, we can eliminate the pressure gradient in (2.15) using the exchange-flow condition (2.17),
 \begin{equation} P=\frac{\psi\delta^2\left[2 \left(1 - \delta^2\right) + \delta^2 \varphi\right]-8\Delta_\rho \mathrm{H}(z) \left(Te\vert_{z\rightarrow 0^-}\right)/{\rm \pi} }{1 - \delta^4 + \delta^4 \varphi}. \end{equation}
Using (2.15) and (2.18)–(2.19), we obtain an expression for the flux
 $$\begin{gather} Te = \frac{{\rm \pi} \delta^4 \psi}{8} \left\{\frac{\left(\delta^2-1\right)\left[4 - \varphi + \delta^2 \left(3 \varphi-4 \right)\right]}{1 + \delta^4 \left(\varphi-1\right)} - 4 \ln \delta\right\}\nonumber\\ + \frac{\Delta_\rho \mathrm{H}(z) \left(Te\vert_{z\rightarrow 0^-}\right)\left(\delta^2-1\right)^2 }{1 + \delta^4 \left(\varphi-1\right)}. \end{gather}$$
The dimensionless flux in (2.20) consists of the main contribution in curly brackets and a correction term. The correction term is controlled by the magnitude of the density jump,  $\Delta _{\rho }$. In contrast, the main term is multiplied by the parameter
 $\psi$, highlighting its role as a rescaling factor for the driving force. It typically assumes values around unity, depending on the magnitude of the density jump. A reduction in the core density translates into a higher driving force, and, therefore, into a higher dimensionless flux. We note that, in case of uniform properties,
 $\Delta _\rho =0$ and
 $\Delta _\mu =0$,
 $\varphi =M$ and
 $\psi =1$, our (2.20) reduces to the same expression as in Suckale et al. (Reference Suckale, Qin, Picchi, Keller and Battiato2018).
To obtain an evolution equation for the core radius,  $\delta$, or equivalently the core volume fraction,
 $\alpha = \delta ^2$, we integrate the first equation in (2.8) in the radial direction once. Together with the first and last boundary conditions in (2.13), we obtain
 \begin{equation} \frac{\partial \delta^2}{\partial t}+\frac{\partial }{\partial z}\left(\frac{Te}{\rm \pi}\right)=\frac{\partial \alpha}{\partial t}+\frac{\partial }{\partial z}\left(\frac{Te}{\rm \pi}\right)=0, \end{equation}
where  $\alpha \in [0,1]$. With (2.21), we have formulated a solvable Riemann problem given the assumed profiles for the core properties. To specify the initial interface condition, we consider a physical situation where the system starts with a uniform interface assuming a uniform core radius
 $\delta$ (and, therefore, volume fraction
 $\alpha$) throughout the domain. At time zero, a nucleation event at
 $z=0$ decreases the core density and increases the viscosity in the upper domain abruptly. The boundary conditions at the lower and upper ends are stress free, i.e.
 $\partial \delta / \partial z = \partial \alpha / \partial z = 0$. We can then integrate the Riemann problem numerically to identify how the flow field adjusts to the depth-variable core properties.
2.4. Numerical method
We solve the conservation law (2.21) numerically with the high-resolution TVD scheme of Kurganov & Tadmor (Reference Kurganov and Tadmor2000) that is also applied by Mirzaeian & Alba (Reference Mirzaeian and Alba2018). We discretize (2.21) using finite volumes to get
 \begin{equation} \frac{\alpha_j^{n+1}-\alpha_j^{n}}{\Delta t}+\frac{F_{j+1/2}^{n}-F_{j-1/2}^{n}}{\Delta z}= 0, \end{equation}
and define a flux limiter  $(\alpha _z)^n_k$ chosen to be in the minmod class of the following form:
 \begin{equation} \left(\alpha_z\right)^n_k = \mathrm{minmod} \left(\frac{\alpha_k^n-\alpha_{k-1}^n}{\Delta z},\frac{\alpha_{k+1}^n-\alpha_{k}^n}{\Delta z}\right), \end{equation}
where the minmod function is defined as
 \begin{equation} \mathrm{minmod}(a,b)=\frac{1}{2}[\mathrm{sgn}(a) + \mathrm{sgn}(b)] \mathrm{min}(|a|, |b|). \end{equation}
The discrete flux function,  $F$, in (2.22) is
 $$\begin{gather} F_{j\pm 1/2}^{n} =
\frac{1}{2}\left[ Te(\alpha_{j\pm 1/2}^{R,n},z_{j\pm 1/2})\frac{1}{\rm \pi}+ Te(\alpha_{j\pm
1/2}^{L,n},z_{j\pm 1/2})\frac{1}{\rm \pi} \right.
\nonumber\\ \left. - a_{j\pm 1/2}^n (\alpha_{j\pm
1/2}^{R,n}-\alpha_{j\pm
1/2}^{L,n})\vphantom{\frac{1}{\rm \pi}}\right] ,
\end{gather}$$
where
 \begin{align} \left.\begin{aligned}
\alpha_{j+1/2}^{R,n} & = \alpha_{j+1}^n - \frac{\Delta
z}{2}\left( \alpha_z\right)^n_{j+1},\\
\alpha_{j+1/2}^{L,n} & = \alpha_{j}^n + \frac{\Delta
z}{2}\left( \alpha_z\right)^n_{j}, \\ \alpha_{j-1/2}^{R,n}
& = \alpha_{j}^n - \frac{\Delta z}{2}\left(
\alpha_z\right)^n_{j}, \\ \alpha_{j-1/2}^{L,n} & =
\alpha_{j-1}^n + \frac{\Delta z}{2}\left(
\alpha_z\right)^n_{j-1}. \end{aligned} \right\}
\end{align}
Since the flux-function derivative represents the local propagation speed of the wave (LeVeque Reference LeVeque2002), we obtain
 \begin{equation} a_{j\pm 1/2}^n = \max \left(\left|\frac{\partial Te}{\partial \alpha}\right|_{\alpha_{j\pm 1/2}^{R,n}},\left|\frac{\partial Te}{\partial \alpha}\right|_{\alpha_{j\pm 1/2}^{L,n}}\right)\frac{1}{\rm \pi} \end{equation}
for the local propagation speed of the interfacial wave.
We calculate the stable time step,  $\mathrm {d} t$, using a Courant–Friedrichs–Lewy (CFL) condition as
 \begin{equation} \mathrm{d} t = \frac{\mathrm{CFL} \, \mathrm{d} z}{\max(|a(t)|)}. \end{equation}
For our simulations, we use  $\mathrm {CFL} \approx 0.1$ and our test simulations with different CFL numbers show that this choice gives satisfying stability and accuracy.
We apply different initial conditions of constant  $\alpha$, or equivalently constant
 $\delta$, along
 $z$, with different
 $\Delta _\rho$ and
 $\Delta _\mu$ in the upper conduit domain. We use zero-order extrapolation outflow boundary conditions (LeVeque Reference LeVeque2002) on both sides,
 \begin{equation} \alpha_{{-}1} = \alpha_0 = \alpha_1,\quad \alpha_{N+2}=\alpha_{N+1}=\alpha_N. \end{equation}
To avoid spurious interactions with the boundaries, we terminate the simulation once the wave fronts have travelled  $2/5$ of the domain in either direction.
3. Results
3.1. Changes in core density or viscosity modify the flux function in different ways
Even in the absence of depth variability in the core density or viscosity, the flux function associated with the conservation law (2.21) is not universally convex. As shown in figure 2(a), the flux function is concave between the two inflection points,  $\delta _{I1}$ and
 $\delta _{I2}$, and convex elsewhere. It has a global maximum at
 $\delta _{FP}$ in the concave domain, which we refer to as the flooding point. The nonconvexity of the flux function is important, because it implies that the kinematic wave speed given by the derivative of the flux function,
 ${\partial Te}/{\partial \alpha }$, is non-monotonic (e.g. LeVeque Reference LeVeque2002). The speed at which disruptions propagate along the interface can hence either increase or decrease with the dimensionless core thickness.
Nonconvexity of the flux function and associated variability in its derivative imply four ranges of  $\delta$ with different associated wave behaviours. (a) Flux function
 $Te$ with
 $\mathcal {R}=0.95$ and
 $M=100$. The blue diamond and red triangle indicate the flux for the two steady-state solutions shown in panel (c). (b) Derivative of the flux function with respect to the volume fraction
 $\alpha$. The dashed and dash-dotted lines indicate the flooding point
 $\delta _{FP}$ and two inflection points
 $\delta _{I1}$,
 $\delta _{I2}$, respectively. (c) Vertical ascent speed in the radial direction for thin-core flow (blue) as compared to thick-core flow (red). The two solutions refer to the same total flux of
 $Te\approx 0.06$, highlighted in panel (a) as a dotted line.

Figure 2(b) shows the derivative of flux with respect to the core volume fraction  $\alpha$, which represents the kinematic wave speed: the inflection points,
 $\delta _{I1}$ and
 $\delta _{I2}$, correspond to the maximum and minimum wave speed, while at the flooding point,
 $\delta _{FP}$, the flux derivative is zero. When
 $0 < \delta < \delta _{I1}$, a perturbation in the interface position propagates upwards with a speed that increases with increasing core radius. A further increase of the core radius to
 $\delta _{I1} < \delta < \delta _{FP}$ entails a gradual slow-down of the propagation speed to zero, suggesting the potential occurrence of standing waves. When
 $\delta _{FP} < \delta < \delta _{I2}$, the characteristic speed increases again but becomes negative, implying a change of direction of the interface wave. At large core half-thicknesses of
 $\delta _{I2} < \delta < 1$, the propagation speed slows down and trends towards zero.
Figure 2(c) compares the two analytical solutions from Suckale et al. (Reference Suckale, Qin, Picchi, Keller and Battiato2018) for the same overall flux marked in figure 2(a) as a dotted line. In thin-core flow (blue curve), the core magma ascends relatively rapidly and is enclosed by a relatively thick and slow-moving annulus of degassed magma. In this limit, the dimensionless driving force at the base of the conduit,  $P$, is close to the hydrostatic pressure gradient in the degassed magma. In thick-core flow (red curve), the ascent speed in the core magma is significantly lower but spread over a larger radius. The core–annular interface and a portion of the core magma in the vicinity of the bidirectional-flow interface is moving downwards despite being buoyant. The driving force at the base of the conduit is close to the hydrostatic pressure gradient in the gas-rich magma.
A change in the material properties of the core magma modifies the flux function, as summarized in figure 3. When the density in the core decreases, the flux function shifts upward (light grey curve), implying a higher flux at all core thicknesses, as shown in figure 3(a). The critical points,  $\delta _{I1}$,
 $\delta _{FP}$ and
 $\delta _{I2}$, indicated by the three, differently dashed, vertical lines, remain unchanged. The effect of a finite change in core viscosity, shown in figure 3(b), is clearly distinct from a change in core density. A decrease in core viscosity (light grey curve) shifts the flux function both up towards higher overall flux and over to smaller core thicknesses. As a consequence, all critical points shift, but we only visualize the change in the flooding point here as a light grey arrow.
Isolating and comparing the effect of a jump in effective core density to that in effective core viscosity. (a) Upper domain flux function  $Te$ for different density jumps
 $\Delta _\rho =0.03,0,-0.05$ at constant core viscosity
 $\Delta _\mu =0$. The dashed and dash-dotted lines indicate the flooding point and two inflection points, which are identical for all three scenarios. (b) Upper domain flux function
 $Te$ for different viscosity jump
 $\Delta _\mu =9,0,-0.9$ at constant core density. The reference magma density and viscosity contrast are
 $\mathcal {R}=0.95$ and
 $M=100$. The flooding point position for each case corresponds to the dashed line with the same colour code. The arrows reflect the position shift of the flooding point due to a viscosity jump. Here we only consider the first flux term in (2.20).

Despite these differences, neither change in material properties alters the non-convexity of the flux function. To understand the physical origin of the convexity of the flux function  $Te$, we analyse
 $Te$ in the limits
 $\delta \rightarrow {1}$ (near the wall) and
 $\delta \rightarrow {0}$ (near the centreline) in the lower domain, where
 $\mathrm {H}(z<0)=0$ similar to Dauck et al. (Reference Dauck, Box, Gell, Neufeld and Lister2019). Near the wall, we obtain the expansion
 \begin{equation} Te \sim \frac{2{\rm \pi}\psi}{3}(1-\delta)^3-\frac{2{\rm \pi}\left[\left(3+\varphi\right)\psi\right]}{3\varphi} (1-\delta)^4 + {O}(\left(1-\delta\right)^5). \end{equation}
The leading-order term,  $Te \sim 2{\rm \pi} \psi {(1-\delta )^3}/{3}$, is cubic in
 $(1-\delta )$ due to the no-slip condition at the solid boundary. This condition results in the leading-order linear velocity profile in the thin annular film and integrating the linear velocity gives a cubic expression for the magma flux in the annulus. The expression is cubic instead of quadratic because the coefficient of the velocity profile is linear in
 $(1-\delta )$. The sign of the leading-order term implies that the flux function is always concave near
 $\delta =1$. In contrast, near the centre of the domain, expanding
 $Te$ as
 $\delta \rightarrow {0}$ gives
 \begin{equation} Te \sim {\rm \pi}\frac{\psi\left[\varphi-4\left(1+\ln \delta\right)\right]}{8} \delta^4+{\rm \pi}\psi \left(1-\frac{\varphi}{2}\right) \delta^6 + {O}(\delta^8). \end{equation}
This expansion shows that if the core is only a thin film, then, to leading order, the interface moves at a constant velocity of  $(\varphi -5-4\ln \delta )\psi \delta ^2/4$, corresponding to the leading-order constant velocity of the underlying, nonlinear velocity profile. This difference in scaling behaviour demonstrates that the non-convexity of the flux function is a consequence of the boundary conditions and hence a general characteristic of core–annular flow.
3.2. Bubble nucleation can disrupt both the upper and the lower conduits
One-dimensional conduit flow models implicitly assume that volatile exsolution only affects the upper portion of the conduit, because only upward motion is included in the model formulation. In bidirectional conduit flow models, both flow directions are represented, allowing us to assess when and why the upper as opposed to the lower conduits adjust to changes in the material properties of the core magma. To address this question, we identify the direction in which information about volatile exsolution propagates in the volcanic conduit. This information is carried along the conduit in the form of interfacial waves and the propagation directions of these waves inform whether the flow in the upper, the lower or the entire conduit adjusts.
For constant density and viscosity, the derivative of the flux function depends only on the core volume fraction for a given viscosity and density contrast between core and annular magma. When core density and viscosity vary with depth, the derivative of the flux function contains two additional terms arising from depth variations in these material properties. At the scale of the conduit length, the variation in material properties resulting from gas exsolution can be approximated as a finite jump, as assumed in § 3.1. At the scale of the conduit width, which is typically three orders of magnitude smaller, core density and viscosity increase rapidly, but not discontinuously. In this section, we zoom into this smaller spatial scale and assume an infinitesimal change in the core density and viscosity at  $z=0$, to compute the flux derivative analytically and compare the individual contributions of each of the three relevant processes.
When the jumps in density and viscosity of the core are infinitesimal,  $\Delta _\rho =\mathrm {d}\rho _c\ll 1$ and
 $\Delta _\mu =\mathrm {d}\mu _c\ll 1$, the correction term in (2.20) vanishes and the flux function reduces to
 \begin{equation} Te(\alpha,\varphi, \psi)= \frac{{\rm \pi}\alpha^2 \psi}{8} \left\{\frac{\left(\alpha-1\right)\left[4 - \varphi + \alpha \left(3 \varphi-4 \right)\right]}{1 + \alpha^2 \left(\varphi-1\right)} - 4 \ln \sqrt{\alpha}\right\}, \end{equation}
where  $\varphi =M/(1+\mathrm {d}\mu _c)$ and
 $\psi =1-1/(1-\mathcal {R})\mathrm {d}\rho _c$. The derivative of this flux function with respect to
 $\alpha$ controls the dynamics of volume fraction waves in (2.21). We can isolate the contribution of the different variables by taking the total differential of (3.3) with respect to the volume fraction,
 $\alpha$, the effective viscosity ratio,
 $\varphi$, and the rescaling factor for the pressure,
 $\psi$,
 \begin{equation} \mathrm{d}Te= C_\alpha \,\mathrm{d}\alpha + C_\varphi \,\mathrm{d}\varphi + C_\psi \,\mathrm{d}\psi, \end{equation}
where
 \begin{equation} C_\alpha=\left( \frac{\partial Te}{\partial \alpha}\right)_{\varphi,\psi}, \quad C_\varphi=\left( \frac{\partial Te}{\partial \varphi}\right)_{\alpha,\psi}, \quad C_\psi=\left( \frac{\partial Te}{\partial \psi}\right)_{\alpha,\varphi}, \end{equation}
are the kinematic, the viscosity and the density wave speed. The analytical expressions for  $C_{\alpha }$,
 $C_\varphi$ and
 $C_\psi$ are given in Appendix B.
When holding viscosity and density constant, only the kinematic wave speed,  $C_\alpha$, remains. Figure 4(a) shows how the kinematic wave speed varies with volume fraction. At large volume fraction, it is negative, meaning that the kinematic wave propagates downwards. At small volume fraction, it becomes positive, implying upwards propagating waves, and increases in magnitude. The cross-over from downwards to upwards propagating occurs at the flooding point, where the kinematic wave speed is zero. The different curves in figure 4(a) demonstrate that the flooding point shifts to smaller core thickness with increasing viscosity contrast between core and annulus magma,
 $M$, as also seen in figure 3(b). In the limiting case of infinite viscosity contrast (black dashed line), the regime in which the kinematic wave is upwards propagating disappears entirely. In figure 4(b), we summarize the regimes in which the kinematic wave is upwards or downwards propagating over several orders of magnitude in viscosity ratio.
Change in the sign of the kinematic wave speed implies two regimes in which information about volatile exsolution propagates either mostly downwards,  $C_\alpha <0$, or mostly upwards,
 $C_\alpha >0$. (a) Kinematic wave speed,
 $C_\alpha$, as a function of the volume fraction,
 $\alpha$, and the viscosity ratio,
 $M$. The black dashed line represents the limit of infinite viscosity ratio. (b) The two dynamic regimes of upward and downward dynamics are separated by the flooding point (black line) and depend on core thickness,
 $\delta$, and viscosity ratio,
 $M$.

Similar to the kinematic wave speed, the viscosity and density waves also depend on the volume fraction, as shown in figure 5. The speed of the viscosity wave is always positive and largest in magnitude when the viscosity ratio between core and annulus is small, see figure 5(a). At fixed core thickness, it decreases rapidly with increasing viscosity ratio as viscosity waves become suppressed. As the system approaches infinite viscosity ratio, it becomes insensitive to changes in viscosity and the viscosity wave vanishes (black dashed line). The speed of the density wave is also always positive and scales as the flux function with  $\psi =1$,
 $C_\psi \sim Te$. As a consequence, its shape and response to increasing viscosity ratio in figure 5(b) resembles that of the flux function in figure 3(b). With increasing viscosity ratio, the curves converge to the envelope representing infinite viscosity contrast shown as a black dashed line and derived analytically in Appendix B.
The density and viscosity waves are always upward oriented. (a) Viscosity wave speed  $C_\varphi$ as a function of the core-thickness
 $\delta$ and the viscosity ratio
 $M$. We calculate
 $C_\varphi$ for
 $\psi =1$. (b) Density wave speed
 $C_\psi$ as a function of the core-thickness
 $\delta$ and the viscosity ratio
 $M$. In both cases, the black dashed line represents the limit of infinite viscosity ratio.

These analytical estimates imply the existence of two distinct regimes, separated by the flooding point, in which information is either upwards or downwards propagating. These two regimes are controlled by the direction of the kinematic wave, because it is the only wave that changes direction as the core volume fraction increases (see figure 4). In contrast, the viscosity and density waves are always oriented upwards (see figure 5). Hence, we do not expect that changes in the density or viscosity of the gas-rich magma fundamentally alter these two regimes. That being said, an increase in core viscosity shifts the flooding curve to smaller core thicknesses, as shown in figure 3(b), thereby reducing the regime of upwards propagating information.
We test our analytical findings through numerical simulations in figure 6. In this simulation, we consider a volcanic conduit in approximately steady core–annular flow with  $\mathcal {R}=0.95$ and
 $M=100$. In figure 6(a,c), we impose a sudden gas exsolution that decreases the core density of the upper domain,
 $z>0$, by 5 %. We parametrise this density drop by setting
 $\Delta _\rho =(0.9-\mathcal {R})/\mathcal {R}=-1/19$ and keep the core viscosity constant. In figure 6(b,d), we assume an initial viscosity contrast between core and annulus magma of
 $M=100$, neglect the density jump entirely such that
 $\Delta _\rho =0$, and instead impose a sudden increase in the core viscosity by almost an order of magnitude
 $\Delta _\mu =9$. The two different rows refer to thin-core (top) and thick-core flow (bottom), respectively. We find that the analytic expectation of two basic regimes of upwards-propagating information in thin-core flow and downwards-propagating information in thick-core flow is consistent with our numerical results.
Numerical simulations showing the change in core thickness as well as the type and direction of the generated wave in response at the nucleation depth. Panels (a,c) show the flow adjustment in response to a 5 % drop in core density jump at  $z=0$ in thin-core and thick-core flow, respectively. In the lower conduit, we assume a density ratio of
 $\mathcal {R}=0.95$ and viscosity ratio of
 $M=100$. Panels (b,d) show the flow adjustment in response to a nine-fold increase in core viscosity at
 $z=0$ in thin-core and thick-core flow, respectively. The magma properties in the lower conduit are identical to those in panels (a,c), but we now impose a viscosity jump of
 $\Delta _\mu =9$ at the nucleation depth, while keeping the core density constant,
 $\Delta _\rho = 0$. In panels (a–d), the type and direction of the generated wave are indicated through coloured arrows pointing in the direction of wave propagation. Cyan represents rarefactions (R) and brown represents shocks (S). Light and dark shading of these colours indicates ascending and descending motion, respectively.

The types of waves generated in response to volatile exsolution depend on how the dynamic wave speed varies with core thickness, see figure 2(b). In the regime where the magnitude of the dynamic wave speed decreases along the propagation direction of the interface wave, perturbations build up, which leads to a steepening of the interface and, ultimately, the formation of a shock that can propagate either upstream or downstream. Conversely, perturbations tend to disperse in the regime where the magnitude of the dynamic wave speed increases along the propagation direction of the wave, resulting in a rarefaction. For this reason, figure 6(a,d) exhibits rarefaction waves and figure 6(b,c) shocks. We use these insights into the wave types in § 2.4 of the online supplement to verify the accuracy of our numerical method.
3.3. Decreasing core density has the opposite effect as increasing core viscosity
Our analysis so far has focused on the direction in which information propagates rather than on the type of flow adjustment that occurs in response to nucleation and the implications for the stability of conduit flow. One important aspect of the flow adjustment is the nature of the stationary shock at the nucleation depth and whether it entails core thickening or thinning in response to a change in material properties. Figure 6(a–d) already hints at both of those possibilities occurring, depending on the flow regime and whether it is the core density or viscosity that changes. To better understand this behaviour, we briefly return to our analytical analysis from § 3.2.
We assume that the volumetric flux changes slowly at the exsolution depth implying  $\mathrm {d}Te\approx 0$ at
 $z=0$. This simplification allows us to identify how the volume fraction of the core responds to a change in the core density while keeping the viscosity constant for now (i.e.
 $\mathrm {d}\varphi =0$), such that (3.4) reduces to
 \begin{equation} 0\approx C_\alpha\,\mathrm{d}\alpha + C_\psi \,\mathrm{d}\psi, \end{equation}
implying the estimate
 \begin{equation} \left(\frac{\partial \alpha}{\partial \psi}\right)_{Te}\approx{-}\frac{C_\psi}{C_\alpha}. \end{equation}
This derivative provides information on whether the core is thinning or thickening in response to the density change represented by  $\psi$. In (3.7), the density wave speed,
 $C_\psi$, is a function of the volume fraction and the viscosity ratio only, as shown in figure 5(b). During gas exsolution, the density of the core decreases at
 $z=0$ by an infinitesimal amount,
 $\mathrm {d}\rho _c<0$, resulting in an increase of
 $\psi$, i.e.
 $\mathrm {d}\psi >0$. Therefore, once the conduit has adjusted to the change in material properties, a drop in the core density results in core thinning if the initial thickness is below the flooding point and in core thickening if it is above the flooding point. Our numerical simulations in figure 6(a,c) confirm this analytical expectation.
Similarly, we compute the derivative that captures how the volume fraction responds to an infinitesimal change in the core viscosity assuming that the core density remains constant (i.e.  $\mathrm {d}\psi =0$),
 \begin{equation} 0 \approx C_\alpha\, \mathrm{d}\alpha + C_\varphi \,\mathrm{d}\varphi. \end{equation}
Thinning or thickening of the core in response to a change in viscosity is then given by
 \begin{equation} \left(\frac{\partial \alpha}{\partial \varphi}\right)_{Te}\approx{-}\frac{C_\varphi}{C_\alpha}. \end{equation}
Gas exsolution will tend to increase the core viscosity at  $z=0$ such that
 $\mathrm {d}\mu _c>0$ and
 $\mathrm {d}\varphi <0$. In that case, we expect core thinning if the initial thickness exceeds the flooding point and thickening otherwise. The effect of a change in viscosity on core thickness is hence the opposite of the effect of a change in density on core thickness. Again, our numerical simulations in figure 6(b,d) confirm this analytical expectation.
Our analysis suggests that the qualitative response of conduit flow to changes in the core's material properties is dependent only on the core thickness, but that the magnitude of the associated change in volume fraction depends on the viscosity ratio. At first sight, (3.7) and (3.9) may seem to suggest that viscosity and density affect volume fraction similarly. However, gas exsolution alters the density and viscosity of the core magma in opposite ways, leading to a decrease in core density as the core viscosity increases. As a consequence, a simultaneous change in both material properties creates two competing effects on the volume fraction, raising the question which one dominates.
Equations (3.7) and (3.9) relate the change in the core-volume fraction at a given flux to the speed ratio of the viscosity and kinematic waves and the density and kinematic waves, respectively. The ratio between these two ratios is hence a proxy for the change in core-volume fraction in response to both the density and viscosity jumps associated with bubble nucleation. In figure 7, we plot this ratio over a wide range of viscosity ratios and core thicknesses. When the viscosity contrast,  $M$, between core and annular magma differs by an order of magnitude or more, the effect of a viscosity change on core thickness is at least one order of magnitude smaller than the effect of a density change. Our analysis hence suggests that the density effect will tend to dominate.
Overview of the relative importance of the density and viscosity effect on the core volume fraction at the nucleation depth. The ratio between the wave speeds of the viscosity and the density waves is a proxy for the change in core volume fraction (see (3.7) and (3.9)) and shown here as a function of the core-thickness  $\delta$ and the viscosity ratio
 $M$ over a wide range of parameters. The two effects are comparable only at relatively low viscosity ratio.

An important caveat in applying this insight to actual volcanic systems is that our analytical derivation assumed  $\mathrm {d}Te\approx 0$, but the change in flux at the nucleation depth could be substantial, as analysed in more detail in the next section. Both a change in viscosity and density alter flux, but the viscosity change associated with bubble nucleation could be much larger than the density change. For example, laboratory measurements show that viscosity could increase by an order of magnitude in response to loosing 1 wt.% of water (Hess & Dingwell Reference Hess and Dingwell1996; Hui & Zhang Reference Hui and Zhang2007; Giordano, Russell & Dingwell Reference Giordano, Russell and Dingwell2008), while density will typically only change by a few percent at least in the limit of non-eruptive flow. Our finding that the flow is more sensitive to decreasing core density than increasing core viscosity (see figure 7) could hence be offset by viscosity changing more significantly. As a consequence, the two effects could be comparable in volcanic systems.
3.4. Complex, bidirectional flow behaviour in the vicinity of the flooding point
Our analytical estimates and the simple regime classification they suggest do not apply in the vicinity of the flooding point. In this section, we attempt to characterize some of the diversity of flow behaviour that tends to happen at high fluxes through numerical analysis, again considering density and viscosity effects separately. For easier comparison, we use the same density drop, but show the flow response over a wider set of initial core radii  $\delta _0 = 0.20, 0.50, 0.70$ in figure 8. The smallest and largest thickness correspond to the thin-core and thick-core flow shown in figure 6.
Simulation results for a 5 % drop in core density at  $z=0$ and various uniform initial core thicknesses
 $\delta _0$. Panels (a,d,g) show
 $Te$-
 $\alpha$ diagrams with initial and final states highlighted. The light and dark grey curves represent the flux functions in the upper and lower domains, respectively. Dashed and dash-dotted lines indicate corresponding
 $\alpha$ values of the flooding point and inflection points. Each diagram in the (d,g), (e,h) and ( f,i) panels on the same row show the corresponding core radius
 $\delta (z,t)$ and total pressure gradient
 $\mathrm {d}p/\mathrm {d}z$. Arrows in (b,e,h) indicate wave types with ‘R’ for rarefaction, ‘S’ for shock. In all simulations,
 $\mathcal {R}=0.95$,
 $M=100$,
 $\Delta _\mu =0$ and
 $\Delta _\rho = -1/19$.

Figure 8(a,d,g) shows the two flux functions in the lower (dark grey) and upper (light grey) conduits, respectively. As volatile exsolution decreases the core density, both the driving force and the flux increase in the upper portion of the domain. The light blue dots on the flux curves represent the initial state of the two domains. The flux deficit between the two initial states drives rapid adjustment of the core radius at  $z=0$, resulting in the formation of a stationary shock that balances the fluxes in the two domains. The final states are shown as dark blue triangles, with triangles representing the lower conduit pointing down and the one representing the upper conduit pointing up.
Figure 8(a) and Figure 8(g) represent thin-core and thick-core flow, respectively, also shown in figure 6. They exhibit the analytically expected behaviour discussed in §§ 3.2 and 3.3. In thin-core flow, panel (a), the flux in the upper conduit adjusts to that in the lower conduit. In thick-core flow, instead, only the lower conduit adjusts to gas exsolution implying no dynamic adjustment in the upper conduit. When the initial core thickness approaches the flooding point, as is the case in panel (d), an additional constraint arises. The overall flux in the entire conduit can not exceed the flux at either of the two flooding points. The overall flux hence becomes limited by the flooding point in the lower conduit and both portions of the conduit are forced to adjust. The upper domain adjusts to the flux at the flooding point in the lower domain while the lower domain approaches the flooding point.
Figure 8(b,e,h) shows snapshots of the core radius  $\delta (z,t)$ with consistent coloured arrows and letters indicating types and propagation directions of waves. The limits of thin- and thick-core flow are associated with a relatively simple wavefield, consisting of an ascending rarefaction, panel (b), or a descending shock, panel (h). The wave field at intermediate core thicknesses, panel (e), is more complex, consisting of an ascending shock and a descending rarefaction. The compound behaviour, where the generated wave field consists of both rarefactions and shocks, persists as long as the initial flux in the upper domain is greater than the flooding point flux in the lower domain.
Figure 8(c, f,i) shows the time evolution of the total pressure gradient,  $\mathrm {d}p/\mathrm {d}z$. The pressure gradient in the domains is altered both by the density difference between the two segments of the conduit and by the dynamic wave field. When considering a discontinuous decrease in core density, our simulations suggest that the magnitude of the total pressure gradient will increase with respect to the hydrostatic baseline shown as a dotted, light blue line. Depending on the flow field, this change will either affect the upper conduit, panel (c), the lower conduit, panel (i), or both conduit segments, panel ( f). We emphasize that panels (c, f,i) are plotted on different scales. In the vicinity of the flooding point, panel ( f), the pressure gradient deviates the most from the hydrostatic baseline, particularly in the upper conduit.
Figure 9 is the equivalent case of only core viscosity changing and core density remaining constant. The density contrast between core and annulus magma is  $\mathcal {R}=0.95$ and we consider initial core thicknesses of
 $\delta _0=0.18,0.35,0.55$. When the core viscosity increases, as would typically be the case as a consequence of crystallization induced by bubble nucleation, the flux in the upper domain becomes suppressed by the increase in viscous resistance. In contrast to figure 8, the flux curve for the lower domain (dark grey) is now higher than for the upper domain (light grey). The emerging dynamics is more varied than in figure 8, because the viscosity jump shifts the positions of the flooding and inflection points (see § 3.1).
Simulation results for an increase in core viscosity at  $z=0$ and various uniform initial core thicknesses
 $\delta _0$. Panels (a,d,g), (b,e,h) and (c, f,i) represent
 $Te$-
 $\alpha$ diagrams, core thickness evolution and total pressure gradient change. Since the viscosity jump shifts the positions of the flooding and inflection points (see § 3.1), the dashed lines now refer to different flux curves: In panels (a,d,g), the left dash-dotted line and the dashed line refer to the lower flux curve, and the right dash-dotted line refers to the higher flux curve. In all simulations,
 $\mathcal {R}=0.95$,
 $M=100$,
 $\Delta _\mu =9$ and
 $\Delta _\rho = 0$.

The aspect of the flow dynamics that remains consistent when considering a sudden increase in core viscosity, as compared to a sudden decrease in core density, is the direction in which information propagates. The wave field, instead, changes. As evident from figure 9(a), the adjustment in the upper conduit is now enabled by an upwards propagating shock wave. Similarly, the adjustment in the lower conduits is enabled by a downwards-propagating rarefaction wave, figure 9(g). At intermediate thicknesses, figure 9(d), both conduit segments adjust in such a way that the flux in the upper conduit adjusts to the higher flux in the lower conduit and the flux in the lower conduit decreases to the upper-conduit flux. This behaviour is the opposite of that in figure 8.
The viscosity effect on the pressure gradient in the conduit is also the opposite of the density effect: a sudden viscosity increase leads to a pressure gradient that is lower in magnitude than the hydrostatic baseline for all core thicknesses. In thin-core flow, the pressure gradient in the upper conduit drops in magnitude, as shown in figure 9(c). In thick-core flow, it is the lower conduit that becomes underpressured with respect to hydrostatic, see figure 9(i). At intermediate thicknesses, figure 9( f), the reduction in the magnitude of the pressure gradient is particularly pronounced and affects both conduit segments.
We summarize all of the possible dynamic regimes that can arise in response to either a reduction in core density or an increase in core viscosity at different viscosity ratios in figure 10, using the previous colour code to distinguish shocks from rarefactions. A number of different regimes emerge, but these can be classified quite simply into three main domains of: (1) upward-dominated dynamics in thin-core flow; (2) mixed bidirectional behaviour in the vicinity of the flooding point; and (3) downwards-dominated dynamics in thick-core flow. The magnitude of the density change in the core magma does not fundamentally alter these regimes, but increases in viscosity contrast enlarges regime 3 as shown in figure 10(d) as compared to figure 10(c) to the degree that regimes 1 and 2 vanish entirely at infinite viscosity contrast. Since a viscosity jump alters the inflection points of the flux curve, the added complexity of both ascending and descending rarefactions at a given core thickness arises around the flooding point when the lower-conduit flux is greater than the upper-conduit flux (see figure 10(c,d) with dark cyan above light cyan).
Summary of the dynamic regimes that can arise in response to volatile exsolution. Panels (a,b) are both based on a 5 % decrease in core density, but represent different viscosity contrasts of  $M=100$ and
 $M=1000$, respectively. The dashed line and the dash-dotted line indicate the flooding and inflection points. Panels (c,d) are both based on a nine-fold increase in core viscosity. In both cases,
 $\mathcal {R}=0.95$,
 $\Delta _\rho = 0$ and
 $\Delta _\mu =9$, but the initial viscosity contrast is
 $M=100$ in panel (c) and
 $M=10^4$ in panel (d). The dashed line and the dash-dotted line on the left indicate the flooding and left inflection points of the lower flux function, while the dash-dotted line on the right represents the right inflection point of the higher flux function. Regions in panels (b,c) with dark cyan sitting above light cyan indicate the existence of both ascending and descending rarefactions.

4. Discussion
Eruptive activity at persistently degassing volcanoes spans a wide spectrum from passive gas emissions feeding a steady gas plume and effusive eruptions creating lava flows to explosive eruptions ejecting pyroclastic material. The transitions between these different eruptive regimes are sudden and unpredictable, creating significant uncertainty in risk assessments (e.g. Ripepe et al. Reference Ripepe, Pistolesi, Coppola, Delle Donne, Genco, Lacanna, Laiolo, Marchetti, Ulivieri and Valade2017). Even a single eruption from a single eruptive centre can exhibit surprising variability in eruptive behaviour. For example, the two-months-long summit eruption at Kῑlauea, Hawai'i, in 1959 entailed 17 distinct lava fountaining phases, each approximately 1–2-days long (Richter et al. Reference Richter, Eaton, Murata, Ault and Krivoy1970).
While external triggers such as increased influx of magma from depth (Spilliaert et al. Reference Spilliaert, Allard, Métrich and Sobolev2006; Kamenetsky et al. Reference Kamenetsky, Pompilio, Métrich, Sobolev, Kuzmin and Thomas2007; Ferlito, Viccaro & Cristofolini Reference Ferlito, Viccaro and Cristofolini2009; Perinelli et al. Reference Perinelli, Mollo, Gaeta, De Cristofaro, Palladino and Scarlato2018) or partial collapse of the upper plumbing system (e.g. Sparks & Young Reference Sparks and Young2002) undoubtedly contribute to this variability in eruptive behaviour, it is unlikely that they are the only contributing factors. In some cases, such as Kῑlauea, Hawai'i, the magma supply rate appears to be approximately constant on the decadal scale (e.g. Swanson Reference Swanson1972). Nonetheless, more than 20 eruptions occurred during that period of constant influx, each with multiple eruptive phases, suggesting complex and variable flow dynamics in the volcanic plumbing systems (Cervelli & Miklius Reference Cervelli and Miklius2003). In others, such as Karymsky volcano, Russia, the short return period of moderate Vulcanian explosions of the orders of a few minutes (Fischer, Roggensack & Kyle Reference Fischer, Roggensack and Kyle2002) is difficult to reconcile with variability in external triggers alone.
Our study attempts to better understand the role that internal flow dynamics may play in the variability of eruptive behaviour displayed by persistently active volcanoes. To do that, we develop a model that allows us to identify how volcanic conduit flow adjusts to volatile exsolution – a simple, yet ubiquitous disruption in volcanic conduits. We follow several prior studies (Francis et al. Reference Francis, Oppenheimer and Stevenson1993; Stevenson & Blake Reference Stevenson and Blake1998; Kazahaya et al. Reference Kazahaya, Shinohara and Saito2002; Huppert & Hallworth Reference Huppert and Hallworth2007; Beckett et al. Reference Beckett, Mader, Phillips, Rust and Witham2011; Fowler & Robinson Reference Fowler and Robinson2018; Suckale et al. Reference Suckale, Qin, Picchi, Keller and Battiato2018; Wei, Qin & Suckale Reference Wei, Qin and Suckale2022) in assuming that the flow field in volcanic conduits during non-eruptive episodes can be approximated as core–annular flow.
While it is difficult to test the assumption of core–annular flow directly, it is supported by a number of indirect field observations. At Kῑlauea volcano, Hawai'i, these include measurements of volatile concentrations in tholeiitic glasses (Dixon, Clague & Stolper Reference Dixon, Clague and Stolper1991), the large proportion of misaligned olivine crystals (DiBenedetto, Qin & Suckale Reference DiBenedetto, Qin and Suckale2020) and direct observations of backflow (Eaton, Richter & Krivoy Reference Eaton, Richter and Krivoy1987). At Erebus volcano, Antarctica, oscillatory zoning in megacrystals (Moussallam et al. Reference Moussallam, Oppenheimer, Scaillet, Buisman, Kimball, Dunbar, Burgisser, Schipper, Andújar and Kyle2015) and cyclic gas emissions (Ilanko et al. Reference Ilanko, Oppenheimer, Burgisser and Kyle2015) appear to indicate bidirectional flow. Textural evidence from an exhumed mafic conduit (Wadsworth et al. Reference Wadsworth, Kennedy, Branney, von Aulock, Lavallée and Menendez2015), the volatile concentrations in melt inclusions from persistently degassing volcanoes (Wei et al. Reference Wei, Qin and Suckale2022), as well as the endogenous growth (Francis et al. Reference Francis, Oppenheimer and Stevenson1993) and excessive degassing (Kazahaya et al. Reference Kazahaya, Shinohara and Saito1994) of several volcanic systems point to the broader relevance of bidirectional flow.
At first sight, it might seem relatively inconsequential to include a thin annulus of heavy, degassed magma into a model of volcanic conduit flow. Why not focus exclusively on the ascent of buoyant, gas-rich magma, reminiscent of existing one-dimensional models of magma ascent? After all, the degassed magma is more viscous, likely by orders of magnitudes, and one might expect that its main effect is merely to decrease the effective radius of the conduit that is available for ascent. However, the coupling between the ascending and the descending flow is complicated significantly by the requirement to conserve mass and momentum, leading to several distinct dynamic regimes summarized in figure 11. We focus on the two analytically accessible cases of thin- and thick-core flow here, because the flow fields in existing laboratory experiments tend to assume rather low flux values that approach the flooding point only very rarely and transiently (Stevenson & Blake Reference Stevenson and Blake1998; Beckett et al. Reference Beckett, Mader, Phillips, Rust and Witham2011).
Summary of our main finding that the impact of bubble nucleation depends sensitively on the conduit flow regime. (a,b) In thin-core flow, bubble nucleation leads to adjustments in the upper conduit. (c,d) In thick-core flow, bubble nucleation leads to adjustments in the lower conduit.

The main finding from our study is that the same nucleation event can generate several distinct dynamic responses, summarized in figure 11. The dependence on the flow regime highlights the subtle, yet important role that the degassed magma plays in limiting the stability of core–annular flow. A decrease in the core density increases the buoyancy of the gas-rich magma and hence favours an increase in the upward flux of gas-rich magma. Accommodating this adjustment in stable core–annular flow requires an equal increase in the downward flux of degassed magma, but the descent speed of highly viscous magma is difficult to increase significantly through buoyancy alone. The flow field has two main options to re-establishing equilibrium: flow suppression and flow accommodation. When the decrease in core density dominates, thin-core flow responds by reducing the flux in the upper conduit to its pre-exsolution value through core thinning, but thick-core flow responds by increasing the flux in the upper conduit through core thickening.
Interestingly, an increase in core viscosity has the opposite effect than a core-density decrease, because it reduces the viscosity contrast between the gas-rich and the degassed magma in the upper conduit. As a consequence, it becomes easier for the system to equilibrate the two fluxes since the viscous resistance in the core and annulus are no longer quite so unevenly matched. The conduit has still the same two basic options for adjustments, flow suppression and flow accommodation, but now thin-core flow is associated with a flow accommodation and core thickening while thick-core flow experiences flow suppression and core thinning. Depending on the magnitude of the two effects, an increase in core viscosity could approximately cancel out the decrease in core density, potentially explaining why core–annular flow can be stable in volcanic systems despite the intricacy that depth-variable material properties introduce into it.
The four regimes summarized in figure 11 highlight that the ability of core–annular flow with depth-variable density and viscosity to assume steady state is limited, unless the density and viscosity effects of volatile exsolution approximately cancel out. In the case that one of them dominates, our analysis suggests that thin-core flow might be associated with a more immediate response at or near the free surface than thick-core flow, because disruptions propagate upwards and can escape the system, at least if the free surface allows that escape. For example, a lava lake such as Ray Lake at Erebus might allow a pressure pulse to escape when a mostly crystalline plug thought to exist in the upper conduit at Stromboli volcano (Suckale et al. Reference Suckale, Keller, Cashman and Persson2016) might not.
In thick-core flow, disruptions propagate downwards and interact with the magma storage zone at depth. The free surface might show no sign of disruption, but the downwards propagating waves can not escape at depth. Instead of escaping, the disruption could build up and trigger changes in the deep magma storage zone. For example, decompression waves propagating downwards into volatile-saturated magma, like the one emerging in figure 9(i), could lead to increased exsolution of volatiles at depth and associated expansion of the magma-volatile mixture (Gonnermann & Manga Reference Gonnermann and Manga2007). We note in this context that downwards propagating decompression waves have been related to Vulcanian activity in previous studies (Self, Wilson & Nairn Reference Self, Wilson and Nairn1979; Kieffer Reference Kieffer1981; Turcotte et al. Reference Turcotte, Ockendon, Ockendon and Cowley1990; Woods Reference Woods1995), but these were much larger in magnitude than the pressure drop associated with near-steady flow conditions we infer here.
We emphasize that our model relies on a very simplistic representation of volatile exsolution. We only focus on a single, discontinuous change in the gas fraction, as would be associated with a nucleation event in the conduit (Le Gall & Pichavant Reference Le Gall and Pichavant2016a,Reference Le Gall and Pichavantb). Some of our insights translate to a continuous change in gas fraction, as shown in the supplementary material, but a detailed assessment of different, continuous depth profiles of core density and viscosity is beyond the scope of this paper. There is no doubt that the depth-evolution of the density and viscosity of magma in volcanic conduits is much more complex than captured here, partly because it depends itself on numerous physical and chemical processes including magma composition (e.g. Lange & Carmichael Reference Lange and Carmichael1987), differentiation processes (e.g. Grove & Baker Reference Grove and Baker1983), water content (e.g. Ochs & Lange Reference Ochs and Lange1999) and temperature (e.g. Lange Reference Lange1997), to only name a few.
In fact, our results highlight that the thermodynamic and fluid-mechanical evolution of volcanic conduits are intricately linked and that the nucleation depth is itself dynamic. We show that the flow adjustments necessary to accommodate a change in the material properties of the core magma imply notable deviations from the hydrostatic pressure gradient. This finding highlights the value of directly linking our analysis of the fluid dynamics to one of the existing thermodynamic modelling programs like MELTS (Ghiorso & Sack Reference Ghiorso and Sack1995), Perple_X (Connolly Reference Connolly2005), DensityX (Iacovino & Till Reference Iacovino and Till2019), VESIcal (Iacovino et al. Reference Iacovino, Matthews, Wieser, Moore and Bégué2021), MagmaSat (Ghiorso & Gualda Reference Ghiorso and Gualda2015), VolatileCalc (Newman & Lowenstern Reference Newman and Lowenstern2002) or Papale et al. (Reference Papale, Moretti and Barbato2006). We do not integrate these models here, because that would require focusing on a specific volcanic system and we aim for general insights as a first step towards a more complete understanding.
5. Conclusions
In this study, we analyse how a change in the density and viscosity of volatile-rich magma, triggered by a nucleation event at a pre-specified depth, alters core–annular flow in the conduits of persistently degassing volcanoes. We derive an evolution equation for the core–annular interface using a lubrication approximation and analyse our model through a combination of analytical and numerical techniques. We identify two main dynamic regimes: in one case, flow in the lower conduit remains unaltered but flow in the upper conduit adjusts in response to exsolution. In the opposite case, flow in the upper conduit remains unaltered and flow in the lower conduit adjusts in response to exsolution. These two end members are connected by a complex transitional regime, where both portions of the conduit are partially disrupted. The main implication of our work is that gas exsolution can, but does not necessarily, lead to flow adjustments in the upper conduit that then translate into surface activity. It can also confine flow adjustments to the lower portion of the conduit, effectively trapping disruptions at depth with potentially important consequences for activating stored magma and for the emergence of different eruptive regimes.
Supplementary material
Supplementary material is available at https://doi.org/10.1017/jfm.2022.346.
Acknowledgements
Our work has benefited greatly from discussions with Z. Qin. We also acknowledge helpful conversations with K.V. Cashman, A. Rust, I. Battiato, A. Papula and P. Garaud. The manuscript was improved greatly through the thoughtful comments by two anonymous reviewers.
Funding
This study was supported by NSF grant CH-2048430 awarded to J.S. The majority of research was performed using the facilities at Stanford University, where S.P. obtained his MS degree.
Declaration of interests
The authors report no conflict of interest.
Author contributions
S.P. derived the lubrication model, implemented it numerically, produced the figures presenting our simulations results and wrote the accompanying text. D.P. derived the analytical results, co-advised S.P. and contributed to the figure design and text. J.S. conceptualized the study, advised S.P., acquired funding and wrote some of the text. All authors have reviewed and approved the text.
Open Research
The code used for our simulations of flow adjustment is available at http://zapad.stanford.edu/sigma/JFM2022_depthdependent_bidirectionalflow with open access. The usage instructions are provided in the README file of the repository.
Appendix A. Generalized exchange-flow condition
For incompressible core–annular flow, the conservation of mass implies that upward and downward flux has to balance in steady state. Once the core density in the upper domain (i.e.  $z>0$) changes by a finite amount, the compressibility around
 $z=0$ modifies the exchange flow condition as derived here. To start with, we rewrite the dimensionless continuity equations (2.9) as
 $$\begin{gather} \frac{\partial }{\partial r}\left[\left(1+\Delta_\rho \mathrm{H}(z)\right)r v_c\right]+\frac{\partial}{\partial z}\left[\left(1+\Delta_\rho \mathrm{H}(z)\right) r u_c\right] = 0 , \end{gather}$$
 $$\begin{gather}\frac{\partial \left(r v_a\right)}{\partial r}+\frac{\partial \left(r u_a\right)}{\partial z} = 0. \end{gather}$$
Integrating both equations along  $r$, from
 $0$ to
 $\delta$ for the first and
 $\delta$ to
 $1$ the second, yields
 $$\begin{gather} \delta v_i ={-}\frac{1}{1+\Delta_\rho \mathrm{H}(z)}\int_0^\delta \frac{\partial}{\partial z}\left[\left(1+\Delta_\rho \mathrm{H}(z)\right) r u_c\right] \,\mathrm{d}r, \end{gather}$$
 $$\begin{gather}\delta v_i = \int_\delta^1 \frac{\partial \left(r u_a\right)}{\partial z} \,\mathrm{d}r, \end{gather}$$
where we have used the boundary conditions  $v_c(r=0)=0$,
 $v_c(r=\delta )=v_a(r=\delta )=v_i$, and
 $v_a(r=1)=0$. This implies that
 \begin{equation} \frac{1}{1+\Delta_\rho \mathrm{H}(z)}\int_0^\delta \frac{\partial}{\partial z}\left[\left(1+\Delta_\rho \mathrm{H}(z)\right) r u_c\right] \,\mathrm{d}r + \int_\delta^1 \frac{\partial \left(r u_a\right)}{\partial z} \,\mathrm{d}r=0, \end{equation}
or equivalently,
 \begin{equation} \frac{\Delta_\rho \mathrm{H}'(z)}{1+\Delta_\rho \mathrm{H}(z)}\int_0^\delta r u_c \,\mathrm{d}r+\int_0^\delta \frac{\partial \left(r u_c\right)}{\partial z} \,\mathrm{d}r+ \int_\delta^1 \frac{\partial \left(r u_a\right)}{\partial z} \,\mathrm{d}r=0, \end{equation}
where  $\mathrm {H}'(z)=\mathrm {d} \mathrm {H}(z)/\mathrm {d} z$ is the Dirac delta distribution. From Leibniz's rule, we have
 $$\begin{gather} \int_0^\delta \frac{\partial \left(r u_c\right)}{\partial z} \,\mathrm{d}r = \frac{\partial}{\partial z}\int_0^\delta r u_c \,\mathrm{d}r-\delta u_i \frac{\partial \delta}{\partial z}, \end{gather}$$
 $$\begin{gather}\int_\delta^1 \frac{\partial \left(r u_a\right)}{\partial z} \,\mathrm{d}r = \frac{\partial}{\partial z}\int_\delta^1 r u_a \,\mathrm{d}r+\delta u_i \frac{\partial \delta}{\partial z}, \end{gather}$$
where we have used the boundary conditions  $u_c(r=\delta )=u_a(r=\delta )=u_i$. Substituting these into the previous equation gives the generalized exchange flow condition
 \begin{equation} \frac{\Delta_\rho \mathrm{H}'(z)}{1+\Delta_\rho \mathrm{H}(z)}\int_0^\delta r u_c \,\mathrm{d}r+\frac{\partial}{\partial z}\left(\int_0^\delta r u_c \,\mathrm{d}r+\int_\delta^1 r u_a \,\mathrm{d}r\right)=0. \end{equation}
To generalize this equation to the compressible case, we first consider how the net fluxes at the two boundaries are affected by a change in core density change in the upper domain. Both the density change itself and the induced wave propagation from  $z=0$ can alter the boundary fluxes. The first only affects the top flux immediately, while the second can change both fluxes, albeit with a time lag determined by the wave speed and conduit length. Therefore, if the system starts with a uniform flow and zero net fluxes at both boundaries, only the bottom boundary can have a zero net flux, at least until the potential wave arrival. This implies that the valid choice for the compressible case is
 $z_0=-1/2$ at the bottom. And the integration for
 $z\neq 0$ leads to
 \begin{equation} \int_0^\delta r u_c \,\mathrm{d} r +\int_\delta^1 r u_a \,\mathrm{d} r ={-}\frac{\Delta_\rho\mathrm{H}(z)}{1+\Delta_\rho\mathrm{H}_0} \left(\int_0^\delta r u_c\, \mathrm{d} r \right)_{z=0} , \end{equation}
where  $\mathrm {H}_0=\mathrm {H}(z=0)$ is a parameter typically between
 $0$ and
 $1$. To shed light on the core flux at
 $z=0$, we first look at core fluxes for
 $z\rightarrow 0^-$ and
 $z\rightarrow 0^+$. When
 $z<0$, the right-hand side of the upgraded exchange-flow condition is zero, indicating
 \begin{equation} \left(\int_0^\delta r u_c\, \mathrm{d} r \right)_{z\rightarrow 0^-} ={-}\left(\int_\delta^1 r u_a \,\mathrm{d} r \right)_{z\rightarrow 0^-}. \end{equation}
Since  $\mathrm {H}(z>0)=1$, we have for
 $z\rightarrow 0^+$,
 \begin{equation} \left(\int_0^\delta r u_c\, \mathrm{d} r \right)_{z\rightarrow 0^+}={-}\frac{1+\Delta_\rho \mathrm{H}_0}{1+\Delta_\rho \left(1+\mathrm{H}_0\right)}\left(\int_\delta^1 r u_a \,\mathrm{d} r \right)_{z\rightarrow 0^+}. \end{equation}
We assume that these two limits set the bounds for the core flux at  $z=0$, and that the choice of a specific value, like the choice of one
 $\mathrm {H}_0\in [0,1]$, has little effect on the dynamics of interest. Specifically, we do not expect the lubrication model to capture the dynamics at
 $z=0$ that might be critical to establish a steady state near the jump. However, we expect the jump to induce rapid adjustment to reach a steady state near
 $z=0$ with a time scale much shorter than wave propagation. Therefore, for simplicity, we set in our lubrication model
 $\mathrm {H}_0=0$ and
 \begin{equation} \left(\int_0^\delta r u_c\, \mathrm{d} r \right)_{z=0}={-}\left(\int_\delta^1 r u_a\, \mathrm{d} r \right)_{z\rightarrow 0^-}. \end{equation}
In case the density properties of the core do not vary,  $\Delta _\rho =0$, (A6) reduces to
 \begin{equation} \frac{\partial}{\partial z}\left(\int_0^\delta r u_c \,\mathrm{d}r+\int_\delta^1 r u_a \,\mathrm{d}r\right)=0, \end{equation}
where the net flux across a horizontal section of the domain is constant for an arbitrary  $z_0$. Conventionally, we choose
 $z_0$ to be the top or bottom boundary and impose a fixed zero net-flux boundary condition, yielding
 \begin{equation} \int_0^\delta r u_c \,\mathrm{d}r+\int_\delta^1 r u_a \,\mathrm{d}r\equiv 0, \end{equation}
which is the usual, incompressible exchange flow condition, see Suckale et al. (Reference Suckale, Qin, Picchi, Keller and Battiato2018).
Appendix B. Analytical expressions of the kinematic, density, and viscosity wave speed
The analytical expressions for  $C_{\alpha }$,
 $C_\varphi$ and
 $C_\phi$ are
 $$\begin{gather} C_\alpha=\frac{{\rm \pi} \alpha \psi }{2(1+\alpha^2(\varphi-1))^2 }\left\{\vphantom{-\frac{1}{2}} (1+\alpha^2(\varphi-1))^2\log\alpha \right.\nonumber\\ \quad \left. -\frac{1}{2}(\alpha-1)\left[ (2\varphi^2 -5\varphi+3)\alpha^3 + (\varphi-1)\alpha^2 +(5\varphi-7)\alpha -\varphi+5 \right] \right\}, \end{gather}$$
 $$\begin{gather} C_\varphi=\dfrac{{\rm \pi} \alpha^2 \psi (\alpha-1)^4}{8(1+\alpha^2(\varphi-1))^2}, \end{gather}$$
 $$\begin{gather}C_\psi=\dfrac{{\rm \pi}\alpha^2}{8} \left\{\frac{\left(\alpha-1\right)\left[4 - \varphi + \alpha \left(3 \varphi-4 \right)\right]}{1 + \alpha^2 \left(\varphi-1\right)} - 4 \ln \sqrt{\alpha}\right\}. \end{gather}$$
In the limit of  $M\rightarrow \infty$, the kinematic wave speed approaches
 \begin{equation} C_\alpha(M\rightarrow \infty)={-}\frac{{\rm \pi} \psi}{2}\left( 1-\alpha+\alpha \log {\alpha}\right), \end{equation}
implying that the kinematic wave always propagates downwards (see black line in figure 4a). The viscosity wave becomes suppressed entirely,  $C_\varphi \rightarrow 0$, and the density wave speed approaches the envelope
 \begin{equation} C_\psi(M\rightarrow \infty)={-}\frac{\rm \pi}{8}(2\alpha^2\log{\alpha}-3\alpha^2+4\alpha-1). \end{equation}



