I. INTRODUCTION
The electrically tunable thin film bulk acoustic wave (BAW) resonators, utilizing electric field-induced piezoelectric effect in paraelectric phase ferroelectric BaxSr1−xTiO3 (BSTO), have been developed for the last few years [Reference Noeth, Yamada, Muralt, Tagantsev and Setter1–Reference Vorobiev, Gevorgian, Löffler and Olsson7]. BSTO BAW – solidly mounted resonators (BAW–SMR) with improved Q-factor, as high as 360 at 5.1 GHz, have been demonstrated [Reference Vorobiev, Gevorgian, Löffler and Olsson7, Reference Vorobiev and Gevorgian8]. However, the tunability of resonance frequency and effective electromechanical coupling coefficient of these BAW–SMR, 2 and 4.4%, respectively, are still lower than required [Reference Vorobiev, Gevorgian, Löffler and Olsson7]. For applications in the agile front ends of the advanced transceivers, used in microwave communication systems, BAW resonators with higher tunabilities are desirable. The required coupling coefficient is defined by the system bandwidth and for the personal communication systems, for example, it should be 6.5% and higher [Reference Hashimoto9]. BSTO BAW–SMR with tunability and coupling coefficient of 3.8 and 7.1%, respectively, have been reported, though their Q-factor is rather low, 130 at 5.5 GHz [Reference Berge and Gevorgian6]. A recently developed model of the electric field-induced piezoelectric effect in a paraelectric layer provides the basic relationships between material parameters, tunability of resonance frequency and the electromechanical coupling coefficient [Reference Noeth, Yamada, Muralt, Tagantsev and Setter1]. In particular, it is shown that both the tunability of resonance frequency and the coupling coefficient are proportional to the relative tunability of permittivity. On the other hand, the permittivity (and its tunability) of paraelectric phase BSTO solid solution increases with Ba content. Therefore, optimization of BSTO composition is a way to increase the tunability and coupling coefficient of BSTO BAW resonators. In this paper, we demonstrate that improvement in the tunability and coupling coefficient of BSTO BAW–SMR can be achieved by selection of Ba concentration.
II. EXPERIMENTAL DETAILS
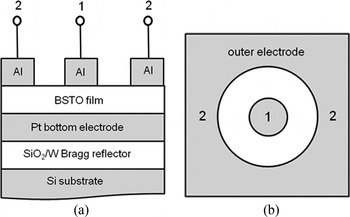
The BSTO BAW–SMR test structures are fabricated on silicon substrates with a resistivity of 20 kΩ·cm [Reference Vorobiev and Gevorgian8]. The Bragg reflectors, consisting of two pairs of λ/4 SiO2/W layers with thicknesses of 280/240 nm, and 100 nm Pt bottom plates are deposited by magnetron sputtering. The 50/10 nm thick TiO2/Ti diffusion barrier/adhesion layer stacks are deposited below the Pt bottom plate. The 290 nm thick BSTO films are grown by rf magnetron sputtering of Ba0.25Sr0.75TiO3 (Ba25) and Ba0.5Sr0.5TiO3 (Ba50) targets at Ar/O2 gas pressure of 2 mTorr, and slightly different growth temperatures of 610 and 620°C, respectively. The TiO2/Ti layers of Ba25 BAW–SMR are deposited without heating while those of Ba50 BAW–SMR are deposited at 600°C with the aim to improve the diffusion barrier properties. BAW–SMR with different BSTO growth temperatures and the bottom electrode structures are also considered in the analysis, which is indicated specifically. The Al top electrodes with Ti adhesion layers are deposited by e-beam evaporation. A lift-off process is used to pattern the top electrodes in the form of central circular patches (60 µm in diameter) surrounded by 200 µm diameter concentric outer electrodes. The cross sectional structure and layout of BSTO BAW–SMR are shown in Fig. 1.
Schematic cross section view (a) and layout (b) of BSTO BAW–SMR.

The complex input impedance Z = ReZ + jImZ and admittance of test structures are calculated using S11 parameters measured using an Agilent N5230A vector network analyzer and ground-signal-ground (GSG) microprobes in the frequency range 1–10 GHz. The X-ray diffraction (XRD) spectra of BSTO BAW–SMR are obtained using a Philips X'pert SW 3040 diffractometer equipped with a point Cu Ka radiation source, an MRD lens, a thin collimator, and an Ni filter. The BSTO film surface is characterized by atomic force microscopy (AFM) using a Digital Instruments Dimension 3000 scanning probe microscope operating in tapping mode.
III. RESULTS AND DISCUSSION
A) Microstructure analysis
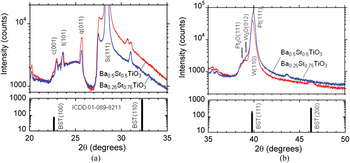
Figure 2 shows the XRD patterns of Ba25 and Ba50 BAW–SMR. The standard XRD data of Ba0.256Sr0.744TiO3 powder (indexed according to the International Centre for Diffraction Data (ICDD) entry 01-089-8211) are also shown. The typical halo reflection in the range 2θ = 22–27°, Fig. 2(a), is attributed to the amorphous SiO2 matrix of the Bragg reflector. The peaks marked as c(001), t(101), and q(011) are identified as reflections of strained cristobalite, tridymite, and quartz, respectively [Reference Vorobiev, Gevorgian, Löffler and Olsson7]. This indicates that the SiO2 Bragg reflector layers are, partially, in crystalline state.
XRD scans of the Ba25 and Ba50 BAW–SMR in the ranges of 20–35° (a) and 35–50° (b). Shown also are the standard XRD data of Ba0.256Sr0.744TiO3 powder.

The XRD spectra, Fig. 2(b), reveal reflections from the low oxidized tungsten W3O(012) and platinum Pt2O(111) phases indicating that the W layers of the Bragg reflectors and the Pt bottom electrode layers are subjected to oxidation during high temperature growth of the BSTO films [Reference Vorobiev, Gevorgian, Löffler and Olsson7]. It can be seen that there are no BST(110) reflections. The Ba50 BAW–SMR reveals BST(200) reflection. The shoulders below c(001) can be interpreted as BST(100) for both compositions. The peak at, approximately, 2θ = 39° of the Ba50 scan can be attributed to BST(111). The BST(111) of Ba25 BAW–SMR is probably masked by the W3O(012) and strong Pt(111) and W(110) peaks. Our selection area diffraction analysis of Ba25 BAW–SMR shows (111) texturing parallel to the growth direction [Reference Vorobiev, Gevorgian, Löffler and Olsson7]. This allows us to assume that the Ba50 film is also (111) textured.
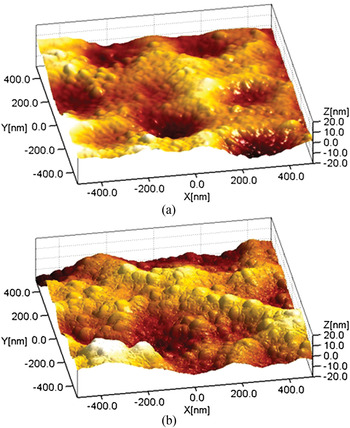
Figure 3 shows the AFM images of Ba25 and Ba50 film surfaces. It can be seen that the surface morphologies of both films are defined not by the columnar grain tips but, mainly, by the ridge-like features with larger lateral sizes. The ridge-like features are, most probably, caused by distortion of the Pt bottom electrode caused by formation of TiO2 heterogeneous enclosures within the Pt intergrain area [Reference Vorobiev, Berge, Gevorgian, Löffler and Olsson10]. The AFM images have been analyzed using a scanning probe image processor (SPIP) 4.6.1.0 software tool. The analysis gives root mean square (rms) surface roughness of 4.8 and 5.7 nm for the Ba25 and Ba50 films, respectively. The SPIP software allows for calculation of rms roughness with error less than 0.01%. The overall system noise is generally the primary limiting factor in vertical resolution that can be acquired with the AFM. This is a result of combined effects from electrical, mechanical, and acoustic noise sources. The Digital Instruments guarantees 0.03–0.1 nm noise levels depending on the type of AFM environment. Thus, the error in our measurements of rms surface roughness should be less than 2%. The slightly higher roughness of the Ba50 film can be explained by higher growth temperatures of the BSTO film. Thus, one can conclude that high temperature deposition of the TiO2 buffer layer, used with the aim to improve its diffusion barrier properties, did not result in the expected reduction in BSTO film surface roughness.
AFM images of the Ba25 (a) and Ba50 (b) film surfaces.

B) BAW–SMR performance
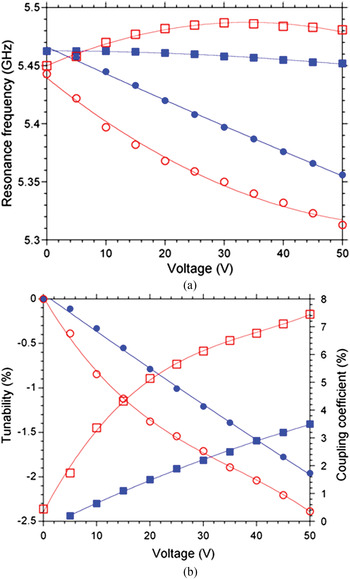
Figure 4(a) shows the dc bias voltage dependences of series and parallel resonance frequencies of Ba25 and Ba50 BAW–SMR. It can be seen that the series resonance frequency of both BAW–SMR decreases with applied dc voltage and shows much stronger dependence than that of parallel resonance. The parallel resonance frequency of Ba25 BAW–SMR decreases monotonously while that of Ba50 increases and reveals a maximum. Fig. 4(b) shows the corresponding tunabilities of series resonance frequencies and coupling coefficients versus the dc bias voltage. The tunability of the series f s (or parallel f p) resonance frequency of BAW–SMR is calculated as:
(a) Series (circles) and parallel (squares) resonance frequencies of the Ba25 (closed symbols) and Ba50 (open symbols) BAW–SMR versus dc bias voltage. (b) Tunability of series resonance frequency (circles) and effective coupling coefficient (squares) of the Ba25 (closed symbols) and Ba50 (open symbols) BAW–SMR versus dc bias voltage.

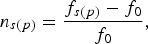 $$n_{s\lpar p\rpar } = \displaystyle{{f_{s\lpar p\rpar } - f_0 } \over {f_0 }}{\rm\comma \; }$$
where f 0 is the resonance frequency extrapolated to E dc = 0. The effective electromechanical coupling coefficient is calculated as [Reference Hashimoto9, Reference Nam, Park, Ha, Shim and Song11]:
 $$k_{eff}^2 = \displaystyle{\pi \over 2}\displaystyle{{f_s } \over {f_p }}\cot \left({\displaystyle{\pi \over 2}\displaystyle{{f_s } \over {f_p }}} \right)\approx \displaystyle{{\pi ^2 } \over 8}\displaystyle{{f_p^2 - f_s^2 } \over {f_p^2 }} .$$
It can be seen that increase in Ba concentration results in more than two times increase in the coupling coefficient, from 3.5 to 7.5%, and an increase in tunability from 1.9 to 2.4%.
C) Piezoelectric effect modelling
In the model of the field-induced piezoelectric effect in a non-loaded paraelectric film the following relation between the electromechanical coupling coefficient k 2f and the relative tunability of permittivity n r has been established [Reference Noeth, Yamada, Muralt, Tagantsev and Setter1]:
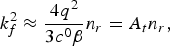 $$k_f^2 \approx \displaystyle{{4q^2 } \over {3c^0 \beta }}n_r = A_t n_r\comma \; $$
with
 $$A_t = \displaystyle{{4q^2 } \over {3c^0 \beta }}{\rm\comma \; }$$
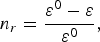 $$n_r = \displaystyle{{\varepsilon ^0 - \varepsilon } \over {\varepsilon ^0 }}\comma \; $$
where q, β, ɛ, and c are corresponding components of the tensors of linear electrostriction, dielectric nonlinearity, permittivity, and elastic constant, respectively. The upper index “0” corresponds to the dc electric field E dc = 0. The dc bias dependent non-loaded tunabilities of series n sf and parallel n pf resonance frequencies may be described in terms of n r as [Reference Noeth, Yamada, Muralt, Tagantsev and Setter1]:
 $$n_{sf} = - A_t n_r \left({\gamma+\displaystyle{\mu \over 2}+\displaystyle{4 \over {\pi ^2 }}} \right)\comma \; $$
 $$n_{pf} = - A_t n_r \left({\gamma+\displaystyle{\mu \over 2}} \right).$$
The terms γ and μ are defined as [Reference Noeth, Yamada, Muralt, Tagantsev and Setter1, Reference Noeth, Yamada, Sherman, Muralt, Tagantsev and Setter12]:
 $$\gamma = \displaystyle{{mc^{} } \over {8c^0 q^2 \varepsilon \varepsilon _0 }} \approx \displaystyle{m \over {8q^2 \varepsilon \varepsilon _0 }}=\Gamma m\comma \; $$
 $$\mu \approx \displaystyle{{\varepsilon ^b } \over \varepsilon }.$$
Here, m and ɛ b are the corresponding components of the tensors of nonlinear electrostriction and background permittivity, respectively.
Figure 5 shows dc bias voltage dependences of permittivity and relative tunability of the permittivity of the Ba25 and Ba50 films. It can be seen that increase in the Ba content results in increase in permittivity and corresponding increase in tunability from 55 to 85%. The increase in permittivity and its tunability is associated with dependence of BSTO solid solution Curie temperature on Ba content.
Permittivity (circles) and relative tunability of permittivity (squares) of the Ba25 (closed symbols) and Ba50 (open symbols) thin films versus dc bias voltage.

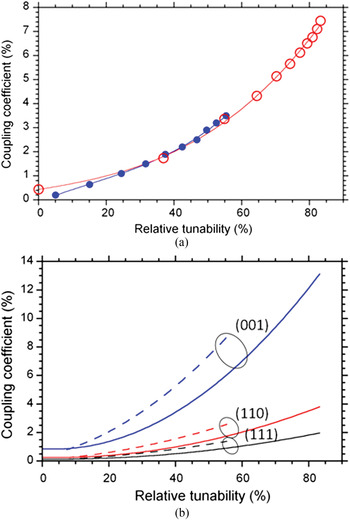
Figure 6(a) shows effective electromechanical coupling coefficients of Ba25 and Ba50 BAW–SMR plotted versus tunability of permittivity. As can be seen, the coupling coefficients of BAW–SMR with different compositions demonstrate similar dependences on relative tunability – meaning that the A t coefficients in (3) are rather similar. However, the Ba25 dependence reveals slightly higher slope. Another interesting observation is nonlinearity of coupling coefficient dependence on relative tunability of permittivity. This can be explained by the fact that (3) is strictly valid in the limit of small tuning, i.e. small fields. The fields used in our experiments are rather high, up to 180 V/µm.
(a) Effective electromechanical coupling coefficient of the Ba25 (closed symbols) and Ba50 (open symbols) BAW–SMR versus relative tunability of permittivity. (b) Non-loaded electromechanical coupling coefficient of the Ba25 (dashed lines) and Ba50 (solid lines) films, calculated for different orientations, versus relative tunability of permittivity.

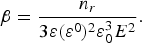
The corresponding non-loaded electromechanical coupling coefficients can be calculated using (3). The component β can be found in the limit of weak nonlinearity, i.e. at n r ≪ 1, as [Reference Tagantsev, Sherman, Astafiev, Venkatesh and Setter13]:
 $$\beta = \displaystyle{{n_r } \over {3\varepsilon \lpar \varepsilon ^0 \rpar ^2 \varepsilon _0^3 E^2 }} .$$
Using (10) and the measured permittivity dependences (Fig. 5) at low fields gives β = 3.03 × 10¹⁰ Vm5/C3 and 3.68 × 10¹⁰ Vm5/C3 for the Ba25 and Ba50 films, respectively. The thickness mode components q and c 0 for different orientations of the Ba0.5Sr0.5TiO3 and Ba0.3Sr0.7TiO3 compositions are listed in Table 1 [Reference Noeth, Yamada, Tagantsev and Setter14]. The proportionality factors A t between the non-loaded electromechanical coupling coefficient and the relative tunability of permittivity, calculated using (4) and (10), are also listed.
List of the thickness mode tensor components q and c 0 given for different orientations of the Ba0.5Sr0.5TiO3 and Ba0.3Sr0.7TiO3 compositions. The calculated proportionality factors A t between the non-loaded electromechanical coupling coefficient and the relative tunability of permittivity are also listed.

It can be seen that, for corresponding orientations, the factor A t of the Ba0.3Sr0.7TiO3 composition is larger which explains the slightly larger slope of the k 2eff dependence in Fig. 6(a). Comparison of the factors A t corresponding to different orientations indicates a rather strong anisotropy. According to (3), (6), and (7) the (001) orientation should give a several times larger coupling coefficient and, hence, tunability of resonance frequency, for the same tunability of permittivity. Figure 6(b) shows the non-loaded coupling coefficients calculated using (3) for different orientations and taking into account the nonlinearities observed experimentally at high relative tunabilities (Fig. 6a). As seen, the (001) orientations give significantly higher coupling coefficients. The calculated non-loaded coupling coefficients, see Fig. 6(b), associated with the (110) and (111) orientations are even lower than the measured values, Fig. 6(a). Thus, it may be assumed that in our (111) textured BSTO films the field induced piezoelectric response is governed mainly by the minor (001) phase. Therefore, the performance of our BSTO BAW–SMR can be significantly improved by fabrication of predominantly (001) oriented films using, for example, different bottom electrodes and/or buffer layers.
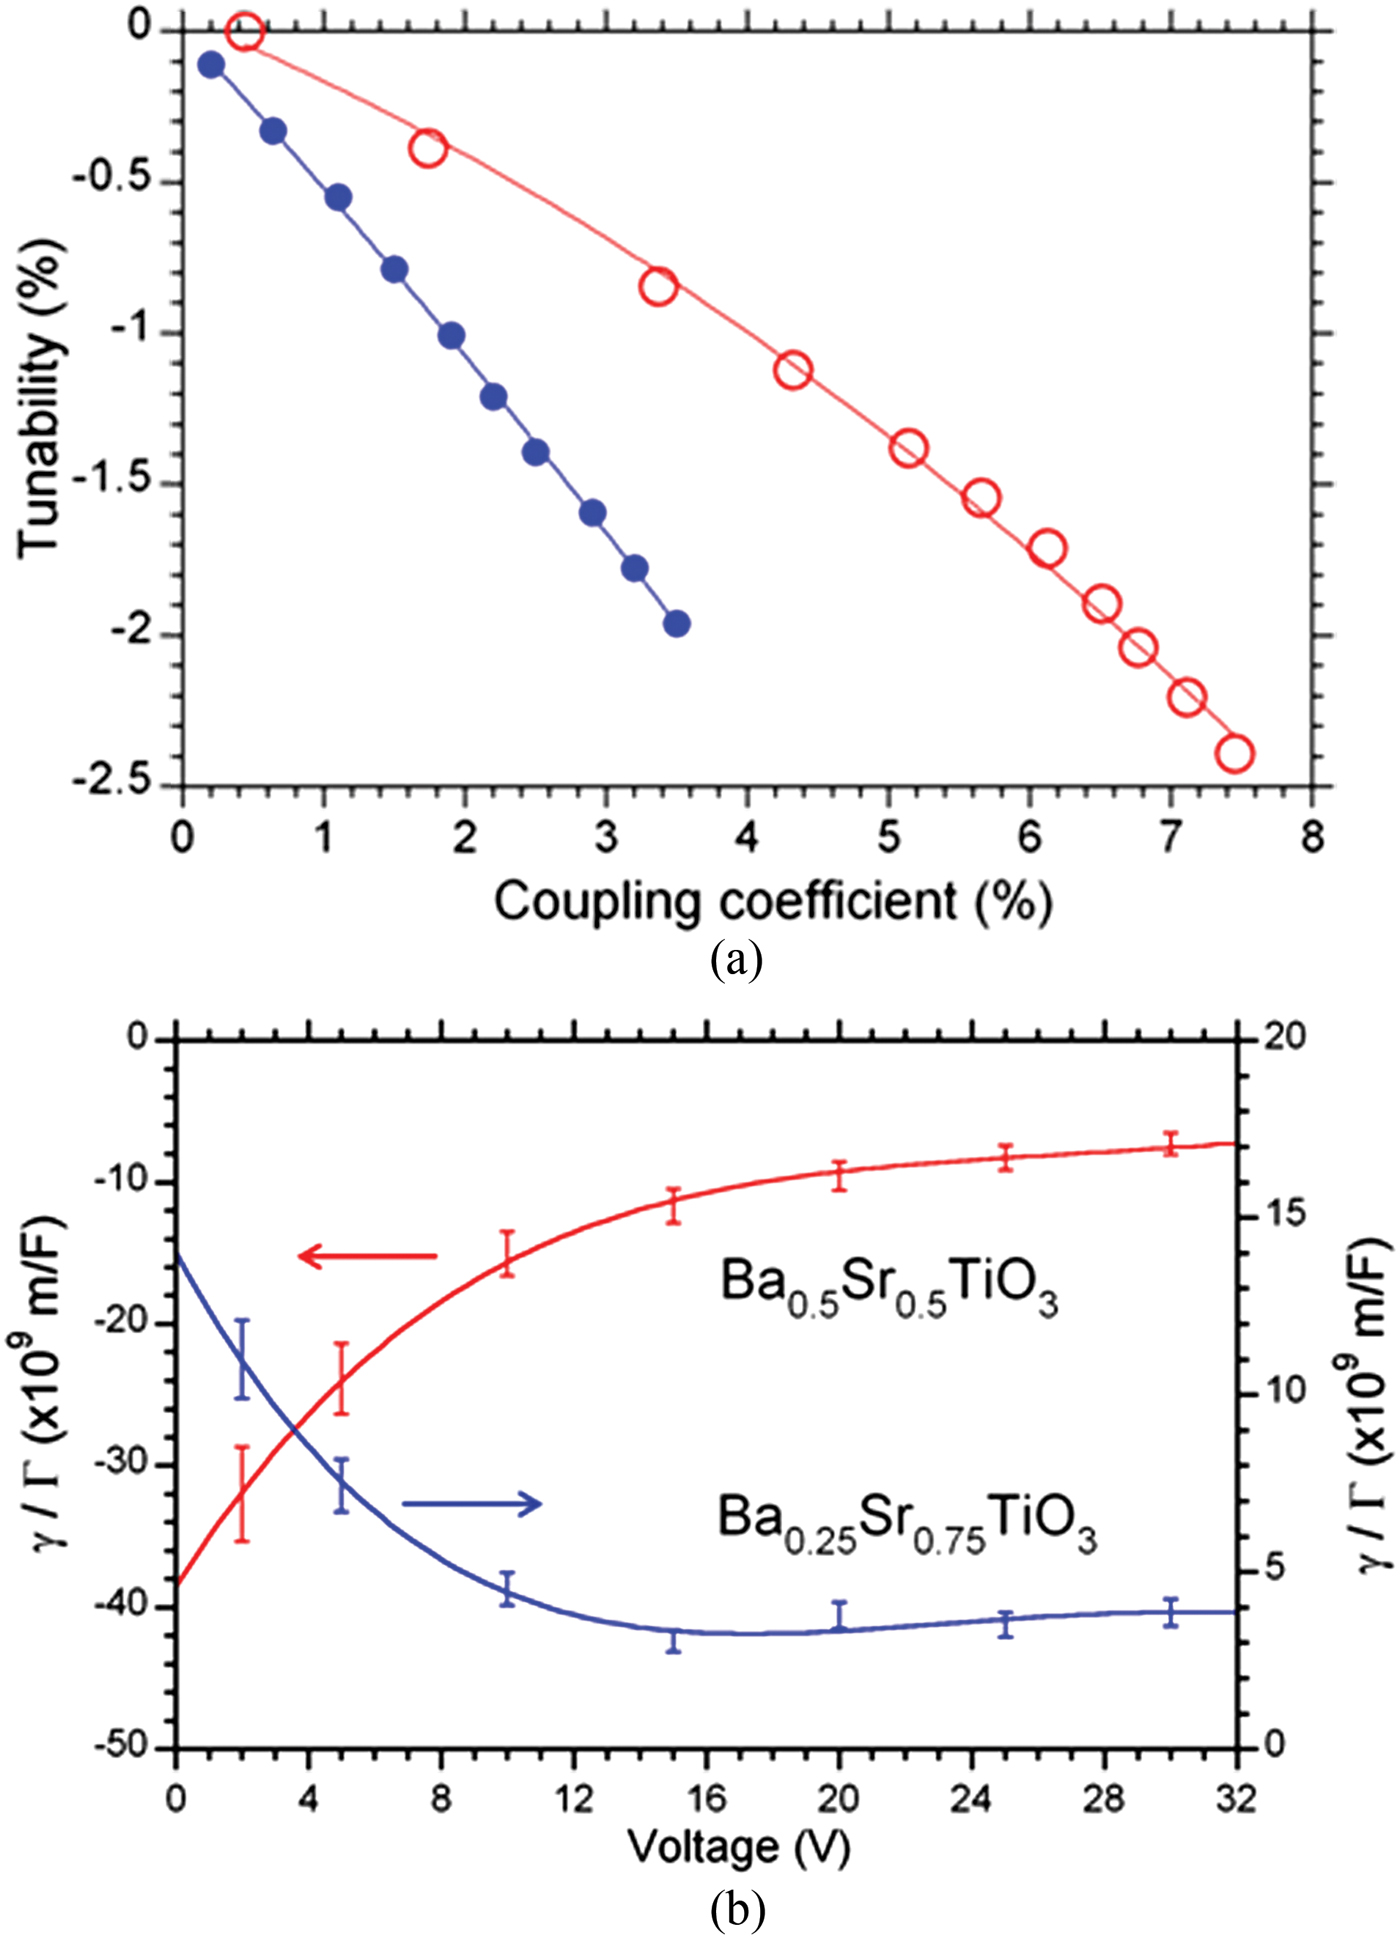
Figure 7(a) shows the tunability of series resonance frequencies of the Ba25 and Ba50 BAW–SMR plotted versus corresponding effective electromechanical coupling coefficients. It is assumed that the loaded tunability of resonance frequency and coupling coefficient are the same functions of electrode thickness and, hence, (6) and (7) are valid. It can be seen from Fig. 7(a) that the tunability of Ba25 BAW–SMR reveals a rather linear dependence. It was shown in [Reference Noeth, Yamada, Sherman, Muralt, Tagantsev and Setter15] that, at least for the BaxSr1−xTiO3 with x = 0.3, both γ and μ are of the same order of magnitude and both are much smaller than 1. This indicates that 4/πReference Sis, Lee, Phillips and Mortazawi2 is clearly the leading term in (6) giving the linear dependence of the tunability of series resonance frequency on the electromechanical coupling coefficient, which is in agreement with our experiments. The slope of the tunability calculated from the dependence on the coupling coefficient (Fig. 7(a)) is approximately 0.5, which is close to 4/πReference Sis, Lee, Phillips and Mortazawi2 ≈ 0.4. Thus, the measured dependence agrees well with the theoretical predictions. In addition, as it follows from (7), the much weaker field dependence of parallel resonance frequency, compared to the series resonance (Fig. 4a), may be explained by the low values of γ and μ.
(a) Tunability of series resonance frequency of the Ba25 (closed symbols) and Ba50 (open symbols) BAW–SMR versus effective electromechanical coupling coefficient. (b) Ratios γ/Γ of the Ba25 and Ba50 BAW–SMR calculated for (001) orientations.
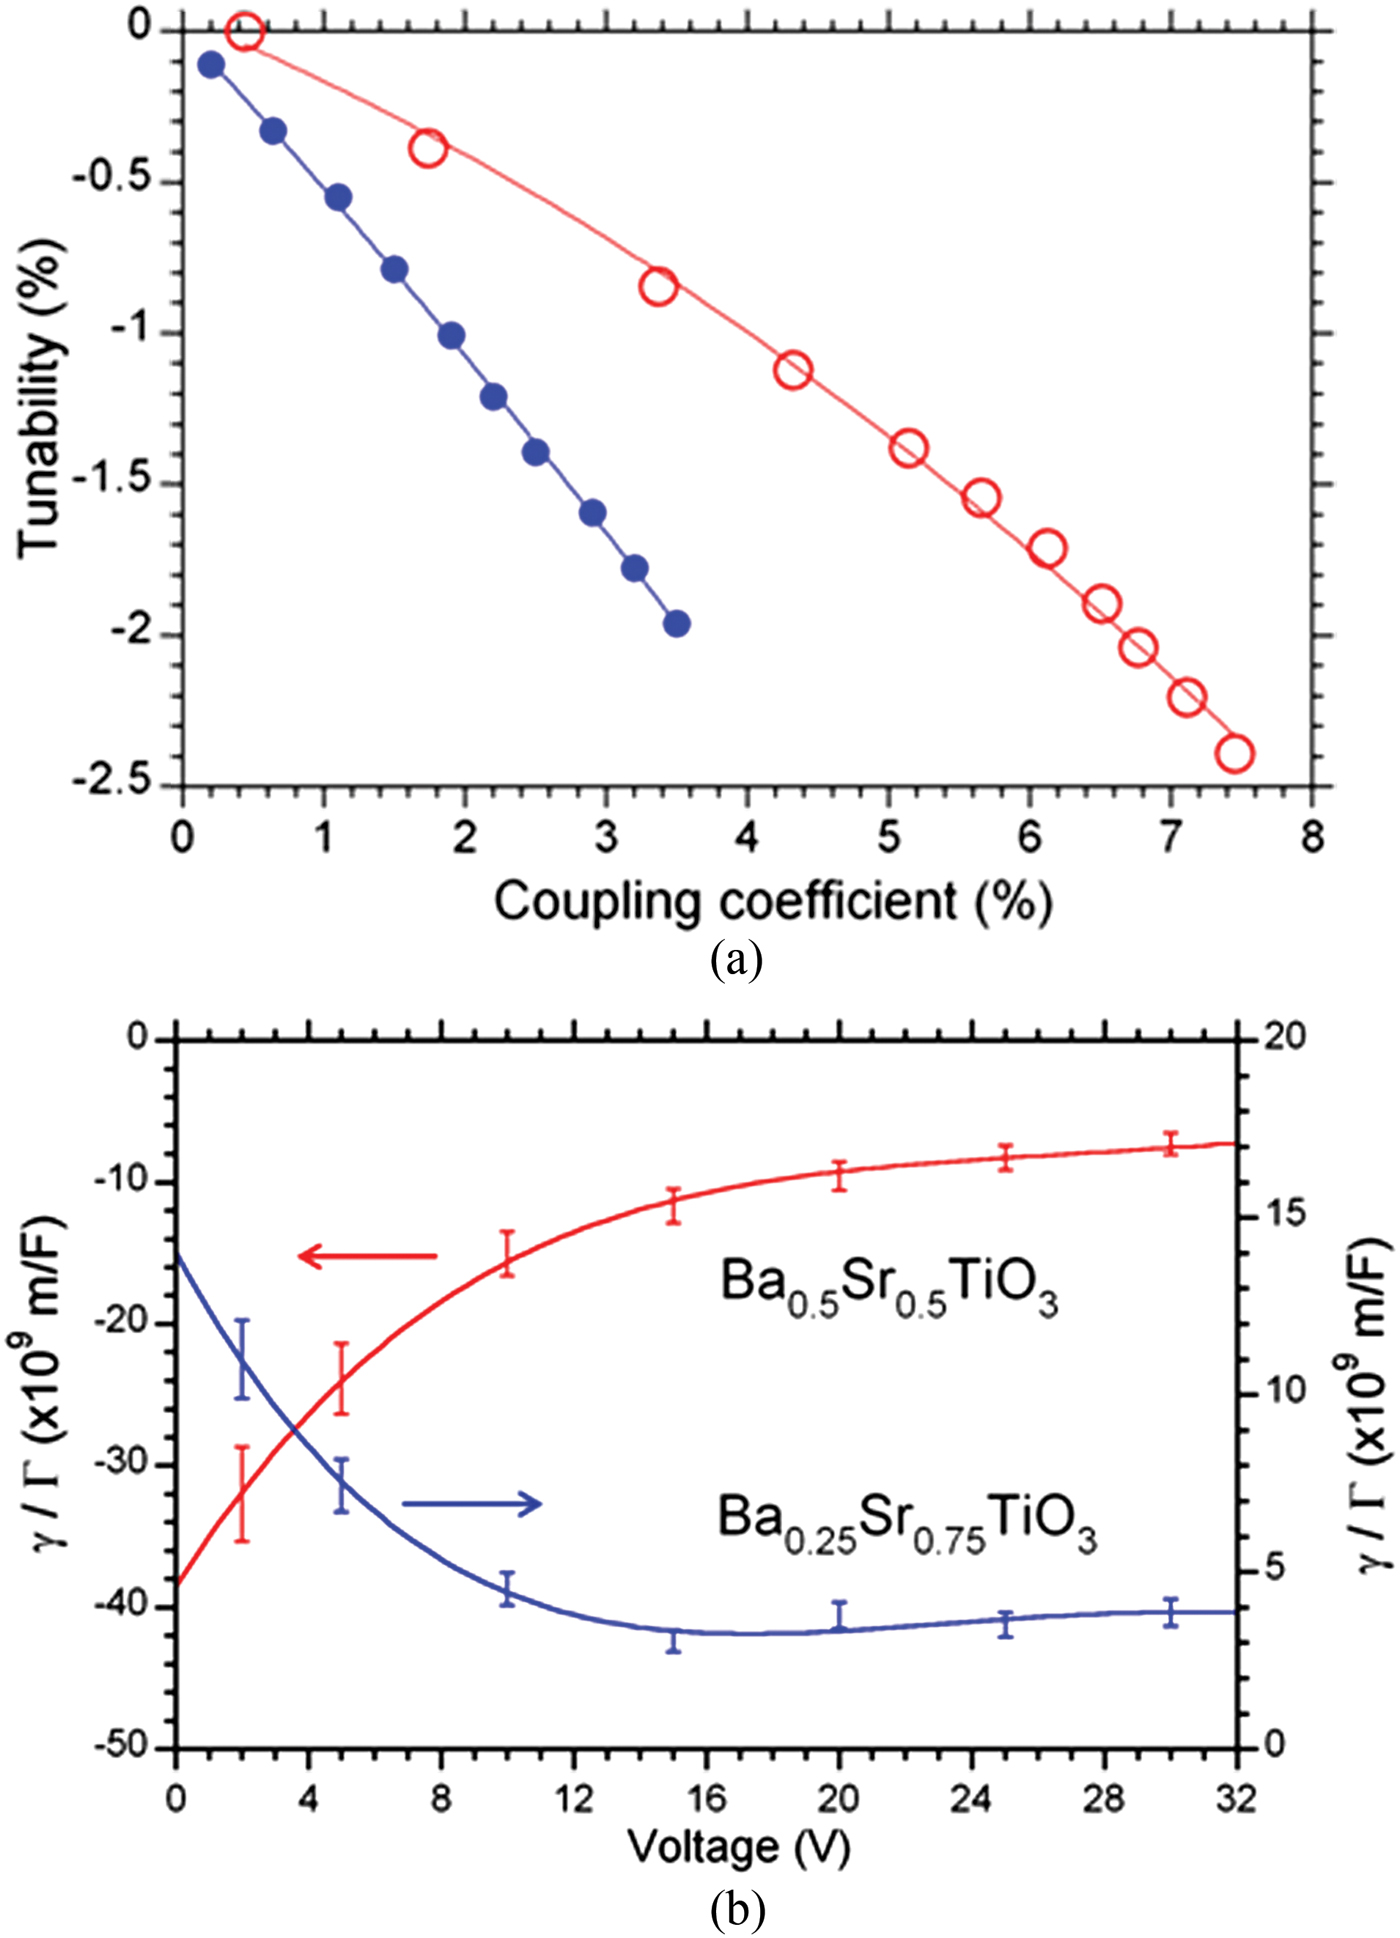
On the other hand, as can be seen from Fig. 7(a), the Ba50 BAW–SMR reveals a slightly nonlinear dependence with much lower slope. This can be explained by assuming that the component of the tensor of nonlinear electrostriction m is becoming negative and increases with Ba content. It should result in a reduction in the proportionality factor between the series resonance frequency and the coupling coefficient, see (6). The component m can be estimated using (6) and approximation (8) at the limit of low fields, i.e. when c approaches c 0. The parameter μ is calculated using the measured permittivity dependences, Fig. 5, and assuming ɛ b = 7 [Reference Noeth, Yamada, Tagantsev and Setter14]. Figure 7(b) shows the voltage dependences of the ratios between γ and Γ calculated using experimental dependences of the tunability of series resonance frequency on the coupling coefficient, see Fig. 7(a), and the corresponding components q for (001) orientation, see Table 1. The error bars represent the uncertainty of calculations which is governed mainly by uncertainties of resolving the resonance frequencies. The total relative error is calculated as addition in quadrature of errors in resonance frequencies and found to be 10.5%. The use of the error bars allowed for correct choice of the fitting curves, which are found to be fourth order polynomial functions. Extrapolation of the dependences in Fig. 7(b) to zero voltage gives the corresponding components of nonlinear electrostriction m. As can be seen, for the Ba25 composition m ≈ 1.3·1010 m/F while for the Ba50 m ≈ −4·1010 m/F. Thus, indeed, the Ba50 nonlinear electrostriction coefficient is negative and, approximately, 4 times larger. This explains the rather limited increase in the tunability of series resonance frequency of Ba50 BAW–SMR in comparison with the 2 times increase in the coupling coefficient (Fig. 4b). In addition, the larger and negative m explains the observed increase in parallel resonance frequency of Ba50 BAW–SMR with dc bias voltage (Fig. 4a).
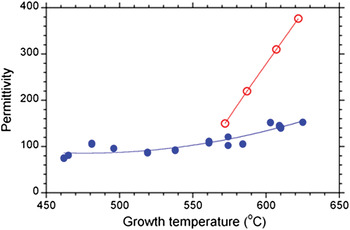
Thus, increase in Ba content of BSTO BAW–SMR from 25 up to 50% improves BAW–SMR tunability and coupling coefficient, which is associated mainly with increase in BSTO film permittivity and, hence, relative tunability of permittivity. However, the apparent permittivity strongly depends also on the growth conditions of the BSTO films; growth temperature, first of all. Figure 8 shows the permittivity of the Ba25 and Ba50 films versus the growth temperature. It can be seen that the permittivity increases with growth temperature for both BSTO compositions yet remains less than that of the bulk counterparts, which are approximately 450 and 900 for 25 and 50% of Ba concentration, respectively. Typically, permittivity of the thin films is less than that of the bulk due to higher defect density and several physical size effects. Our analysis indicates that the main effects responsible for reduction of BSTO films permittivity are associated with the formation of oxygen vacancies and bottom interfacial layer [Reference Vorobiev, Gevorgian, Löffler and Olsson7]. Increase in the growth temperature improves the BSTO film microstructure and, hence, increases permittivity. On the other hand, increase in the growth temperature may be limited by structural deterioration of the Bragg reflector and bottom electrode [Reference Vorobiev, Berge, Gevorgian, Löffler and Olsson10]. Therefore, optimization of the fabrication processes of the bottom electrode stack may allow further increase in the growth temperature and improvement of the tunable performance of Ba50 BAW–SMR since the film permittivity increases rapidly with growth temperature (Fig. 8).
Apparent permittivity of the Ba25 (closed symbols) and Ba50 (open symbols) thin films versus growth temperature.

D) BAW–SMR Q-factor
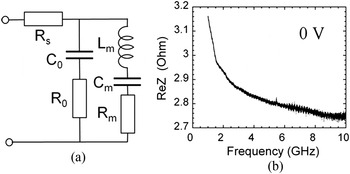
For the purpose of analysis of the Q-factor it is customary to distinguish between pure mechanical, dielectric, and electrical losses. In the modified Butterworth-Van Dyke (mBVD) circuit model (Fig. 9a) these losses are represented by resistors R m, R 0, and R s, respectively.
(a) The mBVD equivalent circuit of a BSTO BAW–SMR test structure. (b) The real part of impedance of a Ba25 BAW–SMR versus frequency at 0 V dc bias.

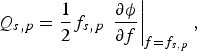
The series resistance R s in our BAW–SMR test structures is associated with the ring section of the Pt bottom plate interconnect conductor and contact resistance between Al pads and probe tips [Reference Vorobiev, Gevorgian, Löffler and Olsson7]. The Q-factors at series (Q s) and parallel (Q p) resonances are defined as [Reference Hashimoto9]:
 $$Q_{s\comma p} = \displaystyle{1 \over 2}f_{s\comma p} \,\left. {\displaystyle{{\partial \phi } \over {\partial f}}} \right\vert _{f=f_{s\comma p} }\comma \; $$
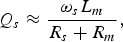
where φ is the phase angle. Applying (11) to the mBVD circuit impedance gives the following approximations [Reference Hashimoto9]:
 $$Q_s \approx \displaystyle{{\omega _s L_m } \over {R_s + R_m }}\comma \; $$
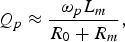 $$Q_p \approx \displaystyle{{\omega _p L_m } \over {R_0 + R_m }}\comma \; $$
where ω s,p = 2πf s,p. The purely mechanical Q-factor can be calculated, for example, from (12) as
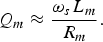 $$Q_m \approx \displaystyle{{\omega _s L_m } \over {R_m }}.$$
It can be seen from (12) that the purely mechanical Q-factor can be evaluated by using (11) at series resonance after de-embedding the series resistance R s from the real part of measured impedance Z, i.e.
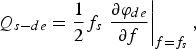 $$Q_{s - de} = \displaystyle{1 \over 2}f_s \left. {\displaystyle{{\partial \varphi _{de} } \over {\partial f}}} \right\vert _{f=f_s } {\rm\comma \; }$$
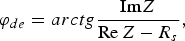 $$\varphi _{de} = arctg\displaystyle{{{\mathop{\rm Im}\nolimits} Z} \over {{\mathop{\rm Re}\nolimits} \,Z - R_s }}{\rm\comma \; }$$
where φ de is the de-embedded phase angle. It can be seen from (12) and (15) that the dielectric loss, represented by R 0, does not contribute to the total Q s (and Q s–de) values. Below we show that the R s can be estimated by analyzing the frequency dependence of the real part of impedance of BSTO BAW–SMR test structures measured without dc bias. In this case, without dc field, there is no motional branch since there is no piezoelectric effect and input impedance is
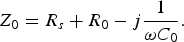 $$Z_0 = R_s+R_0 - j\displaystyle{1 \over {\omega C_0 }}.$$
The loss tangent of a BSTO capacitor can be expressed as tanδ = ωC 0R 0. On the other hand, it is known, that the extrinsic dielectric losses due to charged defects, normally dominating in the BSTO films, can be given as tanδ = Aω 1/3, where A is a function of a bias field [Reference Vorobiev, Rundqvist, Khamchane and Gevorgian16]. This leads to a rather simple form of the real part of impedance
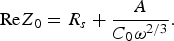 $${\mathop{\rm Re}\nolimits} Z_0=R_s+\displaystyle{A \over {C_0 \omega ^{2/3} }}.$$
Since permittivity of BSTO films is frequency independent up to the soft mode frequency (approx. 1 THz), the real part of impedance (18) tends to the R s at high enough frequencies. Our estimates indicate that the R s is frequency independent in the frequency range of interest since the skin depth is much larger than the thickness of the interconnect plates. Thus, the series resistance and dielectric losses can be distinguished. As an example, Fig. 9(b) shows the real part of impedance of the Ba25 BAW–SMR test structure versus frequency at 0 V dc bias. It can be seen that at frequencies above 8 GHz the real part of impedance is rather frequency independent and, hence, ReZ 0≈ R s which is ca 2.74 Ω.
Thus, the simple method given above allows establishment of R s and Q s–de. We have verified accuracy of the method by comparing R s with the value calculated correctly from the mBVD model (Fig. 9a). The effective electromechanical coupling coefficient defined by (2) can be connected to the mBVD model parameters as
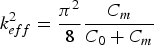 $$k_{eff}^2 = \displaystyle{{\pi ^2 } \over 8}\displaystyle{{C_m } \over {C_0+C_m }}$$
than the motional capacitance and inductance can be found using the following associations:
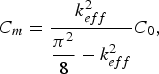 $$C_m = \displaystyle{{k_{eff}^2 } \over {\displaystyle{{\pi ^2 } \over 8} - k_{eff}^2 }}C_0\comma \; $$
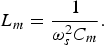 $$L_m = \displaystyle{1 \over {\omega _s^2 C_m }}.$$
Furthermore, the dc bias dependent dielectric capacitance and resistance can be expressed through the loss tangent measured at a dc bias but at frequency ω well below resonances as
 $$\tan \delta _V = \omega C_0 \lpar R_0 + R_s \rpar .$$
Solving a system of linear equations (12), (13), and (22) leads to
 $$R_s = \displaystyle{1 \over 2}\left[{L_m \left({\displaystyle{{\omega _s } \over {Q_s }} - \displaystyle{{\omega _p } \over {Q_p }}} \right)+\displaystyle{{\tan \delta _V } \over {\omega C_0 }}} \right]\comma \; $$
and allows for determining all parameters in the mBVD model. As an example, the parameters of the Ba25 BAW–SMR test structure measured at 50 V dc bias are summarized in Table 2. The capacitance C 0 and loss tangent tanδ V are measured at a frequency of 1 GHz. It can be seen that the R s value 2.5 Ω is in good agreement with that found at the high frequency limit of the real part of impedance 2.74 Ω (see Fig. 9(b)).
The mBVD parameters of a Ba25 BAW–SMR test structure at 50 V dc bias.

In addition, the measured one-port reflection coefficient data were fit to the mBVD model using Agilent's ADS software. The best fit loop resulted in the R s value 2.8 Ω, which also confirms our method of the R s evaluation [Reference Vorobiev, Gevorgian, Löffler and Olsson7]. From the device application point of view it is important to analyze the origin of the electric loss. As was mentioned, the series resistance R s in our BAW–SMR test structures is associated with the probe contacts and interconnects leading to a resonator. The interconnect part of the R s is composed mainly of a ring section of the Pt bottom plate R ring which is defined by the Pt sheet resistance R pt. We have measured the R pt by the 4-point probe technique and found that R ring ≈ 0.7 Ω, which indicates that the major part of the R s (ca 2.0 Ω) is associated with the contact resistance between the probe tips and the Al electrodes of BAW–SMR test structures. This indicates that the R s is rather an artifact of the measurements but not an intrinsic BAW–SMR parameter. In a more complex BAW–SMR design, with Au leading electrodes, the R s can be reduced below R m and, correspondingly, the Q s can approach the Q m values.
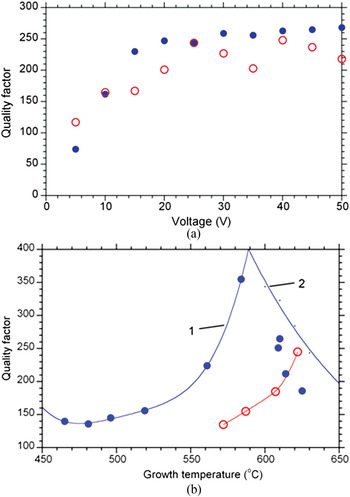
Figure 10(a) shows typical field dependences of the quality factors of the Ba25 and Ba50 BAW–SMR calculated using (15). The quality factor increases at low fields due to the nature of the field-induced piezoelectric effect. The purely mechanical Q-factor calculated using (14) and data from Table 2 gives Q m ≈ 250 at 50 V dc bias, which is in very good agreement and validates the method of Q-factor evaluation. It can be seen that above 20 V the Ba50 BAW–SMR reveals Q s–de ≈ 230 which is slightly lower than that of the Ba25 BAW–SMR, Q s–de ≈ 260.
(a) Quality factors of the Ba25 (closed symbols) and Ba50 (open symbols) BAW–SMR versus dc bias voltage. (b) Quality factors of the Ba25 (closed symbols) and Ba50 (open symbols) BAW–SMR versus growth temperature. Line 1 is a polynomial curve fit. Line 2 is a simulated quality factor, taking into account loss associated with scattering by surface roughness [7].

It can be shown that the Q-factor of our BAW–SMR is limited significantly by the BSTO film surface roughness. The surface roughness is responsible for extrinsic acoustic loss due to wave scattering at reflection from rough interface. This loss mechanism assumes redirection of vertically moving acoustic waves toward lateral directions. This causes the waves to leave the active resonator region and dissipate either in the device substrate or in the region surrounding the device laterally [Reference Hashimoto9]. For a single reflection act and lateral roughness scale much smaller than the wavelength, the attenuation coefficient can be approximated in dB as [Reference Alekseev, Mansfel'd, Polzikova and Kotelyanskii17]:
 $$\alpha _{dB} = 2\pi 8.68k^2 \eta ^ 2 {\rm dB\comma \; }$$
where k = 2π/λ is the longitudinal wave number, λ is the wavelength and η is the rms roughness. Using general definition of the Q-factor as the ratio between energy stored and energy dissipated per cycle, the Q-factor of BAW–SMR, associated with wave scattering at top interface only, can be calculated as:
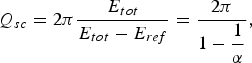 $$Q_{sc} = 2\pi \displaystyle{{E_{tot} } \over {E_{tot} - E_{ref} }}=\displaystyle{{2\pi } \over {1 - \displaystyle{1 \over \alpha }}}{\rm\comma \; }$$
where E tot and E ref represent the energies of incoming and reflected acoustic waves, respectively, α = E tot/E ref is the attenuation coefficient and logα = 0.1α dB. Assuming that the wavelength equals the double thickness of the ferroelectric film and electrodes λ = 980 nm, using (25) and the measured BSTO film surface roughness, obtained by analysis of the AFM images, Fig. 3, one can readily get Q sc ≈ 530 and Q sc ≈ 380 for the Ba25 and Ba50 BAW–SMR, respectively. These simple calculations overestimate the Q-factor since they take into account only reflection from top interface. Thus, comparing with the measured values (Fig. 9a) one can conclude that the scattering loss is roughly on par with all other loss contributions.
Figure 10(b) shows quality factor of the Ba25 and Ba50 BAW–SMR, calculated using (15), versus the BSTO film growth temperature. It can be seen that the Ba50 BAW–SMR Q-factor increases smoothly with growth temperature which can be explained by improvement of the BSTO film microstructure, such as decrease in the density of the oxygen vacancies, thickness of the interfacial amorphous layer, and texture misalignment [Reference Vorobiev, Gevorgian, Löffler and Olsson7]. These result in decrease of the corresponding extrinsic acoustic losses. At highest growth temperature the Q-factor is apparently limited by the increased surface roughness caused by formation of TiO2 heterogeneous enclosures [Reference Vorobiev, Gevorgian, Löffler and Olsson7, Reference Vorobiev, Berge, Gevorgian, Löffler and Olsson10, Reference Löffler, Vorobiev, Zeng, Gevorgian and Olsson18]. The higher Q-factor values of Ba25 BAW–SMR at lower growth temperatures, see Fig. 10(b), can be associated with different bottom electrode stack structures having only 10-nm-thick W adhesion layer [Reference Vorobiev, Berge, Gevorgian, Löffler and Olsson10, Reference Löffler, Vorobiev, Zeng, Gevorgian and Olsson18].
IV. CONCLUSION
It is demonstrated that increase in Ba content of BSTO BAW–SMR from 25 to 50% results in more than two times increase in the BAW–SMR electromechanical coupling coefficient and 25% increase in the tunability of series resonance frequency. The Ba0.5Sr0.5TiO3 BAW–SMR reveal electromechanical coupling coefficient of 7.5% and the tunability of series resonance frequency of 2.4%. Analysis based on the theory of dc field induced piezoelectric effect in paraelectric phase ferroelectrics confirms that the improvement is associated with an increase in BSTO relative tunability of permittivity 1.5 times from 55 to 85% at 50 V dc bias. Simulations show that there is rather strong anisotropy in the BSTO field-induced piezoelectric effect with the highest coupling coefficient in the (001) direction. Thus it may be assumed that in our (111) textured BSTO films the field induced piezoelectric response is governed mainly by the minor (001) phase.
The tunability of series resonance frequency of Ba0.5Sr0.5TiO3 BAW–SMR is limited by relatively high and negative nonlinear electrostriction coefficient which is found to be m ≈ −4 × 10¹⁰ m/F. The Ba0.5Sr0.5TiO3 BAW–SMR Q-factor is relatively high, up to 250 at 5.3 GHz. However, the Q-factor is limited significantly by extrinsic acoustic loss associated with wave scattering at reflection from relatively rough top interface. The results of analysis clarify the ways of further improvement of tunable BSTO BAW–SMR performance. The tunability of resonance frequency and coupling coefficient can be further increased by growing predominantly (001) oriented BSTO films using, for example, appropriated templates and/or growth conditions. The Q-factor can be increased by decreasing the surface roughness via development of the bottom electrode stack structure and fabrication technology with the aim to prevent its deterioration during high temperature growth of the BSTO film.
ACKNOWLEDGEMENT
This work is partially supported by the Swedish Research Council projects 2009–3460 and 2011–4203.
 Andrei Vorobiev received the M.Sc. degree in Physics of Semiconductors and Dielectrics from Gorky State University, Gorky, Russia, in 1986 and received his Ph.D. degree in Physics and Mathematics from the Institute for Physics of Microstructures of Russian Academy of Sciences (IPM RAS), Nizhny Novgorod, Russia, in 2000. In 2008, he received title of Associate Professor in physical electronics from Chalmers University of Technology, Göteborg, Sweden. He now holds a research chair at Chalmers University of Technology. His main research interests are in the area of development and application of emerging functional materials and phenomena in microwave components and devices based on multiferroic and ferroelectric thin films including development of materials, thin film and microtechnology fabrication/processing steps and experimental investigation.
 Spartak Gevorgian received the M.S. degree in radioelectronics from Yerevan Polytechnic Institute, Yerevan, Armenia, in 1972, and the Ph.D. and Dr. Sci. degrees from Electrotechnical University, St. Petersburg, Russia, in 1977 and 1991, respectively. From 1993 to 1998, he held research positions with Chalmers University of Technology, Göteborg, Sweden. Since 1998, he has been a Professor with Chalmers University of Technology. Since 1996, he has also worked part time with Ericsson Microwave Systems AB (currently Ericsson AB), Mölndal, Sweden. He has authored or coauthored over 300 papers and conference presentations. He holds over 30 patents/patent applications. His research interests are physics, design, and experimental investigation of microwave devices and components based on ferroelectrics, silicon RF integrated circuits (RFICs), and monolithic microwave integrated circuits (MMICs), microwave photonic devices (optically controlled components), and modeling of passive coplanar components based on conformal mapping.