1 Introduction
In 1995, Italy adopted a notional defined contribution (NDC) formula in its PAYGO system that was to have significant consequences both from the macroeconomic point of view – sensibly improving long-term balance between pension expenditure and social security contributions – and from the microeconomic point of view – by affecting the future income distribution of retirees along with individuals' future retirement decisions.Footnote 2 In the economic literature, the NDC system is considered to be ‘actuarially fair’ (or fairer than a defined benefit (DB) system; see Lindbeck and Persson, Reference Lindbeck and Persson2003) because it equalizes the (expected) actuarial present value of benefits (PVB) to the (expected) actuarialpresent value of contributions (PVC).
Under the Italian version of the NDC system, once a worker reaches the age of retirement, his/her (notionally)Footnote 3 cumulated contributions are converted into a stream of monthly benefits according to a factor that takes account of official forecast of average life expectancy.Footnote 4 However, since ex-post the PVB depends on actual life expectancy at retirement, then equivalence between PVC and PVB – among individuals belonging to a certain generation – will only be seen in the case of those who happen to live as long as the average individual does. For the others, the system is ‘unfair’, in the sense that those pensioners who die earlier than the mean will incur a ‘waste’ of resources, while those who die later will benefit from a ‘gain’.Footnote 5 This should come as no surprise given the inherently insurance-based nature of the NDC system. However, if life expectancy is affected by socio-economic determinants such as educational level, gender and occupational status, there may be a systematic, albeit unintended, redistribution of lifetime resources among different categories of the population.
The aim of this paper is to employ a financial measure to assess the extent of this phenomenon in a representative sample of the Italian population consisting of individuals born between 1975 and 2000, whose pension benefits will be computed under the newregime (NDC) introduced in 1995. In order to do so, we are going to use CAPP_DYN, a dynamic microsimulation model developed to investigate the long run distributive impact of reforms in the Italian pension system (Mazzaferro and Morciano, Reference Mazzaferro and Morciano2008). Actuarial fairness of the Italian NDC system will be evaluated by applying a new mortality module that explicitly takes into account the estimated differences in mortality due to educational attainment.
After a review of the empirical literature on differential mortality and pension systems, the paper presents our estimated differential mortality tables for Italy. In order to assess the redistribution of lifetime resources in the presence of differential mortality rates, we then compute the net present value ratio (NPVR), defined as the ratio between the PVB and the PVC for each individual within the sample. In controlling for educational level and for quintiles of average indexed yearly income,Footnote 6 we find that the Italian NDC system determines a substantial regressive redistribution of lifetime resources within each cohort and between genders of the sample.
These findings pose a problem from the economic policy point of view, since the NDC system ends up transferring the lifetime resources from the poor, less well-educated people to the rich, highly educated individuals: this result not only negates the progressiveness of the system but also its alleged neutrality.
2 Education and differential mortality
The literature on differential mortality and its distributive effects has grown rapidly in recent years. A comprehensive survey of the implications of differential mortality on pension systems is Whitehouse and Zaidi (Reference Whitehouse and Zaidi2008). A common result of this literature is that death probabilities are inversely correlated with an individual's social and economic status. Factors such as race, education and occupational status are frequently used as a proxy of the economic status. None of them is free from criticisms and probably each of them captures important aspects.
In this paper, we focus our attention on the role of education. From a conceptual point of view, education captures both direct and indirect effects on life expectancy. On the one hand (direct effect), it synthesizes the human and cultural capital owned by individuals: ‘virtuous’ forms of behaviour (such as foresight, patience in delaying satisfaction, awareness of some dangerous habits such as smoking) are more likely to be associated with high-school attainments. On the other hand (indirect effects), educational level can be interpreted as a proxy of an individual's lifetime resources. The most important advantage of using schooling information as a proxy of economic status is that education is generally a time invariant variable and is less affected (relative to income or occupational status) by problem of reverse causation.Footnote 7
A number of studies found empirical evidence that higher levels of education reduce mortality and increase life expectancy (Preston and Elo, Reference Preston and Elo1995; Brown, Reference Brown, Feldstein and Liebman2002; Deaton and Paxson, Reference Deaton and Paxson2004; Huisman et al., Reference Huisman, Kunst, Andersen, Bopp, Borgan, Borrell, Costa, Deboosere, Desplanques, Donkin, Gadeyne, Minder, Regidor, Spadea, Valkonen and Mackenbach2004, among others). By using data from the National Longitudinal Mortality Survey, Preston and Elo (Reference Preston and Elo1995) found that the annual mortality rateFootnote 8 for American males aged 65–74 years in the lowest educational class (<7 years of education) is 4.2% compared with 2.7% for those in the highest class (>13 years); women's figures are, respectively, 2.4% and 1.4%. Brown (Reference Brown, Feldstein and Liebman2002), after having computed ad hoc group-specific mortality tables, finds that life expectancy at the age of 22 years is 80.5 years for white male graduates, but only 75.5 years for white men who dropped out before reaching the high school diploma. A similar divergence can be found within other gender and racial groups. Nelissen (Reference Nelissen1999) investigated the Dutch case. Although the Netherlands are among those countries with the lowest differential mortality rates, he estimates that highly educated people have a life expectancy at birth that is 4.5 years higher than that of the poorly educated. Kunst et al. (Reference Kunst, Geurts and Van Der Berg1995) find that inequalities in mortality are relatively small in the Netherlands, Sweden, Denmark and Norway. They appear to be much more pronounced in the United States, France and Italy, while England, Finland and Wales are in an intermediate position. In a comparative study covering information on 11 European populations, Huisman et al. (Reference Huisman, Kunst, Andersen, Bopp, Borgan, Borrell, Costa, Deboosere, Desplanques, Donkin, Gadeyne, Minder, Regidor, Spadea, Valkonen and Mackenbach2004) found that a negative correlation between the level of education and mortality in six of these countries. In the same study, the link is weaker for women than for men.
Unfortunately no national longitudinal survey on differential mortality rates across socio-economic groups has ever been carried out in Italy.Footnote 9 However, in 2002, the Italian National Institute of Statistics (ISTAT) published the second edition of a transversal study (ISTAT, 2001). This survey uses 1981 and 1991 census data, and although it does not provide differentiated mortality tables, it estimates crude and standardized mortality rates according to age groups.Footnote 10 At a glance, the ISTAT study reveals that the mortality differential per educational level is substantial in northern Italy and within the first age category (18–59): let 100 be the average standardised rate, regardless of education; an illiterate man scores a rate of 188, while a graduate of the same age scores only 47. For young northern Italian men, mortality rates at the bottom end of the educational scale are four times as high as those at the top (ISTAT, 2001, p. 17 onwards). In broader terms, the relationship between men's education and their mortality is ‘regular’: it favours university and high school graduates (the respective scores are: 172 for illiterates, 102 for those with a lower secondary school education and 52 for graduates; elderly people show an analogous trend, albeit to a smaller extent). The same phenomenon among women is slightly different: gaps are far smaller (for example, the difference between a university and a secondary-school education is minimal in the case of the young and negligible in the case of the elderly).Footnote 11
An attempt to analyse life expectancy at a certain age by an individual's level of education was made by Maccheroni (Reference Maccheroni2008). He used death certificates and census data as sources of information, and adopted econometric techniques to obtain differentiated mortality tables. Maccheroni finds that the difference in life expectancy at 35 years between individuals with a higher education and those with a basic education is 7.6 years in the case of men and 6.5 years in the case of women; while at the ageof 65 years, these values are, respectively, 5.5 and 5.3 years. According to Maccheroni, once again, the figures for men are in keeping with those shown by international studies, while differential mortality among Italian women appears to be higher than that previously estimated (ISTAT, 2001; Candela et al., Reference Candela, Cavuto and Luberto2005). A recent study on differential mortality by income in Italy is provided by Leombruni et al. (Reference Leombruni, Richiardi, Demaria and Costa2010). This research is based on WHIP (Working History Italian Panel) data and reports evidence of limited relative risks by socio-economic status. However, due to data limitations, Leombruni et al. (Reference Leombruni, Richiardi, Demaria and Costa2010) cannot properly quantify life expectancy at retirement by socio-economic conditions.
3 Mortality, progressivity and redistribution in pension systems
Evaluating the lifetime redistribution operated by a pension system needs the adoption of some measure able to capture – from the individual's point of view – the money's worth of participating to the pension system. We opt for the NPVR, defined as the ratio of the PVB received, to the PVC paid during an individual's lifetime. Therefore, the NPVR for pensioner i evaluated at retirement age R i can be written as
 $${\rm NPVR}_{i} \equals {{{\rm PVB}_{i} } \over {{\rm PVC}_{i} }} \equals {{\sum\nolimits_{s \equals R_{i} }^{T_{i} }\; {\textstyle{{P_{is} } \over {\lpar 1 \plus r\rpar ^{s \minus R_{i} } }}}} \over {\sum\nolimits_{t \equals a_{i} }^{R_{i} \minus \setnum{1}} C_{it} \lpar 1 \plus r\rpar ^{R_{i} \minus t} }}\comma $$
where a i is the age at which pensioner i enters into the labour market, R i is the retirement age, T i the pensioner's death age, C it is the contribution paid in year t, P is is the pension benefit received in year s and r is the real discount rate.
The denominator of this indicator can be seen as the premium an individual pays in order to purchase an annuity that lasts as long as the individual remains alive (Brown, Reference Brown, Feldstein and Liebman2002). The interpretation of (1) is straightforward: if NPVR equals 1, in actuarial terms the individual receives the same amount of money that he/she has paid in as social security contributions. If NPVR is higher (lower) than 1, the individual faces an expected gain (or loss).
An alternative – but related – measure could have been the Social Security Wealth (SSW), defined as the difference between PVB and PVC. However, while SSW is expressed in absolute terms, NPVR is scale invariant and allows comparing gains and losses from the social security for individuals with different income profiles and retirement ages (Borella and Coda Moscarola, Reference Borella and Coda Moscarola2006).
Another frequently used measure of convenience is the internal rate of return (IRR), defined as the rate that makes the PVC equal to the PVB.Footnote 12 There exists a precise relation between the IRR and the NDC system, in which the IRR is always equal to the rate of growth of the salary bill or to the GDP rate of growth. As such, in steady state equilibrium, the dynamic of pension benefits expenditure is consistent with the one of contributions. This also implies that, if the salary bill (or GDP) rate of growth is used as discount rate in formula (1), then the NPVR in an NDC system is equal to 1.Footnote 13 IRR could be preferred to NPVR, as it endogenously determines the rate of return that equalizes PVC and PVB, whereas NPVR requires an arbitrary choice for the discount rate. However, NPVR has some important advantages: it is very easy to compute since it does not require recursive methods for its estimation, it better suites sensitivity analysis and allows to compare the convenience of the social security benefits with respect to an exogenous return.
The relationship between differential mortality and returns from the Social Security system has been studied above all in the United States. The public pillar of the U.S. pension system is formally progressive: it combines a proportional payroll taxFootnote 14 with a benefit formula that replaces a higher share of earnings for workers with low lifetime earnings. However, part of this progressivity can be offset by differential mortality: once the latter has been taken into account, can the system still be considered progressive? Liebman (Reference Liebman, Feldstein and Liebman2002) analyses the 1925–1929 cohort and estimates the IRR by gender, race and education. With respect to the case of uniform mortality, introduction of differential mortality rates has significant effects on the IRR of those people with higher mortality rates, such as black people and the poorly educated. Highly educated people are the only ‘winners’ when the criterion of differential mortality is applied as their IRR increases from 1.35 to 1.46%. Liebman also classifies individuals by average indexed monthly income, defined as lifetime earnings divided by the number of years characterized by positive earnings: he finds that the top and bottom quintiles receive, respectively, an NPVRFootnote 15 of 0.86 and 1.41 with uniform mortality rates, while with group-specific mortality rates these figures become 0.87 and 1.38. Therefore, all things being equal, differential mortality ends up redistributing money from low-income, poorly educated people to those with both high incomes and higher educations. Brown (Reference Brown, Feldstein and Liebman2002) focuses on the redistribution that occurs within an NDC system, which is very similar to the Italian pension system introduced in 1995. He finds that such a system determines a large transfer of resources from men to women: because of different mortality rates, for every dollar paid to purchase the annuity, a man can expect to receive 92 cents, while a woman can expect $1.076. Large gaps also arise within racial groups: for example, there is a 10 percentage points difference between the top and bottom educated white males, a 6 points difference between similar categories of white females, and 11 and 8 points, respectively, between similar categories of black males and females. The result of all this is that black men who never made it as far as high school are the biggest ‘losers’ (NPVR = 0.800), while white female graduates are the biggest ‘winners’ (NPVR = 1.106). Harris and Sabelhaus (Reference Harris and Sabelhaus2005) find that overall the U.S. social security system is progressive in the sense that it redistributes lifetime resources from the rich to the poor part of the population. The progressivity of the benefit formula more than offsets the regressive effect of differential mortality.
Outside the U.S., Nelissen (Reference Nelissen1999) estimates that a Dutch individual with a limited education (compared to the average individual) faces a loss of 6% in his/her permanent income (lifetime earnings plus pension benefits). Whitehouse and Zaidi (Reference Whitehouse and Zaidi2008) use Huisman et al. (Reference Huisman, Kunst, Andersen, Bopp, Borgan, Borrell, Costa, Deboosere, Desplanques, Donkin, Gadeyne, Minder, Regidor, Spadea, Valkonen and Mackenbach2004) results on differential mortality to compute annuity factors for low- and high-educated men and women in six European countries (Austria, Belgium, Finland, Norway, Switzerland and United Kingdom). They find that differentials are larger for men than they are for women. Austria appears to be the country where such differences are stronger: the pension for a low-educated man is worth 90% of that for a man with higher education levels.
Turning to Italy, Caselli et al. (Reference Caselli, Peracchi, Balbi and Lipsi2003) study the link between life expectancy and conversion factorsFootnote 16 in the Italian NDC system. Their paper considers the impact on the conversion factor of a decline in elderly mortality over the next decade. It also estimates to what extent gender- and region-specific conversion factors may differ from the currently legislated values. Belloni and Maccheroni (Reference Belloni and Maccheroni2006), adopting a representative agent approach, develop cohort and gender mortality projections and use such estimates to evaluate the actuarial fairness of the conversion factors. They compare the evolution of the NPVR for some representative cohorts of Italian workers under the current legislation scenario and an actuarial benchmark scenario where conversion factors are computed using their mortality estimations. They find that using cross-sectional (consistently with the current legislation) instead of longitudinal mortality tables (consistent with a more actuarially neutral system) causes a gain for future pensioners roughly equal to 6 percentage points of NPVR.
4 The Italian pension system: a short review of the reform process
The (theoretical) long-term characteristics of the Italian pension system have been radically modified during the reform process started in 1992. Before the reforms, the system was based on a DB mechanism: pension benefits were determined multiplying pensionable earnings by the number of working years and by an accrual rate. Numerous schemes – each one with its own rule – were in place at the same time producing great heterogeneity in pension treatments.
The pension formula for the main scheme, the one of the dependent workers, can be approximately represented as:
 $$P_{{\rm DB}} \equals \alpha \cdot N \cdot W\comma $$
where α is the accrual rate, N is the seniority at retirement and W is the pensionable earnings.
The system was unanimously considered financially unsustainable and unfair from a distributive point of view (Fornero and Castellino, Reference Fornero and Castellino2001; Sartor and Franco, Reference Sartor, Franco, Holzmann and Palmer2006). The formula in equation (2) does not contain any form of actuarial adjustment with respect to the choice of the age of retirement. Moreover as W was computed as the average value of earnings recorded over the last 5 years before retirement the formula favoured steeper earnings carriers with respect to the flatter ones. Finally, civil servants, self-employed and workers in some other minor schemes were guaranteed more generous rules with respect to the main scheme. Some redistributive elements were allowed. In particular α was equal to 2% for the pensionable earnings bracket between 0 and 42,111 Euro and decreased with earnings level down to 1.1% for the pensionable earnings bracket over 55,976 Euro. A minimum pension benefit was guaranteed to all workers with at least 15 years of contributions, whose accrued benefit was below a certain level.
Under the pressure of the financial crisis of the Italian currency (Lira) and of the urgency to cut public deficit, the first step of the reform process was a standard parametric one (the so-called ‘Amato reform’) which: (i) increased progressively legal retirement age, (ii) increased the number of years over which the pensionable earnings were to be computed; (iii) cut accrual factors in the pension formula; (iv) modified the indexation of pension benefits linking their growth to inflation in lieu of earnings. Besides, the reform began a gradual harmonization of pension rules among categories.
Three years later, the Italian Parliament approved a law (L.335/95) that introduced an NDC system that linked more closely an individual's contributions with pension benefits and crediting future benefits with a sustainable rate of return: the contributions are (fictitiously) accumulated in an individual fund, and are revaluated in line with a moving average of GDP growth. The pension benefits are computed multiplying the revaluated contributions with a coefficient conditional on life expectancies at retirement. Such coefficients, uniform by sex and dynamically updated every 3 years in order to take into account official life expectancies projections of new and future cohorts, allow the system to be (on average) almost actuarially fair among individuals belonging to the same sex and cohort. The retirement age was made flexible from 57 to 65 years conditioning on a matured pension benefit higher than 1.2 times the minimum old age allowance.Footnote 17
In formal terms, the value of the first-year old age pension benefit can be represented as follows:
 $$P_{{\rm NDC}} \equals D_{R} \cdot MC_{R} $$
where D R is an age-related conversion factor;Footnote 18MC R is the total of contributions accrued at the age R during the whole working life capitalized at the rate of growth of GDP according to the formula:
 $$MC_{R} \equals \mathop{\sum}\limits_{t \equals a}^{R \minus \setnum{1}} c_{t} W_{t} \lpar 1 \plus r\rpar ^{R \minus t} \comma $$
where a is the age at which an individual enters into the labour market; R is the age of retirement; r is the rate of growth of GDP; c t is the contribution rate to the pension scheme and W t is the gross earning in year t. The contribution rate c is set at 33% for employees and 20% for self-employed workers. A contributory cap is set at 85,404 yearly Euros for 2011. At least 5 years of positive contributions have to be paid in order to fulfil the condition to receive an old age pension.
The transitional path from the DB formula to the NDC one is very slowly designed. The new formula will be completely phased in for those who entered the labour market after 1995 only. Current and future workers were divided into three groups with substantially different pension expectations. For workers who had contributed to their scheme at least 18 years at the end of 1995, their pension benefit is computed with the old DB formula. For those who entered the labour market before 1995 but had less than 18 years of service at that date, a pro-rata mechanism will be in use in determining their pension benefit: the DB formula is used for pre-1995 contributions, while contributions accrued thereafter are accounted using the NDC formula. Only workers who entered the labour market after 1 January 1996 are those to whom the NDC system will fully apply.Footnote 19
The 1997 reform reduced the heterogeneity of treatments between private and public employees further and posed further restrictions for early retirement. In 2004 and 2007, governments tightened the eligibility conditions to retirement further raising the minimum retirement age to 60 for women and 65 for men and increasing the age and years of contribution requirements for seniority pensions. In 2009, the legal retirement age was raised to 65 years for women employed in the public sector. As a result the retirement age is not flexible any more between the age of 57 and 65 years in the long run, but will be governed by a mechanism that will allow early retirement only if an increasing set of conditions on age and seniority will be respected. Otherwise the legal retirement age is fixed at the age of 65 years with the exception of women employed in the private sector as dependent workers.
According to a number of studies and empirical exercises on microdata (among others: Fornero and Castellino, Reference Fornero and Castellino2001; Franco, Reference Franco2001; Borella and Coda Moscarola, Reference Borella and Coda Moscarola2006), the change from a DB to an NDC scheme resulting from the 1995 reform has made the system more equitable by linking closely individual's contributions with pension benefits, meaning that from an intertemporal perspective the NDC system is more fair than the old DB system. Actuarial fairness is confirmed either using representative individuals and applying the NDC formula to synthetic cohorts. The expected NPVR for individuals starting to work after 1995 abruptly decreased to value around 1 or even less, moving from clearly unsustainable values of 2 or even more for individuals running under the old generous DB system. Other studies (Bottazzi et al., Reference Bottazzi, Jappelli and Padula2006; Borella and Coda Moscarola, Reference Borella and Coda Moscarola2010) analyse the impact of the NDC pension reform in Italy on saving decision, controlling for different level of education, and try to introduce behavioural function in the decision to retire for future NDC pensioners. The empirical research on the Italian NDC pension system thus concludes that, at least in the long run once the system will be completely phased in, both financial sustainability and actuarial fairness will be reached.Footnote 20
5 Differential mortality in Italy
Differential mortality tables are currently not available in Italy. This paragraph describes the procedure adopted to estimate them from the available data. First of all we compute group-specific crude mortality rates, using data from death certificates and labour surveys and controlling for gender and three different levels of education in the process; then we estimate the relative risks, dividing each group-specific mortality rate by the general mortality rate; finally, we obtain differentiated death probabilities by multiplying the relative risks to the general age-related death probability (where the latter is provided by ISTAT). An important hypothesis is introduced at this point, namely that mortality differentials, in relative terms, stay constant across all generations.Footnote 21
A detailed description of the procedure that allows us to estimate differential mortality tables is reported in Appendix A. Table 1 computes, from the estimated differential mortality tables, the theoretical life expectancy at birth and at 65 years by sex and education.
Life expectancy at birth and at 65 years, by sex and education. Calendar year 2008

Life expectancyFootnote 22 varies greatly between educational level and within genders. Irrespective of education, life expectancy at birth is 77.6 years for men and 84.0 for women, while at 65 years old these values are 17.3 and 21.7. Considering education, a man can expect to live 76.5 years if he reaches a low level of education and 82.6 years if he gets a degree, with a difference of 6.1 years. A woman without secondary education lives – on average – up to 83.5 years that rises to 88.3 if she has graduated, with a difference of 4.8 years. Obviously, gaps remain high even at 65 years old: between least and most educated there are 3.8 years of difference for both sexes.
6 Main results
In order to assess the consequences of the introduction of differential mortality on the distribution of lifetime resources under the NDC system, we ran the CAPP_DYN microsimulation modelFootnote 23 substituting in the demographic module the official mortality tables of ISTAT with those estimated according to the procedure described in the previous paragraph and in Appendix A. Our microsimulation involves all individuals born between 1975 and 2000 who reach retirement age and whose pensions are to be computed under the new regime (NDC). We decided to exclude individuals born before 1975 in order to have a representative sample of those to whom pension benefits will be predominantly computed under the NDC system. This panel contains 13,857 pensioners: 7,160 men and 6,697 women. All the findings and comments hereinafter now refer to pensioners and not to the population as a whole. Table 2 shows the average age of pensioners at death in the panel.
Average age of pensioners at death, by gender and education

The results confirm the figures shown in Table 1: life expectancy appears to depend both on gender and on educational level. For example, a male pensioner born between 1975 and 2000, who left school before finishing high school, can expect onaverage to live 3.4 fewer years than a male graduate, while for women this difference is 2.7 years.
CAPP_DYN is based on a heterogeneous population, so that we can focus not only on the average levels of targeted variables but also on their whole distribution. Differential mortality tables would lead us to expect that, of those individuals who lived to a very old age, highly educated subjects would represent a higher proportion than less well-educated individuals.
Figure 1 shows the estimated cumulative frequencies of death age by level of education, from which we see that the event of an early death is much more likely to occur for individuals with low levels of education. For example, the frequency of poorly educated males dying before age 70 is 11% against 5.6% for highly educated males (female figures are, respectively, 5.7% and 4.4%). On the other hand, the frequency of males who lived longer than 95 years is 9% for the least educated and 16.6% for the most educated (female figures are, respectively, 22.9% and 34.3%).
Empirical cumulative distribution of death age, by education and age.

Moving on to the analysis of the effects of differential mortality on the distribution of lifetime resources under the NDC system, Figure 2 plots the relationship between NPVRFootnote 24 and age at death for the whole panel. As one would expect, the NPVR displays a positive relationship with age at death.Footnote 25
Relation between NPVR and death age for the whole panel.

Since the NPVR depends on the length of a person's life (see Figure 2), and since longevity depends to a certain extent on educational level (as we have seen in Table 2), we can expect the NPVR to differ according to education and, of course, gender. Table 3 reports the main results of our simulation.
NPVR under the NDC and the DB systems, by gender and education

We compare the NPVRs computed under the NDC formula (left part of the table) with the ones computed under the old DB system (right part of the table) for men and women and by educational level. In making the comparisons, we assume that the pension formula does not modify individuals' behaviours (i.e. retirement decisions). Therefore, pension benefits, contributions and NPVRs are computed over the same sample of individuals on which the two different computational formulae have been applied. The exercise allows to assess the net impact of the change from an earning-related formula (DB) to a contribution-related one (NDC). First of all it is important to note that moving the system from DB to NDC implies a marked improvement in the intergenerational fairness of the Italian system. The old DB formula was rather convenient for all groups analysed, providing NPVRs always greater than one. The NPVR computed on the whole panel is estimated to be equal to 1.43 under the DB system and it decreases to 0.935 under the NDC system. As far as the gender and educational levels are concerned, however, the computational formula does not significantly change differences among educational levels (although the relative gain for graduated women in the NDC system is smaller than in the DB system).
While focusing on results under the NDC system, the first thing to note is the difference between average male and female NPVR. While a man can expect to receive 86.6 cents for every Euro paid in, a woman can expect to get back the same amount she has paidin, since her NPVR is 1.001. Such a large difference is clearly explained by different death probabilities by sex coupled with uniform conversion factors. On looking within each gender, we also see large differences resulting from heterogeneous educational backgrounds. Those males who left school before high school do particularly bad, with an NPVR of 0.781, which is about 10% less than the average male NPVR (0.866) and 16% less than the whole panel's NPVR (0.935). On the other hand, the most fortunate group is the one composed of female graduates: they have an NPVR of 1.040, which is about 4% more than the average female NPVR (1.001) and 12% more than the general NPVR (0.935). Two channels of redistribution emerge here: between genders (from men to women), and within genders (from the poorly educated to the highly educated). These effects can go in the same way, as in the case of graduate women: their NPVR is higher than the average both because they are female and because they are graduates. However, these effects could offset each other, as in the case of male graduates: their gender should result in them having an NPVR that is lower than the average, but because of their university education this NPVR should be higher thanthe average. The overall effect is the sum of these two separate phenomena.
Figure 3 breaks the total distribution down into two parts: one deriving from gender and the other deriving from education.Footnote 26 The black bars indicate total redistribution from the PAYGO system: males who left school before high school are the largest ‘losers’, with an NPVR 16% below the general average. Seven percent of this substantial gap depends on gender, while 10%Footnote 27 depends on a low standard of education. We can see on taking a broader view that the gender effect remains constant at 7–8%, while the educational effect differs from one group to another. It matters most for the above-mentioned poorly educated males (−10%), and least for those females with a high-school education (+1%).
Percentage deviation from general NPVR, due to sex and education.

As we have said, there is a certain degree of redistribution from the poorly educated to the highly educated. However, since education is positively correlated with income, it is likely that the social security system will end up by redistributing resources from the poor to the rich. In order to measure the potential progressivity/regressivity of the NDC system, we have classified individuals in relation to average indexed yearly earnings,Footnote 28 defined as a lifetime's earnings divided by the number of years characterized by positive earnings.
Table 4 reveals a regressive redistribution, once individuals have been classified by lifetime income. The NPVR increases with rising income: the difference between the 5th and the 1st quintile, for both men and women, is about five points in terms of NPVR. However, these gaps are smaller than those observed when classifying individuals by educational attainment (see Table 3).
NPVR, by gender and quintile of average indexed yearly earnings

We can thus conclude that together with redistribution across educational lines, there is a regressive form of transfer that penalises poor people. Of course, this regressivity is unintended, being a necessary by-product of the utilization of transformation coefficients that fail to take gender or social differences into account. However, this finding is not trivial: even if the NDC system seems to improve the long-term financial sustainability of the pension system, it ends up transferring lifetime resources from poor and less well-educated people to rich and highly educated individuals.
7 Introducing survival and social pensions and sensitivity tests
In this section, we explore the sensitivity of our distributive results to the introduction of survival pensions, social pensions and to different values for the discount rate.
The Italian social security system allows the surviving spouse (and relatives) to receive a means tested benefit worth 60% of the old-age pension. In order to consider the effects of survival pensions on the distribution of lifetime resources in presence of differential mortality, we run the model also considering the family composition of our observations.
We present two different estimations. In the first stage, we impute the stream of survival benefits to the spouse that dies. The survival pension benefits generated over the whole sample are equal to 33.4% of the old age pension benefits, this share being greater in the case of those generated by men and perceived by women (43.2%) than in the opposite case (22.1%). Following this strategy, we have a direct comparison with the results presented in Table 3 where only old age pensions were taken into account. Table 5 summarizes our results.
NPVR, including survival pensions

First, note that the introduction of survival pensions increases our money's worth measures for all the subgroups of the population, irrespective of sex and educational level. Second, the average value of the NPVR for the whole population is now much closer to one, the target value that indicates the fulfilment of actuarial neutrality. Finally a substantial redistribution between educational levels remains, signalling that marriages between individuals with different level of education are a relatively rare event.
An alternative procedure is presented in Table 6, where we split the population between singles and couples.Footnote 29 Results are now presented at a household level: this means that the NPVR of a couple is obtained as the ratio between the present value of total benefits to the present value of total contributions, both of these measures computed at household level. Over the whole population couples score now an NPVR equal to 1.028 compared with a value of 0.954 obtained for single people. On controlling by educational level, we find that being single male and having a low educational level represents the worst possible situation: compared with married individuals with the same education those individuals lose on average 10% points in terms of NPVR. The difference between single people and couples with higher educational level remains negative even if at a slower degree.Footnote 30
NPVR, by household family type and education

a Number of households in brackets.
As we reported in section 4, under the NDC system no minimum allowance is provided to low level pension benefits. Workers can retire before the age of 65 years from the labour market only if their matured pension benefit is higher than 1.2 times the minimum old age allowance.Footnote 31 Individuals can retire in any case once they have reached the age of 65 years and a supplement to their pension benefit is provided in case it does not reach the social allowance minimum. In Table 7, we re-computed the results of Table 3 taking into account this possibility. The differences between the results of Tables 3 and 7 are a rough measure of the effects of the explicit consideration of old age social assistance benefits on the progressivity of the Italian pension system.
NPVR under the NDC and DB systems taking into account old age allowance and minimum pension, by gender and education

Table 7 also reports the value of NPVR when a DB computational formula is applied and taking into account the minimum pension supplement which, under this system, is assured to individuals having worked for at least 15 years and with an accrued pension benefit below the minimum level of 6,500 Euro per year (2011 prices). As far as the comparison between NDC and DB systems is concerned, it is important to note that accounting for social assistance benefits such as the minimum pension supplement increases the intertemporal convenience of the system, in particular under the NDC computational formula. Under this system, the average value of NPVR over the whole population grows to 1.09. It also reduces the regressivity of the system according to the level of education with significant differences by gender: if it has a minor role in reducing regressivity among men, it introduces some form of progressivity among women.
NPVR discounting future benefits at different rates

The results presented in the table confirm two important aspects. First, the consideration of social assistance considerably increases the intertemporal convenience of the NDC system (even if at the cost of the public budget). On the other hand, it only partially reduces the regressivity of the system between individual belonging to different education levels and finally it seems to increase the distance between men and women.
As a sensitivity test, we have run our simulation with different values of the discount rate in the equation (1): a higher rate of discount will value the future income (pension benefits) flows less, and thus the NPVR is expected to decrease as r increases; the reverse happens if the rate of discount decreases. The rate of discount used when we have presented our results was 1.5%: we now test the robustness of our findings letting r be either 0 or 3%. The whole panel's NPVR was 0.935 in our benchmark case and becomes 1.151 if we have a null interest rate and 0.775 with a rate at 3%. We see a large impact on the level of NPVR induced by different hypothesis about the discount rate. However, this is not what we are interested about, since we are concerned with the redistribution along educational lines. In fact, we note that women perform systematically better than men under each scenario (0, 1.5 and 3%) and the same happens with individuals with high educational level relative to those poorly educated. By breaking down the redistribution in a way similar to the one shown in Figure 3, we have observed that the total redistribution was slightly increased with r = 0% and slightly decreased with r = 3%, but this variation came only through a change in the between gender redistribution, whereas the part of redistribution due to education remained substantially unchanged. Thus, we claim our results are robust to change in the discount rate.
8 Conclusions
The aim of this paper was to measure the magnitude and the extent of lifetime earnings redistribution among various socio-economic groups under the Italian NDC system. Our results are based on a representative panel of Italian individuals born between 1975 and 2000. Our guess was that redistribution arises because of the combination of a uniform conversion coefficient in the NDC formula, and the presence of significantly different life expectancies according to gender and education or the financial resources held by the population.
After having reviewed the most important findings concerning the link between socio-economic factors and differential mortality and between differential mortality and actuarial fairness of a pension system, we differentiated the official age- and gender-specific mortality tables by three levels of education. For example, we find that the average pensioner's age at death was 82.5 years for a man who did not go to high school, compared with 85.9 for a man with a university degree. A similar pattern was also observed among women.
By running our microsimulation model with age-specific mortality probabilities that have been differentiated by education, we identified at least three channels of redistribution: between genders (from men to women), along educational lines (from the poorly educated to the well educated) and among income groups (from the poor to the rich). Although the introduction of the NDC system sharply increased the intergenerational fairness of the Italian social security system, it does not seem to have improved the equity between genders and educational levels.
Redistribution happens because certain groups systematically live less than an average lifetime (men, the poorly educated and the poor), while others live longer than the average (women, the highly educated and the rich). For example, for every Euro paid into the NDC system, a man can expect to get 86.6 cents back, whereas a woman can expect to receive 100.1 cents back. These figures become 78 and 95 cents, respectively, in the case of poorly educated men and women, and 90 and 104 cents, respectively, in the case of men and women with university educations. Therefore, even within genders, there is a strong form of redistribution from individuals with no high school education, towards those with such an education or more. Moreover, since education is positively correlated with income, it is likely that the social security system ends up by redistributing resources from the poor to the rich. In order to measure the potential progressivity/regressivity of the system, we classified individuals in terms of average indexed yearly earnings, which are defined as lifetime earnings divided by the number of years characterized by positive earnings. In this way we discovered the system to be regressive. A man belonging to the 1st quintile has an NPVR of 0.843, which is about 2.3 points lower than the NPVR of the average male (0.866) and 5 points lower than that of the 5th quintile (0.894). In the case of women, the poorest ones displayed an NPVR of 0.987, while the most affluent ones had an NPVR of 1.028.
Including survival and old age social allowance benefits, and computing the NPVR with different discount rates does not deny the main distributive outcomes.
We thank two anonymous referees for helpful comments and suggestions.
Appendix A – The construction of differential mortality tables
Let q g,x,c be the death probability of an individual of gender g, aged x and belonging to the cohort c, where g = {M, F}, x = {0,1, … ,120}, c = {1975, 1976, …, 2000}. Note that the data on q g,x,c are publicly available and they make up what we call the ‘general mortality tables’.
We can write the group-specific death probability for a given educational groupFootnote 32 as
 $$q_{g\comma x\comma c}^{e} \equals RR_{g\comma x\comma c}^{e} \times q_{g\comma x\comma c} \comma $$
where e = {Less than High School, High School, Degree} That is, each subgroup of the population (characterized by the combination gender-age-cohort-level of education) faces a death probability that is given by the general death probability times the relative risk multiplier RR g,x,ce, which captures education-specific deviation from the general death probability.
Our strategy is to estimate (or approximate) relative risks. To this purpose, we need the following:
Assumption: Relative risks are cohort-invariant, that is
 $$RR_{g\comma x\comma c}^{e} \equals RR_{g\comma x}^{e} \quad \quad \forall c \in \ \lsqb \; 1975\comma \ldots \comma 2000\rsqb.$$
That is, as we stated in footnote 21, if a 40-year-old male graduate faces a death risk that is 30% below the average, this 30% difference will emerge even for the 40-year-old who was born 10 years later, 20 years later and so on.
Yet, how do we estimate relative risks? Our procedure involves three steps.
(1) The first step is to compute group-specific mortality rates. The mortality rates are expressed as
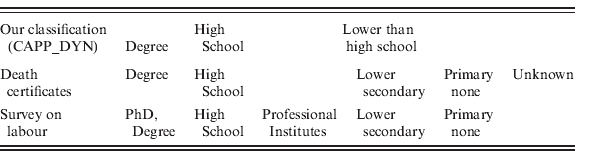
where n represents the number of deaths in 2001, p is the benchmark population, [x i, x j] refers to the class of age,Footnote 33g to gender and e to the educational level. Data are taken from the death certificates provided by ISTATFootnote 34 (for the numerator n) and from the Labour SurveysFootnote 35 (for the denominator p). Since the educational categories given by these two sources do not perfectly match, we have re-aggregated them to make our calculations consistent with the CAPP_DYN educational module. Each individual may attain three different levels of education: compulsory education (formally achieved at 16 years old, but actually many pupils drop out earlier), high school diploma and university degree. Therefore, we have aggregated the available data according to these three levels, as shown in Table A1. $$m_{g\comma \lsqb x_{i} \comma x_{j} \rsqb }^{e} \equals {{n_{g\comma \lsqb x_{i} \comma x_{j} \rsqb }^{e} } \over {p_{g\comma \lsqb x_{i} \comma x_{j} \rsqb }^{e} }}\comma $$Table A1.
Re-aggregation of educational categories based on ISTAT death certificates and survey on labour definitions
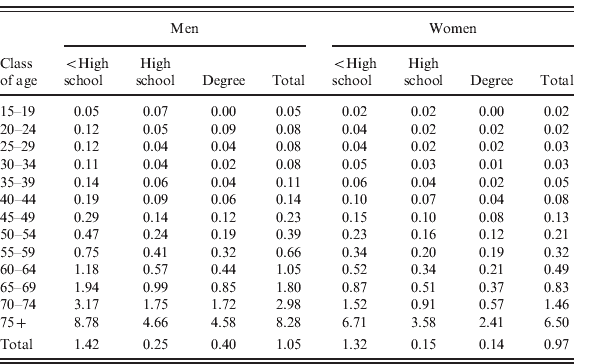
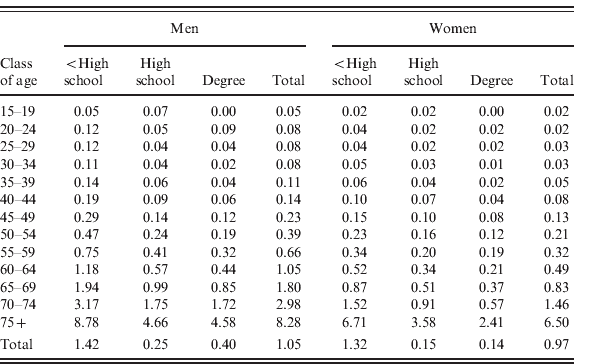
The data taken from the death certificates reveal about 15% of individuals whose level of education is unknown: we decide not to impute them to other levels, and to subtract these observations from the total.Footnote 36 We now have, for each gender, level of education and age group (age groups spanning 5 years from 15 to 74, and an open age group from 75 upwards), the number of deaths and the respective population stock.
Table A2 shows crude mortality rates computed in this way. Ignoring educational attainment, a 60-to-64-year-old man has a mortality rate of 1.05%. However, important differences arise when we take schooling years into account. A 60-to-64-year-old man with a university education scores 0.44%, while a man of a same age who did not even get the high school diploma scores 1.18% (more than twice as much as the former). Similar gaps among educational levels are also observed among women.
Table A2.Crude mortality rates (percentage values), by education and class of age
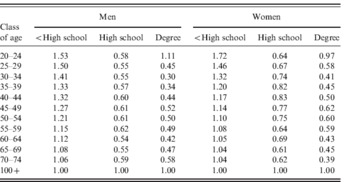
(2) The second step involves the calculation of the relative risks, that is to say, the RR terms in equation (1). For each gender and age group, we have divided the three group-specific mortality rates by the total population mortality rate. For example, the relative risk of a 60-to-64-year-old without secondary education is
We have omitted the age group [15–19], since no one can graduate by that age. Finally, for those persons aged between 100 and 120, we have imputed a relative risk of 1: we assume that in very old age, educational levels do not matter anymore, death being unavoidable. This assumption is consistent with the empirical findings presented above. The relative risks we have estimated are shown in Table A3.$${\rm RR}_{M\comma \lsqb \setnum{60} \minus \setnum{64}\rsqb }^{ i {\rm low}} \equals {{m_{M\comma \lsqb \setnum{60} \minus \setnum{64}\rsqb }^{{\rm low}} } \over {m_{M\comma \lsqb \setnum{60} \minus \setnum{64}\rsqb }^{{\rm total}} }} \equals {{1.18\percnt } \over {1.05\percnt }} \equals 1.121.$$Table A3.Relative risks by education and age group
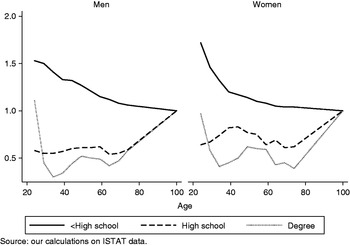
Each cell in Table A3 gives the subgroup's percentage deviation, in terms of its mortality rate, from the total population of a given age group. We now interpolate our data in order to obtain yearly relative risks.Footnote 37Figure A1 shows these figures for both genders.
Figure A1.Relative risk, by education and age
We see a downward trend in the solid lines for both men and women (less than high school): the relative disadvantage of these people is stronger during youth. For men, the dashed (high school) and dotted lines (degree) are stable around the 50% mark until the age of 74 years, when they move close to 1 because of our interpolation; for women these lines are roughly stable at 50%, although they are a bit more volatile compared with men. The second thing to note is that from about 70 years onwards, university and high school graduates display similar patterns (for men, they even coincide). The great difference is between those who went to secondary school or beyond, and those who left school beforehand.
(3) The third step is to compute the differentiated death probability, applying equation (A1). This enables us to take the cohort effect into account, since q g,x,c depends on a persons year of birth (and changes as cohort changes; recall that data on q g,x,c are provided by ISTAT) and we have assumed that the RR are equal across all the considered generations. Finally, a calibration procedure is implemented in order to guarantee the models consistency.Footnote 38




Appendix B – The microsimulation model CAPP_DYN
According to the taxonomy proposed by O'Donoghue (Reference O'Donoghue2001), CAPP_DYNFootnote 39 is a closed, discrete time, probabilistic, time-based dynamic microsimulation model. It takes a cross-sectional sample of the Italian population and forecasts their socio-economic characteristics forward through time to 2100.
B.1 Base population
The initial population is drawn from the 2002 Survey of Households' Income and Wealth (SHIW; see Bank of Italy, 2004). The SHIW has been widely used for the empirical analysis of income distribution and wealth at individual and household level. It collects a rich and detailed set of socio-economic characteristics of a random sample of non-institutionalized individuals (in the 2002 study 21,148 individuals within 8,011 household units were sampled).Footnote 40 Particular attention has been devoted to the analysis of the representational accuracy of the initial population, since non-ignorable non-response behaviours, under-reporting and misreporting (especially with regard to the financial circumstances) may bias the long-term results.Footnote 41 In building the base year population in use by CAPP_DYN, we applied a post-stratification procedure to the original sample weights, using information provided by the 2001 census data, allowing an alignment of the survey distribution according to the administrative one.Footnote 42 Finally, we expanded the initial dataset according to the new vector of weights calculated. As far as the size of the initial population is concerned, there is a trade-off between, at the one hand, improving the heterogeneity of the simulation by using a larger sample, thus reducing estimation variance (Orcutt et al., Reference Orcutt, Mertz and Quinke1986), and at the other hand, the technological constraints involved in processing a set of sample members which, by the end of the simulation period, can number several millions. Current analyses are carried out using a base year population of around 270,000 individuals within 107,000 households. In order to calculate future pension entitlements for those already in the labour market at the time of interview, we reconstruct the past working history of each active individual present in the base year since his/her entry into the labour market, using all the retrospective information collected in the SHIW.Footnote 43
B.2 Assumptions
CAPP_DYN makes projections on the basis of specific assumptions about the evolution of a number of (macro) exogenous variables. Table B1 displays the list of these exogenous variables, together with the data sources from which the values used in the simulations are drawn. The latest demographic projection (ISTAT, 2008, central scenario) is used in predicting the number of deaths, births and net immigrants at each of the simulated year. The same demographic scenario is employed by the Ragioneria Generale dello Stato (RGS) macro-model to make forecasts of the future GDP growth and earnings, which in turn represent the benchmark of our macroeconomic scenario. Therefore, the choice we make insures internal consistency of our assumptions, in the light of the fact that demographic dynamics and macroeconomic variables are not independent.
The range of events simulated by CAPP_DYN: data source, methods and set of socio-economic observable characteristics

B.3 The demographic modules
The general functioning of the demographic modules is as follows: each yearly simulation ages the population by one year; then, the simulation goes on to establish the number of observations that exit the model due to the death (see Appendix A). This is followed by the simulation of new entrants in the sample due to new births and migration, according to the central scenario of the latest ISTAT forecast.
Once the population size and composition have been defined for each period, the model starts the simulation of processes modifying the structure and the composition of household units. Children between 18 and 34 years can leave their household unit of origin. Single individuals, whether living with their parents or not, may get married as well as widowed or divorced/separated individuals, according to conditional probabilities estimated using the Indagine Multiscopo sulle Famiglie (various years) of ISTAT. A marriage model based on the assortative mating theory (Becker, Reference Becker1973) determines the creation of a new household unit, whereas a divorce causes the original one to split.
B.4 Education and labour market modules
Once the socio-demographic structure of the population has been simulated, the model moves on to simulate decisions regarding participation in education and the labour market. All individuals aged 16 years are deemed to have completed their compulsory education. At that age, we simulate the probability of individuals continuing full-time education (up to upper secondary school or higher education) using estimates of an ordered probit model where the educational level attained by an individual depends on a set of observables including family background indicators, and taking into account as far as possible – the presence of cohort effects.Footnote 44
By formally, defining y i as the observed and achieved educational level, and  $\tilde{y}_{i} $ the corresponding latent variable, we model the alternatives in an ordinal form that implies the following general structure:
 $$\left\{ {\matrix{ {y_{i} \equals j\comma \quad \quad \quad \quad c_{j \minus \setnum{1}} \le \tilde{y}_{i} \lt c_{j} \comma \quad j \equals 1\comma \ldots \comma J\comma } \hfill \cr {\tilde{y}_{i} \equals \beta ^{ \top } {\bf x}_{i} \plus \epsilon _{i} \comma } \hfill \cr} } \right.$$
where J is the number of categories for y i:1, compulsory education; 2, high school; 3, degree; xi is the vector of individual (gender, geographical area and cohort dummies) and household (parents' presence and educational level) characteristics; c j are threshold parameters estimated jointly to the column vector of β coefficients. The estimated coefficients and the cut-off parameters are then used for predicting the probabilities that individuals aged 16 years will reach level of education j. The simulation of the individual educational attainment is finally obtained comparing the vector of J-probabilities with a random number drawn from a uniform distribution with support [0,1] (i.e. Monte Carlo technique).
A higher educational level delays entry into the labour market until individuals achieve the simulated educational attainment. Then, the individuals incur in the probability of entry into the labour market. Inputs/outputs into/from the labour force, together with changes in employment, are then simulated making use of estimates obtained using the Rilevazione trimestrale sulle forze di lavoro (ISTAT, various years) – herein after RTFL. Occupational attainments and sector are assumed to be time-invariant over the whole simulation period for each individual, whereas employment status and contractual arrangements are allowed to change over time. Concerning the number of transitions into the labour market, CAPP_DYN allows for four employment statuses, and in keeping with other dynamic microsimulation model, it assumes that employment decisions depend solely on individual characteristics, and are thus independent of demand-side factors. Individuals aged 16–64 years, excluding pensioners and students, can be classified as:
• full-time workers (those working at least 31 hours);
• part-time workers (those working less than 31 hours);
• unemployed;
• outside the labour market (unemployed/inactive).
Transition probabilities are estimated on a pseudo-panel RTFL 1993–2003 by using gender-specific multinomial models, assuming that, controlling for a set of observable characteristics and cohort effects, the individual status at time t + 1 depends on the state observed in t. Given the initial status W it − 1 of individual i at time t − 1, the conditional probabilities of transition or immobility in the following year are modelled asFootnote 45
 $$P\lpar \hskip2pt j_{it} \vert \hskip2pt j_{it \minus \setnum{1}} \comma {\bf x}_{it \minus \setnum{1}} \rpar \equals {{{\rm exp}\lpar \beta _{j}^{ \top } {\bf x}_{it \minus \setnum{1}} \rpar } \over {1 \plus \sum\nolimits_{j \equals \setnum{1}}^{\setnum{4}} \,{\rm exp}\lpar \beta _{j}^{ \top } {\bf x}_{it \minus \setnum{1}} \rpar }}\comma \quad \quad j \equals 1\comma \ldots \comma 4\comma $$
where j is one of the four feasible statuses, xit − 1 is the covariates vector (education, second-order polynomial in age, geographical area, marital status, activity and eight cohort dummies) and βj is the vector of coefficients varying according to each state. Finally, a Monte Carlo process enables a definition of the individual's job status in each of the simulated years. Consistent with previous works (Creedy et al., Reference Creedy, Disney and Whitehouse1993; Disney and Emmerson, Reference Disney and Emmerson2005), mobility between industries, occupations and sectors are not currently modelled.
Once a position in the labour force is simulated, the yearly earning will be generated using separate estimated earning equations for employees and self-employed workers. The group of employees is in turn divided by educational level and gender.Footnote 46 The econometric model specification is the following:Footnote 47
 $${\rm log}\lpar y_{it} \rpar \equals \beta ^{ \top } {\bf x}_{it} \plus \epsilon _{it} \comma $$
where log(y it) is the log of individual labour income gross of personal taxation,Footnote 48 the xit vector contains observed individual time-variant and time-invariant observable characteristics and εit is a random disturbance term. The parameters of equation (B3) are used to predict the deterministic component of the individual earnings in every year of the simulation. However, individual income differs because of the presence of unobserved individual effects and a yearly component that can be thought of as the increase in productivity distributed to all workers in each simulation period.
The unobserved individual effects can be estimated using longitudinal data. Use of cross-section data prevents εit from being split into the individual-specific effect αi and the orthogonal error term ξit which have zero mean and variance σα2 and σξ2, respectively. Assuming that the orthogonal error term is equal to zero in the initial sample SHIW 2002 (ξi0 = 0), the prediction of the individual's earnings level in period s is made using the set of information available y i0, xi0 and xis together with the estimated β. Under normality, the conditional expectation of y is is
 $$E\lpar y_{is} \vert y_{i\setnum{0}} \comma {\bf x}_{i\setnum{0}} \comma {\bf x}_{is} \rpar \equals \beta ^{ \top } {\bf x}_{is} \plus \lpar y_{i\setnum{0}} \minus \beta ^{ \top } {\bf x}_{i\setnum{0}} \rpar \comma $$
where the first term  $\beta ^{ \top } {\bf x}_{is} $ is the deterministic part calculated using the coefficient estimated in equation (B.3) by the vector of updated characteristic x is whereas the second corresponds to the composite error term εi0 in the base population.
Equation (B.4) specifies that, if we choose to generate earnings stochastically for the simulated period we must take into account the difference between the observed and fitted earnings in period t when a prediction for period s is made. A further problem in stochastically generating earnings in s-period is that εi0 is not available for those to whom the information on earning is not available at the time of interview (in work and not respondent; temporarily not in work). Assuming normality, we calculate this term extracting a random number from a normally distributed function with mean zero and variance σα2 + σξ2.
Finally, y is is multiplied by a factor (1 + τs) allowing the individual earning in s to be linked to the medium–long-term productivity growth, calibrated through the ‘scenario’ block. Again there is one point that needs to be made clear: the demographic evolution and the increase in the stock of human capital in the coming decades increase the average earning level, since age and education have a positive effect on the average labour earnings.Footnote 49
However, in this model, endogenous growth is lower than the growth forecasts according to RGS, since it does not account for the expected increase in productivity. In order to avoid over/under-estimation of earnings' growth rates for the coming decades, the following procedure is adopted: every year, a pro-quota growth factor τ – equal to the difference between the exogenous earning growth fixed in the ‘scenario’ and the earning growth estimated by the model – is added to the endogenous growth due to the socio-demographic evolution.
The term τs is given by
 $$\tau _{s} \equals m_{s} \minus \left( {{{E\lpar y_{s} \rpar } \over {E\lpar y_{s \minus \setnum{1}} \rpar }} \minus 1} \right)\comma $$
where m is exogenously determined in the ‘scenario’,Footnote 50 while E(y s)/E(y s − 1) describes the endogenous growth rate generated by the model.