I. INTRODUCTION
Vertical graphene (VG), another member of the carbon family, also known as vertically aligned few-layered graphene (FLG) or carbon nanowalls (CNWs) has been introduced recently Reference Kumar, Voevodin, Zemlyanov, Zakharov and Fisher1–Reference Quinlan, Cai, Outlaw, Butler, Miller and Mansour5 and has opened a new realm of possibilities for different applications such as field emitters, Reference Fang, Levchenko, van der Laan, Kumar and Ostrikov4,Reference Koh, Foong, Pan, Sun and Chua6,Reference Behura, Mukhopadhyay, Hirose, Yang and Jani7 energy storage applications, Reference Hassan, Suzuki, Mori and El-Moneim8–Reference Miller, Outlaw and Holloway11 light absorption, Reference Krivchenko, Evlashin, Mironovich, Verbitskiy, Nefedov, Wöll, Kozmenkova, Suetin, Svyakhovskiy, Vyalikh, Rakhimov, Egorov and Yashina12 and gas and bio-sensors. Reference Seo, Rider, Kumar, Randeniya and Ostrikov13 While these sheets are not completely vertical, they are still colloquially called VG since most of them do not lie horizontally on the substrate surface. The name differentiates this type of graphene from CVD grown graphene that lies parallel to the substrate.
An extremely high Young's modulus of 1 TPa, Reference Lee, Wei, Kysar and Hone14 large theoretical surface area of 2675 m2/g, Reference Cranford and Buehler15 and low density make graphene an attractive filler for nanocomposite applications. However, fillers need to be dispersed uniformly to achieve the largest enhancement in material properties, such as mechanical strength or electrical conductivity. Before the advent of graphene, other carbon-based nanomaterials, such as carbon nanotubes (CNTs), were considered as nanocomposite fillers, Reference Moniruzzaman and Winey16 but the problem of nonuniform dispersion rendered them largely unsuitable for nanocomposite applications. Reference Sahoo, Rana, Cho, Li and Chan17 Different methods, such as surface functionalization and acid modification, have been suggested to improve CNT dispersion in a polymer, Reference Hirsch18–Reference Zhang, Lippits and Rastogi21 but the accompanying cost and challenges make those techniques inadmissible for wide use. Similar problems exist for dispersion of conventional graphene sheets in a polymer host since sheets tend to agglomerate in the polymer due to the large surface area of graphene sheets as well as the van der Waals force between them. Thus, achieving a high-quality graphene-based polymer nanocomposite is a challenging task, especially at high concentrations of graphene.
High speed stirring and ultrasonic dispersion are often used to accomplish a relatively uniform dispersion in graphene-based polymer nanocomposites. However, problems such as breaking of the sheets while stirring make these approaches effective only in small weight percentages. Rafiee et al. Reference Rafiee, Rafiee, Srivastava, Wang, Song, Yu and Koratkar22 could achieve uniform dispersion of fillers for weight fractions of no more than 0.125% in graphene-based polymer nanocomposites due to this dispersion problem, even though the graphene sheets were functionalized to improve their dispersion and prevent filler aggregation. The inferior mechanical properties in the experimental results in graphene oxide (GO)-based poly(dimethylsiloxane) (PDMS) nanocomposite compared to the theory that was reported by Zhang et al. Reference Zhang, Zhu, Lin, Ruoff, Hu, Schaefer and Mark23 were attributed to the crumpling and breaking-up of the graphene sheets caused by ultrasonic dispersion.
Here, we report on vertical graphene-based nanocomposites (VGNs) for the first time. The fabrication method presented here makes the uniform distribution of graphene sheets in the polymer readily achievable even for graphene concentrations exceeding 3%. The glass transition temperature and mechanical properties of the samples were characterized and the observed enhancement was explained based on the morphology of the VG sheets.
II. EXPERIMENTAL
A. VG synthesis
All VG sheets used in this work (i.e., both randomly or uniformly dispersed in VGNs) were synthesized using a radio-frequency plasma enhanced chemical vapor deposition (RF-PECVD) method, as described in detail in previous work. Reference Davami, Shaygan, Kheirabi, Zhao, Kovalenko, Rummeli, Opitz, Cuniberti, Lee and Meyyappan24 Briefly, different substrates such as Cu, Si, and Si covered with 150 nm of thermally evaporated Ni and Au, cleaned in acetone and IPA solution, then rinsed with DI water, and dried with N2 gas. The substrates were placed in the PECVD chamber on the sample stage and the chamber was evacuated to reach the pressure of 1 Torr. The sample stage was heated up to 680 °C by Joule heating. Plasma was ignited using a combination of methane and hydrogen while the RF power was set at 900 W. Two different deposition times of 20 and 60 min were used. After the deposition time ended, the chamber was cooled down slowly to room temperature, vented, and the samples were taken out.
B. Fabrication of the uniformly and randomly dispersed VGN thin films
1. Uniformly dispersed VGN fabrication
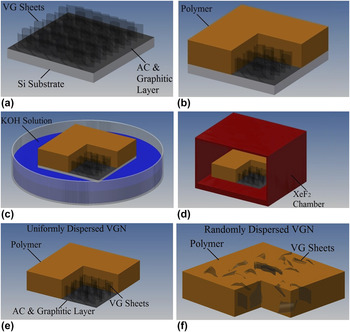
A schematic of the fabrication method is presented in Fig. 1. A medium viscosity epoxy (System 2000 Epoxy Resin, Fiberglast Inc.) was mixed with a low viscosity curing agent (2120 Epoxy Hardener, Fiberglast Inc.) and acetone with a volume ratio of 3:1:1. The mixture was then stirred at ∼2000 rpm for 4 min. Then, it was spin-coated on bare Si pieces at different spinning speeds for different amounts of time to obtain the relation of thickness versus speed and time. As a result, the mixture was spin-coated on the Si pieces covered with VG for 120 s at 3000–6000 rpm to obtain the thickness corresponding to the VG height and in the range of 2–8 µm. The samples were placed in a vacuum chamber for 40 min to remove as much acetone and air bubbles from the sample as possible. After that, the samples were heated on a hot plate at 90 °C for 4 h and cooled down slowly in air to cure the polymer. Subsequently, the Si substrate was completely etched in a 30% (by weight) KOH solution (428 g of KOH pellets in 1 L of water) at 80 °C and for a period of approximately 6 h. The uniformly dispersed VGN thin films floated in the KOH solution after Si was etched. The samples were rinsed off in water and dried in air for 24 h. To make sure that all the Si was etched away, the samples were finally placed in XeF2, a dry etchant of Si, for 2 more hours with an etching cycle time of 20 s, XeF2 pressure of 2 Torr, and cooling down cycles of 5 s in between the etching cycles. After that the samples were cut with a razor blade into rectangular shapes of ∼5 mm wide and ∼15 mm long. The weight percentage of the graphene fillers in the uniformly dispersed VGN sample was calculated based on the mass of the polymer on the Si substrate before KOH etching and graphene sheets grown on the unit surface area of the same Si substrate (∼0.74 mg/cm2).
(a–e) The fabrication process of the uniformly dispersed VGN samples, (f) a schematic of the randomly dispersed VGN sample. The polymer (brown) is sectioned to show the VG sheets.

2. Randomly dispersed VGN fabrication
To provide a comparison benchmark for the new method described above, we also fabricated samples with randomly distributed VG. The VG sheets used here were grown with the exact growth parameters used for those in uniformly dispersed VGNs. However, for the dispersion of the sheets in the polymer, a procedure similar to that reported in Ref. Reference Rafiee, Rafiee, Srivastava, Wang, Song, Yu and Koratkar22 was followed. The desired amount of VG sheets was separated from the substrate by a razor blade and weighed. Acetone was added to the VG and the solution was sonicated for 30 min. The epoxy was added to the solution and sonicated for another 30 min. The curing agent was then mixed and the mixture was stirred at ∼2000 rpm for 4 min. The solution was spin-coated on a Si wafer and placed in the vacuum chamber for 40 min to degas the solution and evaporate acetone. Subsequently, the wafer was heated at 90 °C for 4 h again to cure the polymer. The composite was finally isolated from the substrate by following the same procedure used for uniformly dispersed VGN samples.
C. Characterization
A scanning electron microscope (SEM–JEOL 7500 HRSEM, Tokyo, Japan) operating at 5.00 kV was used for imaging and studying the morphology of the VG sheets as well as uniformly and randomly dispersed VGN thin films. Samples were attached to a metal chuck using a piece of carbon tape, and 8 nm of iridium deposited on the surface of the nanocomposite samples. Copper tape was also used to connect the top surface of the VGN specimens to the chuck electrically. In all of the tilted images, the tilt angle was 45°. The structure of the VG sheets was also characterized using a transmission electron microscope (TEM). Samples were transferred onto copper grids by slightly scratching the VG substrate, and then they were analyzed using standard equipment in a JEOL JEM 2100 TEM operating at 200 kV.
Raman spectroscopy analysis was done in a Senterra Raman spectroscope (Bruker Optics) using the excitation wave length of 532 nm (green laser) from a Nd:YAG laser. The spot size of the laser was 500 nm and an optical microscope with an objective of 100x and lateral resolution of 2 µm was used to choose the probing area. The exposure time was 10 s. The laser power for all the samples was 0.2 mW. The low power was selected to ensure that the lasers did not heat the samples, which can affect the Raman spectra.
The tensile test was performed using an Instron (Model 5564, Norwood, MA) table-mounted materials testing system. The sample was clamped at both ends in the two grips while the lower end was fixed and the upper grip rose at a rate of 2.54 mm/min. The force–displacement data points were recorded and the stress–strain curves were obtained by taking into account the dimensions of the test samples and the gage length.
Differential scanning calorimetry (DSC) analysis was performed for the pristine epoxy as well as the nanocomposite thin films using a differential scanning calorimeter (Q 1000, TA Instruments). Samples with a weight of ∼2 mg were placed in aluminum pans and the pans were sealed. The experiments were performed from 10 to 110 °C at a ramping rate of 10 °C min−1. The samples were cooled down and the experiment was repeated with the same parameters for the second time. The glass transition temperature of the samples was extracted from the second heat flow diagram.
III. RESULTS AND DISCUSSION
A. Characterization of VG sheets
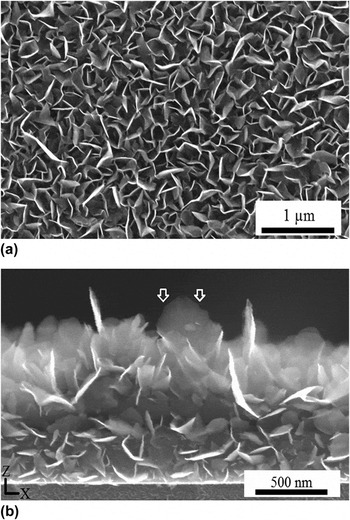
Figures 2(a) and 2(b) show top-down and cross-sectional views of the as-grown VG sheets on Si substrates. VG sheets grown on other types of substrates were similar with only small differences in the morphology and density of the sheets. The comparison between VG sheets grown on different substrates as well as the growth mechanism were reported earlier. Reference Davami, Shaygan, Kheirabi, Zhao, Kovalenko, Rummeli, Opitz, Cuniberti, Lee and Meyyappan24 The height of the sheets is determined by the growth time and for a period of ∼20 min, it was measured to be around 1 µm. As shown in Fig. 2(a), the VG sheets are mostly curvy, with bigger sheets exhibiting less curvature. In Fig. 2(b), it can be clearly seen that most of the sheets are almost perpendicular to the substrate although they make different angles with the substrate. The round shape of the planes, like the one seen in Fig. 2(b), is attributed to the lower carbon concentration on the side edges, and as a result, a slower growth rate compared to the top edge of the sheets, which naturally results in a rounded edge.
SEM pictures of the VG sheets on Si substrates. (a) The top view and (b) the cross-sectional images. The arrows in (b) are pointing at the side edges of a VG sheet with a smaller growth rate compared to the top edge.

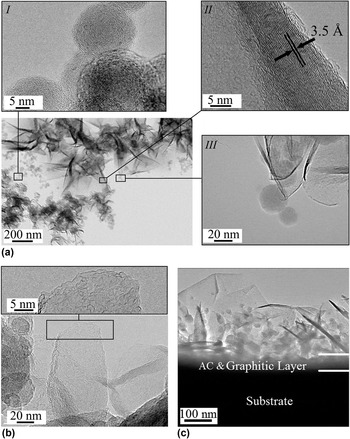
Figures 3(a)–3(c) present TEM images of the as-grown samples where bundles and individual VG sheets are shown. Figure 3(a) shows a combination of carbon onions (magnified in inset I) and graphene sheets (magnified in inset III). The folded edges of the sheets are visible in inset III of Fig. 3(a). These folded edges form when the VG sheet becomes too big, so that it becomes less rigid and collapses upon itself. The interlayer distance between the carbon layers is similar to graphite and is measured to be 3.5 Å [see the HRTEM image in inset II of Fig. 3(a)]. While around 10 layers are usually seen at the base of the sheets, the number of the layers from the base toward the edges of the sheets decreases, and at the tip there are only a few layers. Most of the edges in the VG sheets have a morphology similar to the one seen in inset II of Fig. 3(a). These tapered rough edges form due to the lip–lip connection of the layers that eventually hinders the growth of the sheet. Reference Zhao, Shaygan, Eckert, Meyyappan and Rümmeli25 The tapered edges as well as the folded ones add rigidity to the VG sheets and prevent them from bending easily. Reference Zheng, Wei, Fan, Lanqing and Huang26 Figure 3(b) shows an individual VG sheet in its intermediate growth stage. The nonsmooth edges of this sheet indicate that the growth is not complete yet. Reference Zhao, Shaygan, Eckert, Meyyappan and Rümmeli25 The thickness of the VG sheets is determined by the number of the layers that nucleate at the bottom, either from a carbon onion [Fig. 1(a), inset I] or from the mismatches in an amorphous carbon/graphitic layer that forms on top of the substrate at the initial stages of the growth [Fig. 3(c)]. Reference Kim, Choi, Lee and Hong27,Reference Barreiro, Börrnert, Rümmeli, Büchner and Vandersypen28
(a) A low magnification TEM image of the graphene sheets and carbon onions. Inset I shows a HRTEM image of the carbon onions, inset II shows a HRTEM of the edge of a sheet, and inset III shows an image of the graphene sheets with folded edges connected to the carbon onions, (b) a single sheet in the initial stages of its growth, the inset shows a HRTEM image of the rough edges of the plane, and (c) a low magnification TEM image of the substrate, amorphous carbon (AC) and graphitic layer, and the graphene sheets as well as the carbon onions on top.

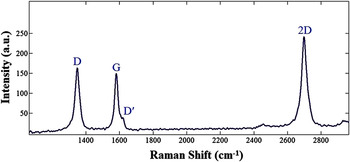
The Raman spectra of graphene type structures typically show four main bands, denoted as D (∼1330 cm−1), G (∼1580 cm−1), D′ (∼1620 cm−1), and 2D (∼2660 cm−1) bands. Reference Ferrari and Robertson29–Reference Wu, Yang, Zong, Sun, Shen and Feng31 The Raman spectra obtained from the VG sheets grown on a Si substrate are presented in Fig. 4 having all four major bands. No shoulder is seen adjacent to the D peak. This was previously considered as one of the characteristics of CNWs or FLG films. Reference Malesevic, Vitchev, Schouteden, Volodin, Zhang, Van Tendeloo, Vanhulsel and Van Haesendonck3,Reference Ferrari, Meyer, Scardaci, Casiraghi, Lazzeri, Mauri, Piscanec, Jiang, Novoselov, Roth and Geim32 The small peak at ∼3000 cm−1 originates from the sum of the D and G bands. To evaluate the quality of graphitic structures, the ratio of the D peak intensity (I D) to the G peak intensity (I G) is used. This ratio, denoted as R value, is indicative of quality and crystallinity and is ideally zero for highly ordered pyrolitic graphite. Reference Kastner, Pichler, Kuzmany, Curran, Blau, Weldon, Delamesiere, Draper and Zandbergen33 The R value is 1.1 for the Raman spectra shown in Fig. 4(a), and between 1 and 2 for all other graphene samples in our experiments. This is in the range reported by Kurita et al. Reference Kurita, Yoshimura, Kawamoto, Uchida, Kojima, Tachibana, Molina-Morales and Nakai34 for CNWs grown by the PECVD method. The relatively high R values can be attributed to the large number of edges, the presence of amorphous carbon and graphitic layer, the small crystallite size, and the dense structure of the CNWs, which all cause an increase in the intensity of the D peak. Reference Soin, Roy, Lim and McLaughlin2 The full width at half maximum (FWHM) of the Raman bands was estimated by fitting the data to the standard curves to be 39, 26, and 38 cm−1 for D, G, and 2D peaks, respectively. All three FWHM values are in total agreement with the similar results reported for high quality CNWs and FLG. Reference Kurita, Yoshimura, Kawamoto, Uchida, Kojima, Tachibana, Molina-Morales and Nakai34,Reference Reina, Jia, Ho, Nezich, Son, Bulovic, Dresselhaus and Kong35
Raman spectrum and its major bands for the VG sheets on a Si substrate.

B. Characterization of the VGN thin films
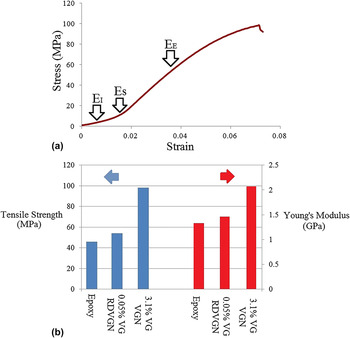
The Young's modulus and ultimate strength of the uniformly and randomly dispersed VGN thin films were measured using tensile loading tests. Force–displacement curves of the samples were measured, and the stress–strain curves were obtained by taking into account the dimensions of the sample and the gage length. Figure 5(a) shows a representative stress–strain curve for a 3.1% loading uniformly dispersed VGN sample. In this graph, three distinct regions can be seen. Reference Park, Lee, Bozoklu, Cai, Nguyen and Ruoff36 In the initial linear region, the stiffness (E I) of the sample against the initial loading can be easily defined. This is followed by a straightening region in which the wrinkles remaining from the fabrication straighten up completely and the slope of the curve increases (E S). The elastic modulus (E E) can be estimated from the slope of the “almost” linear region after the straightening, similar to the procedure used in Ref. Reference Park, Lee, Bozoklu, Cai, Nguyen and Ruoff36.
(a) Stress–strain graph from tensile testing for a uniformly dispersed VGN with a filler weight fraction of 3.1%. The initial moduli (E I), the moduli in the straightening region (E S), and the moduli in the almost linear region (E E) can be obtained from this graph. (b) A comparison of the Young's modulus and ultimate tensile strengths of the pure polymer, randomly dispersed VGN, and uniformly dispersed VGN. The error of weight fraction calculation for the various nanocomposite samples is estimated to be less than ±0.02 wt%.

Figure 5(b) compares the Young's modulus and tensile strength of the samples with different VG sheet weight fractions and fabrication methods. As can be seen here, at a 3.1% VG weight fraction, the Young's modulus and tensile strength increased by ∼54 and ∼113%, respectively, compared to pristine polymer. In contrast, randomly dispersing 0.05% weight fraction of VG in the pristine epoxy increased the Young's modulus by ∼8% and the tensile strength by ∼15%. This increase is similar to previously reported analogous samples with randomly dispersed functionalized graphene sheets (FGS). Reference Rafiee, Rafiee, Srivastava, Wang, Song, Yu and Koratkar22 While the dispersion of the FGS becomes difficult above 0.125% weight fraction, Reference Rafiee, Rafiee, Srivastava, Wang, Song, Yu and Koratkar22 here, we fabricated uniformly dispersed VGN samples with 3.1% weight fraction of the filler, obtaining a higher Young's modulus and dramatically enhanced ultimate tensile strength than those of pure polymer. This is striking because in samples with 0.5% weight fraction of FGS under similar test conditions, the tensile strength of the samples was even less than that for the epoxy and this was attributed to a poor dispersion of the fillers. Reference Davami, Shaygan, Kheirabi, Zhao, Kovalenko, Rummeli, Opitz, Cuniberti, Lee and Meyyappan24 Our samples performed dramatically better, most likely because of the uniform dispersion of the fillers and good interaction with the host polymer due to the increased roughness and curly nature of the sheets (see below). However, more studies need to be conducted to evaluate the interaction of the graphene sheets with the host polymer as well as the effects of different parameters with more certainty.
The glass transition temperature (T g) of a sample of pristine epoxy and a randomly dispersed VGN thin film at 0.05% weight fraction of the VG sheets was measured to be 65 and 75 °C, respectively, close to those reported in Ref. Reference Rafiee, Rafiee, Srivastava, Wang, Song, Yu and Koratkar22 for FGS samples. A uniformly dispersed VGN sample with 3.1% weight fraction of the fillers showed a glass transition temperature of 21 °C higher than that of pure epoxy, indicating good interaction of the sheets with the host polymer. Reference Stankovich, Dikin, Dommett, Kohlhaas, Zimney, Stach, Piner, Nguyen and Ruoff37,Reference Ramanathan, Abdala, Stankovich, Dikin, Alonso, Piner, Adamson, Schniepp, Chen, Ruoff, Nguyen, Aksay, Homme and Brinson38
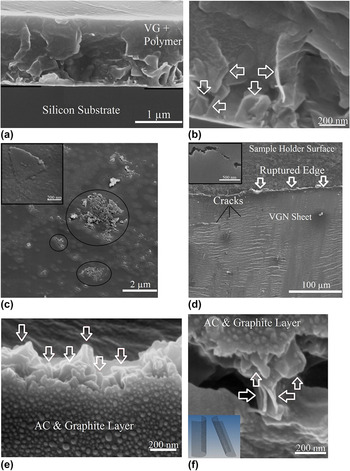
To study the interfacial interaction between the matrix and fillers, the surface and cross-sections of the nanocomposite thin films were examined using an SEM (Fig. 6). Figure 6(a) shows a uniformly dispersed VGN thin film on the Si substrate before etching Si. In Fig. 6(b), a high magnification image of the freeze-fractured uniformly dispersed VGN thin film is shown to illustrate the VG sheets in the polymer. It should be noted that while VG sheets are distributed uniformly along the length and width of the nanocomposite film, there is a gradient of VG sheet density along the thickness of the film, where there is a relatively higher density of sheets closer to the substrate [see Figs. 1(e), 6(a), and 6(b)]. This gradient can be controlled by adjusting the height of the graphene sheets as well as the thickness of the polymer layer.
SEM images of (a) uniformly dispersed VGN before etching the Si substrate, (b) VG sheets shown by arrows in the uniformly dispersed VGN, (c) graphene agglomeration (circled) in a randomly dispersed VGN. The inset shows a polymer-coated single VG sheet, (d) back of a uniformly dispersed VGN sample after the tensile tests. Developed cracks can be seen in the sample. In the inset, one of the cracks is magnified, (e) and (f) protruding VG sheets (shown by arrows) from the polymer after the tensile test in a uniformly dispersed VGN. The inset in (f) is a schematic of the two protruding sheets showing their bent edges.

As expected, agglomeration of VG sheets was observed for the randomly dispersed VGN [Fig. 6(c)]. The agglomeration of the graphene sheets causes stress concentration, and as a result, reduced toughness, particularly at higher loadings. Reference Zhang, Zhu, Lin, Ruoff, Hu, Schaefer and Mark23 Rough edges of a polymer-coated individual sheet are also shown in the inset of Fig. 6(c).
Figure 6(d) shows the crack propagation in the amorphous carbon/graphite side (back side) of the uniformly dispersed VGN thin film after the tensile test. These cracks form during the tensile test and when they meet, the sheet ruptures. As can be seen in the inset of Fig. 6(d), the crack does not propagate on a straight line and deflects many times indicating that it encounters rigid inclusions. Reference Rafiee, Rafiee, Srivastava, Wang, Song, Yu and Koratkar22 This is significant since it not only causes the crack to grow locally but also increases the toughness by expanding the total fracture surface area and energy absorption. Thus, we predict a high toughness for our VGN samples due to the large aspect ratio of the VG sheets and considering the tilting and twisting of the cracks.
Figures 6(e) and 6(f) illustrate VG sheets pulled out from the polymer at the ruptured line in a uniformly dispersed graphene sample. The fact that these sheets are still coated with polymer indicated a strong adhesion between the host matrix and the sheets. Reference Zhang, Zhu, Lin, Ruoff, Hu, Schaefer and Mark23 This tenacious interface is attributed to the small thickness of the VGs, curly and wrinkled nature of the sheets, bent and tapered edges of the completely grown sheets, as well as the rough edges in the infant ones. The folded edges of two graphene sheets that are protruding out of the fracture surface can be clearly seen in Fig. 6(f). No graphene agglomeration is observed in this picture showing that the sheets preserved their initial position during the polymer spin-coating. The schematic in the inset of this picture depicts the fold direction of two graphene sheets. This topology entangles the polymer while a force is applied and increases the strength.
Catalyst-free RF-PECVD growth of VG sheets makes inexpensive wafer-scale production of VG possible. The steps for the fabrication of the nanocomposite thin films are common microelectronic fabrication methods and can be readily performed at a wafer scale. Our future work will focus on the fabrication and characterization of uniformly dispersed VGN thin films with different weight percentages of the graphene fillers. Developing a new method for the fabrication of nanocomposites with uniformly dispersed graphene sheets can prepare the groundwork for the mass production of new composite materials with enhanced mechanical properties.
IV. CONCLUSION
While recent studies prove the fascinating properties of graphene-based nanocomposites, challenges related to the dispersion of the graphene sheets in the host polymer impede their wide use. Current methods for the dispersion of graphene sheets in the polymer are costly, time consuming, and usually only effective in a small weight percentage of the fillers. We introduced a new method to fabricate VG-based nanocomposite thin films with enhanced mechanical properties and uniform dispersion of VG sheets without graphene agglomeration. VG sheets were synthesized, characterized, and implemented in polymer nanocomposites. Two different types of samples with uniformly and randomly dispersed graphene sheets were fabricated. The glass transition temperature and mechanical properties of the nanocomposite samples were characterized. A significant improvement of the Young's modulus and ultimate stress in the uniformly dispersed VGN samples compared to the pure polymer was observed. This report brings together an understanding of the properties of VG sheets and the ways in which their properties can be exploited in polymer nanocomposite design.
ACKNOWLEDGMENTS
TEM imaging and analysis by Dr. Hessam Ghassemi and Dr. Jiong Zhao is acknowledged. We thank Dr. Jamie Ford of the Nanoscale Characterization Facility and Steven Szewczyk at the University of Pennsylvania for their help with characterization.