Introduction
Diamond exhibits many outstanding intrinsic properties, such as wide band gap (5.47 eV), high breakdown voltage field (10 MV/cm), high thermal conductivity (22 W/cm K), high carrier mobilities (3800 cm2/V s for holes; 4500 cm2/V s for electrons), larger carrier saturation velocity (1.05 × 107 cm/s for holes; 1.5 × 107 cm/s for electrons) etc., making it having potential applications in the field of electronic devices which can work in high frequency, high power, and high temperature.[Reference Imanishi, Horikawa, Oi, Okubo, Kageura, Hiraiwa and Kawarada1–Reference Crawford, Qi, McGlynn, Ivanov, Shah, Weil, Tallaire, Ganin and Moran10] When single crystal diamond is treated by hydrogen plasma, carbon–hydrogen (C–H) bonds will be produced on the diamond surface. Because of C–H bonds and negatively charged adsorbates on diamond surface, a two-dimensional hole gas layer will be formed below the diamond surface, resulting in a p-type conduction layer with 1013 /cm2 sheet carrier density and 50–150 cm2/V/s carrier mobility.[Reference Wang, Chang, Li, Zhao, Shao, Zhu, Fu, Zhang, Chen, Li, Liu, Fan, Bu, Wen, Zhang, Wang and Wang4–Reference Kitabayashi, Kudo, Tsuboi, Yamada, Xu, Shibata, Matsumura, Hayashi, Syamsul, Inaba, Hiraiwa and Kawarada6, Reference Imura, Hayakawa, Ohsato, Watanabe, Tsuya, Nagata, Liao, Koide, Yamamoto, Ban, Iwaya and Amano11] By now, hydrogen-terminated diamond (H-diamond) is widely used to fabricate electronic devices. To enhance the performance of H-diamond-based electronic devices, an excellent ohmic contact between metal and H-diamond is necessary.[Reference Werner, Job, Denisenko, Zaitsev, Fahrner, Johnston, Chalker and Buckley-Golder12–Reference Kono, Teraji, Kodama, Ichikawa, Ohnishi and Sawabe15] Recently, our group reported ohmic contact between Ir and H-diamond. A low specific contact resistivity (2.9 × 10⁻⁶ Ω cm2) and contact resistivity (1.27 Ω mm) between Ir and H-diamond was obtained by a transmission line model.[Reference Wang, Chang, Li, Zhao, Shao, Zhu, Fu, Zhang, Chen, Li, Liu, Fan, Bu, Wen, Zhang, Wang and Wang4] However, it is still not clear about the Φ BH value for Ir/H-diamond, which is the energy separation between valence band top (E V) and Fermi level (E F) at the contact point.[Reference Kono, Teraji, Kodama, Ichikawa, Ohnishi and Sawabe15] In order to estimate the value of Φ BH, two conventional methods are often used. One indirect method is extraction of Φ BH from the slope of the curve of specific contact resistivity versus acceptor concentration, such as Ti/diamond, Mo/diamond, Cr/diamond, Co/diamond, and Pd/diamond.[Reference Kono, Teraji, Kodama, Ichikawa, Ohnishi and Sawabe15–Reference Koide, Yokoba, Otsuki, Ako, Oku and Murakami17] However, the Φ BH calculated by this method could be greatly affected by the parameters deviation during the fitting process.[Reference Kono, Teraji, Kodama, Ichikawa, Ohnishi and Sawabe15] Another method of measurement Φ BH is x-ray photoelectron spectroscopy (XPS) technique. This method is widely used and more accurate, because XPS technique can directly determine electronic levels of diamond and metal.[Reference Li, Liu, Zhang, Wang, Wang, Liu and Wang14, Reference Kono, Teraji, Kodama, Ichikawa, Ohnishi and Sawabe15, Reference Kono, Kodama, Ichikawa, Yoshikawa, Abukawa and Sawabe18, Reference Kono, Teraji, Takeuchi, Ogura, Kodama and Sawabe19] According to Ref. Reference Li, Liu, Zhang, Wang, Wang, Liu and Wang14, the photoelectrons’ attenuation length is very small under XPS energies. This means that discontinuous Ir film should be deposited on H-diamond so that photoelectrons from both diamond in gap area and the metal can be collected during XPS measurement.[Reference Li, Liu, Zhang, Wang, Wang, Liu and Wang14] In order to accurately measure the Φ BH of metal/H-diamond, Kono et al.[Reference Kono, Teraji, Takeuchi, Ogura, Kodama and Sawabe19] provided a modified XPS measurement method based on simulation and experiment results. In this method, lightly boron doped H-diamond was used as the sample to ensure the same values of E V − E F at metal/H-diamond and gap area, because the density of holes produced by boron doped in diamond was too small to effect the energy band in gap area. To authors’ knowledge, few investigations on Φ BH value of Ir/H-diamond using XPS technique have been reported.
In this work, XPS technique has been implemented to directly determine the Φ BH for Ir ohmic contact on single crystal (001) H-diamond with lightly boron doped. The band diagram of Ir/H-diamond was obtained according to the Φ BH.
Experimental details
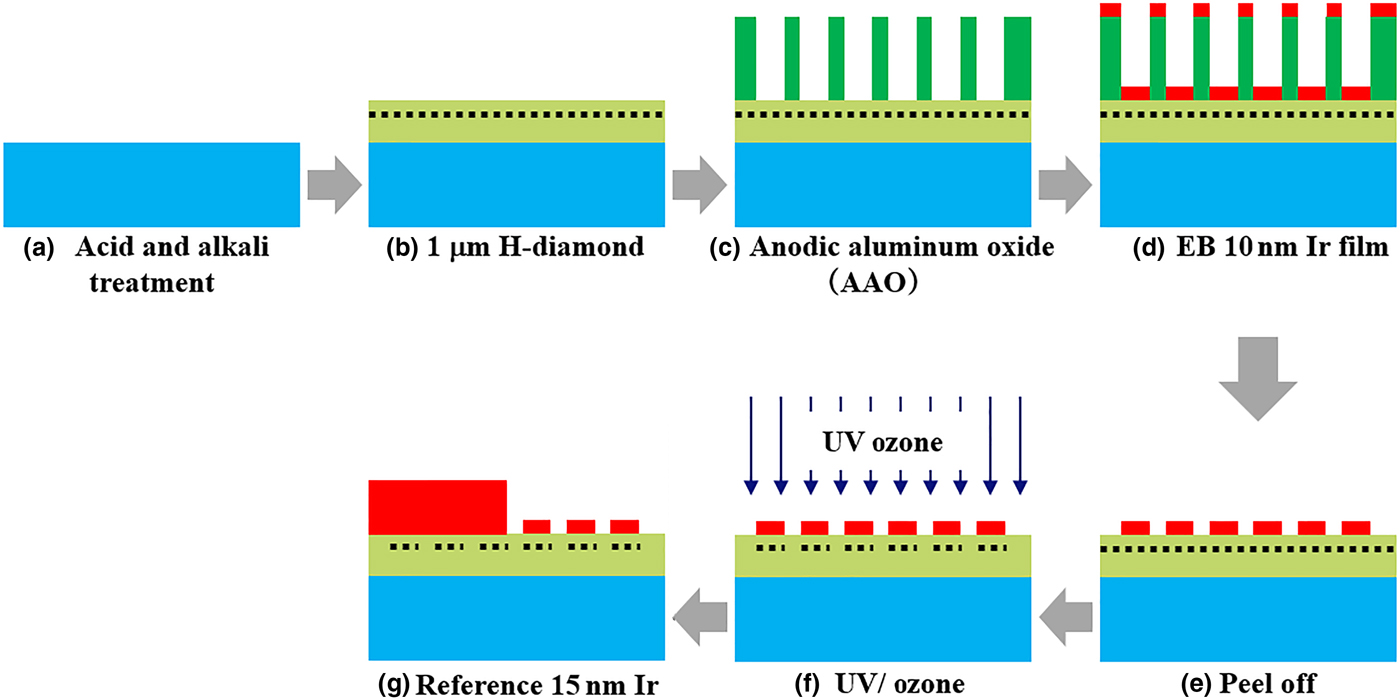
CVD synthesized (001) single crystal diamond (3 × 3 × 0.5 mm3) was used as a substrate. Figure. 1 shows the fabrication process of this sample. The substrate was cleaned by acid and alkali to remove the non-diamond phase. Then, the microwave plasma enhanced chemical vapor deposition system was used to grow 1 µm single crystal H-diamond with boron concentration of ~1016/cm3. After that, 200 nm anodic aluminum oxide (AAO) film was transferred to the H-diamond surface using acetone. The diameter of holes was 70 nm, and the distance of two holes center was 100 nm in AAO film. Next, the electron beam (EB) technique was used to deposit 10 nm Ir film on the sample surface. Once the deposition process performed, the sample was dipped into water to peel off the AAO film. By this method, Ir islands with 70 nm diameter were formed on the H-diamond surface. After that, UV/ozone was used to oxidize the C–H to carbon–oxygen bonds on the diamond surface at gap areas. Next, 15 nm Ir film as a reference electrode was deposited on half of the sample by photolithography and EB techniques. Once the fabrication process completed, the sample was measured by XPS. The details of experiments mentioned above were reported in our previous work.[Reference Wang, Chang, Zhang, Fu, Fan, Bua, Zhang, Wang, Wang and Wang3, Reference Wang, Chang, Li, Zhao, Shao, Zhu, Fu, Zhang, Chen, Li, Liu, Fan, Bu, Wen, Zhang, Wang and Wang4, Reference Wang, Fu, Hu, Li, Liu, Li, Lin, Fu, Wang and Wang7, Reference Li, Liu, Zhang, Wang, Wang, Liu and Wang14].
Fabrication process of the sample: (a) substrate cleaning; (b) H-diamond growth; (c) AAO film transferred to the H-diamond surface; (d) Ir film deposition; (e) AAO film peeled off; (f) C–H oxidized to carbon-oxygen bonds on diamond surface at gap areas; and (g) reference Ir film deposition.

Results and discussion
In order to investigate the quality of the sample, atomic force microscopy (AFM), Micro-Raman with a 532 nm laser and x-ray diffraction (XRD) were used. The roughness value measured by AFM was 0.506 nm. The average Raman FWHM value was 3.9/cm. The XRD FWHM value was 0.012°. The measurement details have been reported in our previous work.[Reference Wang, Chang, Zhang, Fu, Fan, Bua, Zhang, Wang, Wang and Wang3]
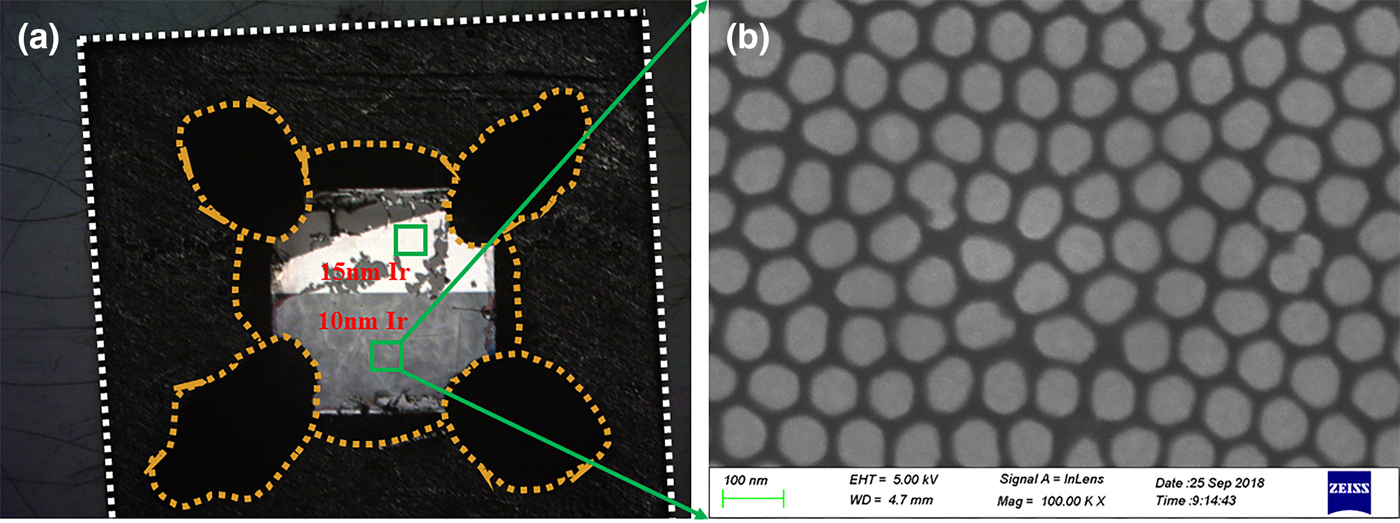
Figure 2(a) shows the optical photograph of the sample in the XPS measurement. The white dashed line area was molybdenum (Mo) plate in dimension of 10 × 10 × 1 mm3. The black areas encircled by orange dashed line were colloidal graphite. The Ir/H-diamond sample in Fig. 1(g) was pasted on the Mo plate by colloidal graphite shown as Fig. 2(a). By this method, the charge accumulation could be reduced during XPS measurement. The green squares were XPS measurement areas in Fig. 2(a). Figure 2(b) shows the scanning electron microscope (SEM) result of Ir islands on the H-diamond surface. In order to reduce the effect of electric field on the Φ BH during SEM measurement, the sample was characterized by SEM after XPS determination finished. In Fig. 2(b), Ir islands were clearly observed.
(a) Sample preparation for XPS measurement and (b) SEM result of Ir islands on H-diamond formed by AAO.

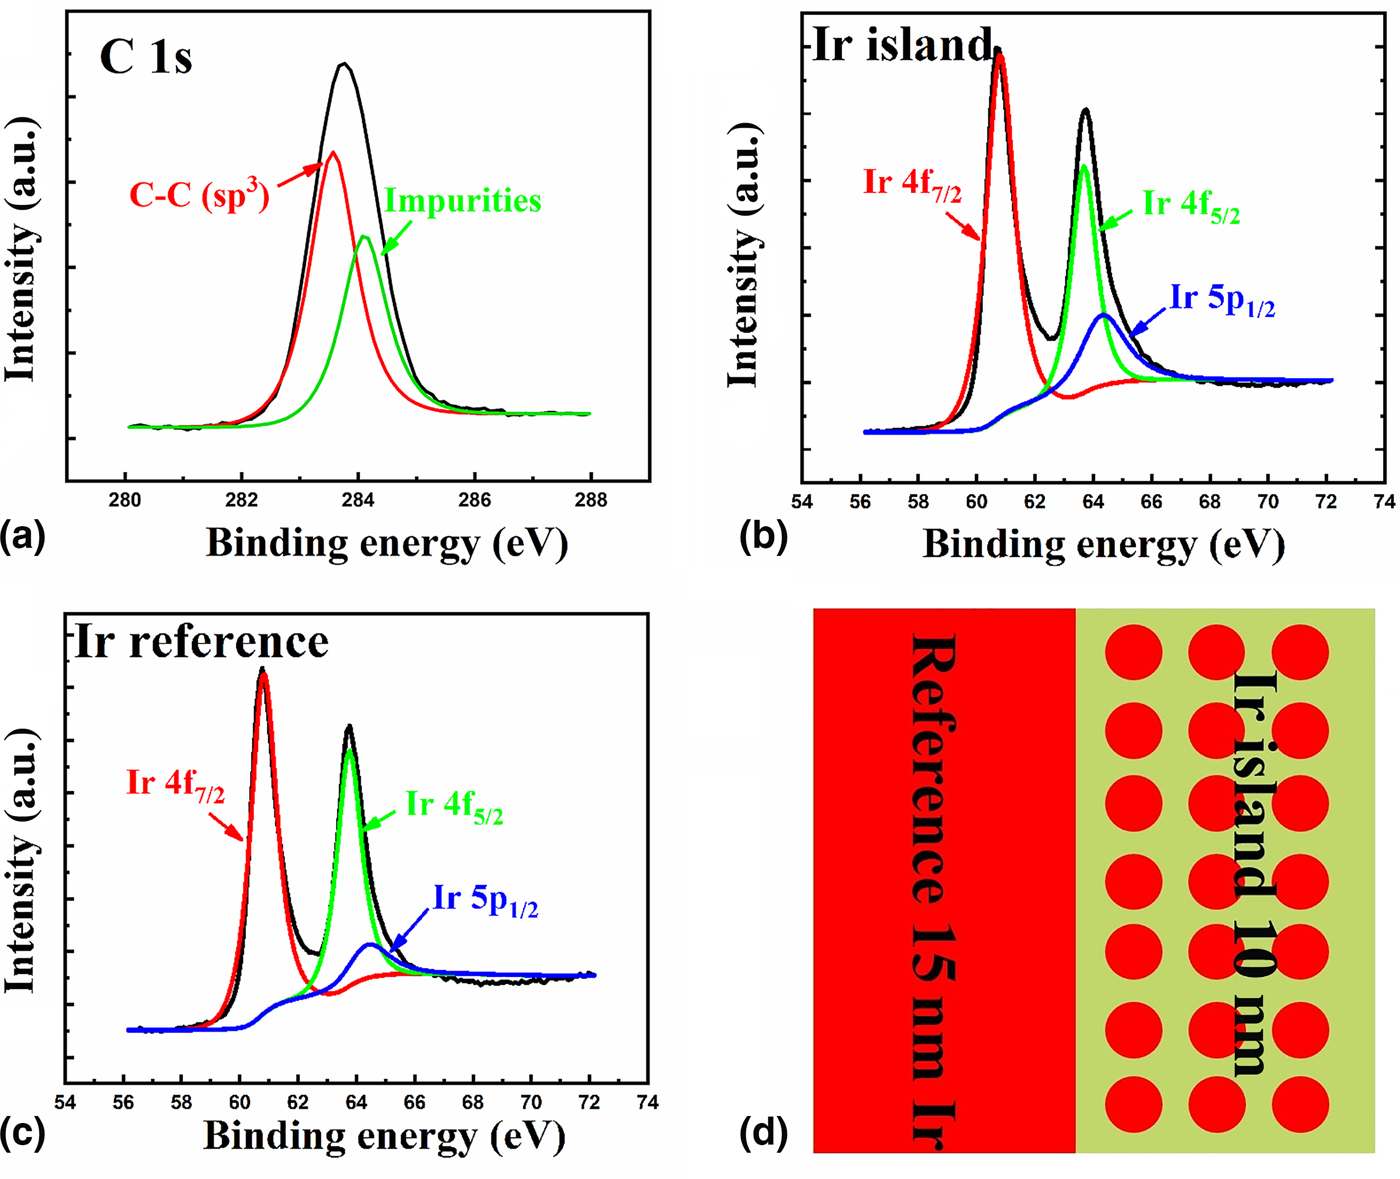
Figure 3 shows the XPS results of the sample. Figures 3(a) and 3(b) were the C1s and Ir XPS spectra from the area of 10 nm Ir islands. Figure 3(c) was the Ir XPS spectrum from the area of 15 nm reference Ir film. Figure 3(d) was the schematic of the sample. Each of the XPS spectra have been fitted with Voigt functions to precisely determine the binding energies of each peaks.[Reference Kono, Teraji, Kodama, Ichikawa, Ohnishi and Sawabe15] In Fig. 3(a), the C 1s XPS spectrum from area of 10 nm Ir islands area was composed of two peaks, whose binding energies located at 283.56 ± 0.02 and 284.10 ± 0.02 eV. The peak position of 283.56 ± 0.02 eV was related to C–C (sp3) bonds in Fig. 3(a).[Reference Li, Liu, Zhang, Wang, Wang, Liu and Wang14] The other peak position of 284.10 ± 0.02 eV was attributed to carbon-containing impurities according to our previous work.[Reference Li, Liu, Zhang, Wang, Wang, Liu and Wang14] In Fig. 3(b), the Ir XPS spectrum from 10 nm Ir islands area was composed of Ir 4f7/2, 4f5/2, and 5p1/2. The main component in 10 nm Ir XPS spectrum was the Ir 4f7/2 at 60.80 ± 0.02 eV.[Reference Freakley, Ruiz-Esquius and Morgan20] In Fig. 3(c), the Ir XPS spectrum form 15 nm reference Ir film was composed of Ir 4f7/2, 4f5/2, and 5p1/2. The main component in 15 nm reference Ir XPS spectrum was the Ir 4f7/2 at 60.82 ± 0.02 eV.[Reference Freakley, Ruiz-Esquius and Morgan20]
XPS results of (a) C 1s and (b) Ir at 10 nm Ir islands area; (c) XPS result of Ir at 15 nm reference Ir film; and (d) schematic of the sample.

In order to calculate the Φ BH value of Ir/H-diamond, the following equations were used[Reference Kraut, Grant, Waldrop and Kowalczyk21]:
 $$\Phi _{{\rm BH}} = E_{{\rm C1s}}^{{\rm Ir\_island/diamond}} -{\rm \Delta} E_{{\rm diamond}}-{\rm \Delta} E_{{\rm Ir}\;{\rm 4}{\rm f}_{7/2}}$$
 $${\rm \Delta} E_{{\rm Ir}\;{\rm 4}{\rm f}_{7/2}} = E_{{\rm Ir}\;{\rm 4}{\rm f}_{7/2}}^{{\rm Ir\_island/diamond}} -E_{{\rm Ir}\;{\rm 4}{\rm f}_{7/2}}^{{\rm Ir\_reference/diamond}} $$
In these equations, the  $E_{{\rm C1s}}^{{\rm Ir\_island/diamond}} $ value was the XPS peak position of C 1s from the area of 10 nm Ir islands, which was 283.56 ± 0.02 eV in Fig. 3(a). The ΔE diamond value was energy difference between E V and C 1s core-level for the diamond, which was 284.01 ± 0.12 eV according to previous report.[Reference Kono, Kodama, Ichikawa, Yoshikawa, Abukawa and Sawabe18] The
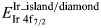 $E_{{\rm Ir}\;{\rm 4}{\rm f}_{7/2}}^{{\rm Ir\_island/diamond}} $ and
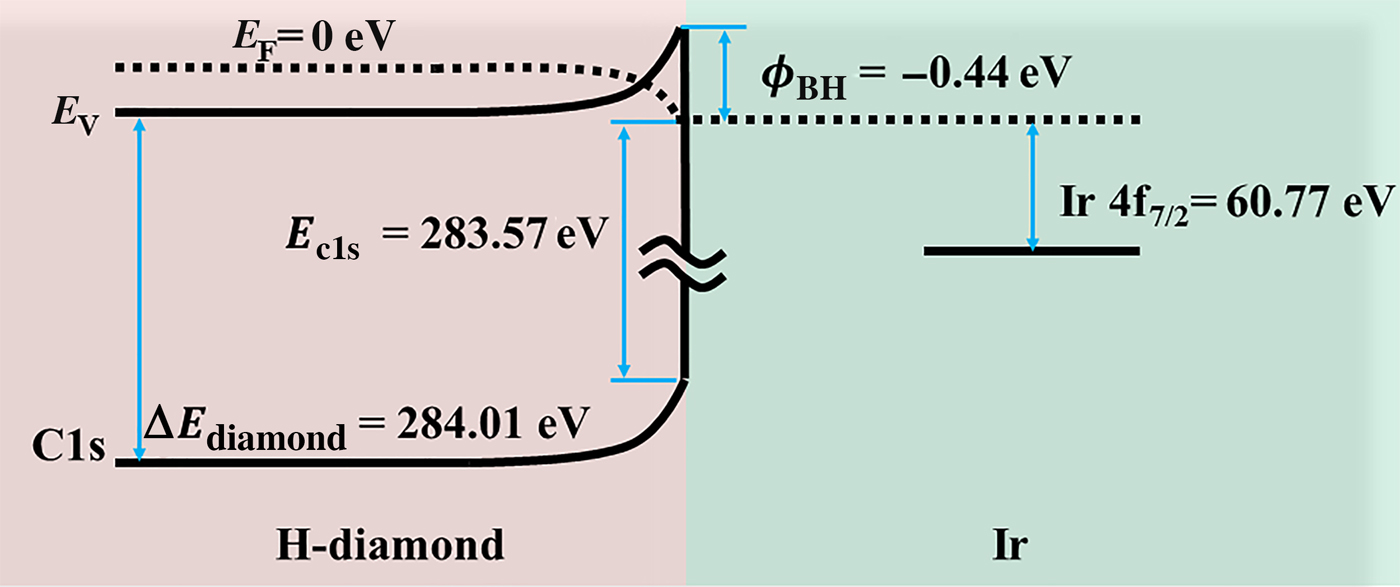
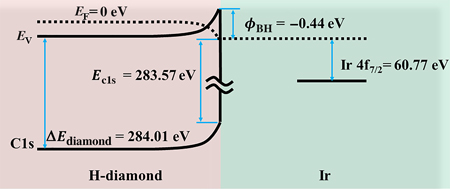
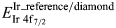 $E_{{\rm Ir}\;{\rm 4}{\rm f}_{7/2}}^{{\rm Ir\_reference/diamond}} $ values were the XPS peak positions of Ir 4f7/2 from the 10 nm Ir islands and 15 nm reference Ir film area, respectively, which were 60.80 ± 0.02 and 60.82 ± 0.02 eV. Thus, the Φ BH value of Ir/H-diamond was calculated as Φ BH = (283.56 ± 0.02) − (284.01 ± 0.12) − [(60.80 ± 0.02) − (60.82 ± 0.02)] = −0.43 ± 0.14 eV. The negative Φ BH value of Ir/H-diamond indicates that Ir is suitable for ohmic contact with H-diamond, which agrees with our previous electrical measurement results.[Reference Wang, Chang, Li, Zhao, Shao, Zhu, Fu, Zhang, Chen, Li, Liu, Fan, Bu, Wen, Zhang, Wang and Wang4] Then, the band diagram of Ir/H-diamond ohmic contact was obtained shown as Fig. 4.
Schematic of band diagram for Ir/H-diamond ohmic contact.

In order to compare the experimental Φ BH value of Ir/H-diamond with the theoretical Φ BH (Φ BHT) value, the following formula was used[Reference Tung22]:
 $$\Phi _{{\rm BHT}} = S(E_{\rm g}-\Phi _{{\rm Ir}} + \chi _{{\rm diamond}}) + (1-S)\Phi _{{\rm CNL,diamond}}$$
In this formula, S is the pinning factor; E g is the diamond band gap; Φ Ir is the Ir work function; χ diamond is the H-diamond electron affinity; and Φ CNL,diamond is the diamond charge neutrality level. For H-diamond and Ir, the S, E g, Φ Ir, χ diamond, and Φ CNL,diamond were 0.7, 5.47, 5.27, −1.3, and 1.4 eV, respectively.[Reference Li, Liu, Zhang, Wang, Wang, Liu and Wang14] Thus, Φ BHT was −0.35 eV. Considering the error limit of ±0.14 eV formed by XPS measurement and calculation process, the range of experimental Φ BH value was from −0.29 to −0.57 eV, which agreed with the Φ BHT value.
Conclusions
In summary, Ir islands with a diameter of 70 nm were formed on the single crystal H-diamond (001) surface using AAO. The Φ BH value of Ir islands contact with H-diamond (001) was directly measured by XPS technique to be −0.43 ± 0.14 eV, indicating that Ir was a good choice for ohmic contact with H-diamond. The band diagram of Ir/H-diamond was obtained. Considering the experimental error of ±0.14 eV, the experimental Φ BH value was in good accordance with the theoretical Φ BH value of −0.35 eV.
Acknowledgment
This work was supported by the National Natural Science Foundation of China (No. 61705176) and China Postdoctoral Science and Foundation (No. 2017M620449 and 2018T111056). We thank Mr. ZiJun Ren at the Instrument Analysis Center of Xi'an Jiaotong University for his assistance with SEM analysis.