Introduction
Traditionally, overall impairment and functioning in attention-deficit/hyperactivity disorder (ADHD) has been assessed in clinical trials using global clinician ratings (Clinical Global Impressions [CGI] scale scores).Reference Guy 1 This instrument has remained a universally accepted standard on the basis of what is assumed to be good face validity, although a psychometric validation is also required to confirm this assumption. In the context of clinical trials, however, it is possible that clinicians may complete the CGI based on symptom severity (Clinical Global Impressions–Severity; CGI-S); for example, with less consideration for other areas of overall burden of illness such as functioning, health-related quality of life (HRQoL), and adaptive skills.Reference Rentz, Matza, Secnik, Swensen and Revicki 2 The Committee for Medicinal Products for Human Use at the European Medicines Agency stated in its guidance 3 that efficacy in European ADHD clinical trials should be assessed not only by impact on symptoms but also on functional outcomes (school performance, social/occupational functioning). This guidance supports the assessment of symptoms and functioning in ADHD trials and highlights the need for a consistent, reliable, and shared interpretation for functional scales of ADHD. Currently, relatively few instruments have been established as valid measures of functional impairment and HRQoL in patients with ADHD. There is some evidence to support the reliability and validity of the Weiss Functional Impairment Rating Scale–Parent Report (WFIRS-P) and the Child Health and Illness Profile–Parent Report (CHIP-CE-PRF76) as measures of functioning and HRQoL in patients with ADHD (M. Weiss, unpublished observations). As the WFIRS-P is increasingly being used to assess treatment efficacy, estimating a minimal important difference (MID) for the WFIRS-P and CHIP-CE-PRF76 would help fulfill this need.
Demonstration of a statistically significant change in a patient-reported outcome (PRO) score or any other measure does not necessarily imply a clinically meaningful change that is perceived by the patient.Reference Hays and Woolley 4 Therefore, interpreting the clinical meaning of a statistically significant observation is an important task that helps us to interpret clinical and functioning data.Reference Guyatt, Osoba, Wu, Wyrwich and Norman 5 , Reference Revicki, Erickson and Sloan 6
One way to interpret an observed statistically significant change in a PRO measure is to define what magnitude of observed change in a PRO is perceived by the patient as minimally clinically meaningful. The MID of a measure is defined as “the smallest difference in score in the domain of interest that patients perceive as important, either beneficial or harmful, and which would lead the clinician to consider a change in the patient’s management (p. 377).”Reference Guyatt, Osoba, Wu, Wyrwich and Norman 5 In addition, attempts have been made to determine a clinician-reported meaningful difference.Reference Goodman, Faraone, Adler, Dirks, Hamdani and Weisler 7 This study demonstrated that an improvement in ADHD-rating scale-IV score of 25–30% (parent rating) is needed to achieve a change of 1 level on the Clinical Global Impressions–Improvement (CGI-I) scale (minimally improved). A score of ~50–60% is needed to achieve a rating of much improved (2-level improvement). These estimates can provide benchmarks to measure efficacy of a treatment.
Methods used to estimate MID are either statistically based (derived from the distributional properties of the observed outcomes) or based on an external criterion from another measure (called an anchor). Two statistically based methods have been proposed to estimate the MID; both are measures of statistical dispersion: the standard error of measurement (SEM) and half a standard deviation (½ SD).Reference Guyatt, Osoba, Wu, Wyrwich and Norman 5 , Reference Wyrwich, Tierney and Wolinsky 8 The SEM has been shown to have a strong link to anchor-based individual change estimates for many PRO instruments.Reference Wyrwich, Tierney and Wolinsky 8 – Reference Wyrwich and Tardino 10 In addition, ½ SD of a measure was proposed as a good approximation of the MID, but this measure was also criticized as an arbitrary estimation of the MID and some have suggested that a ½ SD value of 0.3 is perhaps a better estimate than 0.5.Reference Farivar, Liu and Hays 11 Revicki et al Reference Revicki, Hays, Cella and Sloan 12 have argued that an MID should primarily be estimated with respect to an individual patient’s perception of change, and that this is best done using anchor methods in which the individual reports the amount of change that he/she perceives. Distributional methods to estimate the MID do not indicate the importance of a change from the patient’s perspective and are based solely on variation around the group mean. The anchor method is based on a specific question that asks patients to indicate the extent to which they have perceived a change in their well-being compared with a previous point in time. The MID is then estimated based on the change scores of the subgroup of people who report the smallest degree of change that has been captured on the scale.
The objective of this study was to estimate the MIDs for 2 commonly used instruments: the WFIRS-P and the CHIP-CE-PRF76, using anchor-based and distribution-based methods.
Methods
Sample
The study protocol and all case report forms were approved by a central institutional review board (Protocol #A1941) prior to the start of the study. Eligible parents were sent a consent form by post and were asked to sign and return it before receiving all study questionnaires through the post.
The MIDs were assessed for parents of children and adolescents with ADHD in the United Kingdom (UK). Parent proxy measures are commonly used in pediatric studies because self-reports by young children with ADHD are not considered valid, and proxy reports by parents were used in the initial development and validation of the WFIRS-P and CHIP-CE-PRF76 instruments (M. Weiss, unpublished observations).Reference Riley, Coghill and Forrest 13 In addition, for consistency and to estimate the MIDs for parent proxy versions, parents of adolescents were also asked to complete the instruments.
Participants were selected using the following criteria: parents and primary caregivers (guardians) of children (aged 6–12 years) and adolescents (aged 13–17 years) with ADHD, who were at least 18 years of age. A recruitment company contacted 1300 families from a patient panel that had previously indicated that a member of their family had a confirmed diagnosis of ADHD. Potential participants completed a screening form to determine if they were residents in the UK and were the primary caregiver for a child or adolescent (<18 years) with a diagnosis of ADHD. The screening form to assess eligibility was developed with help from an ADHD expert. Eligibility criteria were minimal to reflect the real-world setting: parents of children and adolescents had to report a primary diagnosis of ADHD on the child/adolescent’s behalf, and that the child/adolescent may or may not have been currently receiving treatment (pharmacological or nonpharmacological). Parents were excluded if the child/adolescent with ADHD was reported to be diagnosed with any of a set of prespecified psychiatric disorders (including pervasive developmental disorder, Asperger’s syndrome, autism, depression, and/or conduct disorder) that could influence the child/adolescent’s HRQoL in a way that could not be distinguished from the impact of ADHD. This was done to avoid possible confounding of the data and thus the estimates of MID for ADHD instruments. All contacted parents were invited to complete questionnaires at 2 time points (baseline and a follow-up 4 weeks later).
Study design to determine MID
The follow-up assessment included the assessment of change (the anchor questions), which was designed to enable the anchor-based estimation of MID that was completed by a subgroup of the sample. The study was purely observational.
Baseline
The study employed a convenience sample, and parents were paid a nominal amount to complete the surveys (approximately £5 GBP [$8 USD]). To summarize, study questionnaires for phase 1 included a sociodemographic form, the WFIRS-P, the CHIP-CE-PRF76, and the Pediatric Quality of Life scale (PedsQL) (each is described in more detail below). Baseline was defined as the time of completing the first assessment.
Second assessment
All parents who completed the baseline assessments were requested to complete the same instruments (WFIRS-P, CHIP-CE-PRF76, and PedsQL) at follow-up (4 weeks). The 4-week period was chosen to allow scope for some change in functioning and/or HRQoL related to their child/adolescent’s ADHD and is also consistent with the recall period of the WFIRS-P (M. Weiss, unpublished observations). In addition, parents were asked to complete anchor questions associated with each global score for the measure and for each subscale for the WFIRS-P and CHIP-CE-PRF76. Separate anchor questions for each subscale were used to allow for the possibility that the children/adolescents may have experienced an important improvement in 1 area of functioning while other areas remained stable or perhaps even deteriorated. A global anchor question would not easily support the interpretation of this type of pattern of changes on different subscales.
Instruments
The WFIRS is a 50-item measure of functioning, and is scored in 6 domains: Family, Learning and School, Life Skills, Child’s Self-Concept, Social Activities, and Risky Activities. Each survey item is rated on a 4-point Likert scale, and sub-domains and total scores are calculated, with lower scores indicating better functioning. The WFIRS-P is a proxy version of the scale in which the parent is asked to rate the functioning of his or her child. The WFIRS-P has been shown to have high internal consistency (Cronbach’s alpha=0.93), and discriminant and convergent validity has been established through moderate correlations with the ADHD Rating Scale (ADHD-RS), the General Assessment of Functioning, and the CHIP-CE-PRF76 (M. Weiss, unpublished observations).
The CHIP-CE-PRF76 is a 76-item generic HRQoL measure that is completed by parents. There are 5 domains: Satisfaction, Comfort, Resilience, Risk Avoidance, and Achievement. Raw scores are converted to standardized T-scores, with higher scores indicating better functioning. The parent report form was used in this study.
The CHIP-CE-PRF76 was validated in children with ADHD (n=1477) in the ADORE study.Reference Riley, Coghill and Forrest 13 ADORE was a large, observational, epidemiological study of ADHD in the European Union and was considered the best benchmark for the current study. Internal consistency was good (Cronbach’s alpha >0.70) for all domains and sub-domains of the measure. The domains had moderate-to-high correlations (0.18–0.65) with other instruments, such as the ADHD-RS, CGI-S, Family Strain Index, and Strengths and Difficulties Questionnaire, supporting its validity.Reference Riley, Coghill and Forrest 13
The PedsQL (version 4.0) is a 23-item generic HRQoL measure for children aged 5–7 and 8–12 years, and adolescents aged 13–18 years.Reference Varni and Burwinkle 14 It includes 4 domains, measuring Physical Functioning, Emotional Functioning, Social Functioning, and School Functioning, with higher scores representing better function. The age-appropriate, parent-completed version of the PedsQL was used in this study.Reference Varni, Seid and Kurtin 15 The measure has an MID of 4.5 (regardless of age group)Reference Varni, Seid and Kurtin 15 on the total score, which was established using the distribution-based methods only.
Anchor questions
At the 4-week assessment, parents were asked to complete the WFIRS-P and CHIP-CE-PRF76 assessments again and, additionally, to rate any change in the child/adolescent since the baseline assessment. There were anchor questions to assess the overall change and the 12 subscales of the WFIRS-P and CHIP-CE-PRF76. Each question asked the parents to rate any change; for example, “Thinking back to your responses for section B (Learning and School), please rate the change in your child’s overall problems related to learning and school since the first time you completed this questionnaire from the following options.” Responses were based on a 5-point Likert scale and ranged from “much better,” “a little better,” and “about the same” to “a little worse” and “much worse.”
The anchor questions were designed as an independent assessment of the observed change in the children or adolescents with ADHD since the baseline assessment.Reference Guyatt, Osoba, Wu, Wyrwich and Norman 5 The anchor ratings were used to identify those parents who had reported that their child/adolescent was either “a little worse” or “a little better” in order to estimate the MID, and those parents were included in the analysis.
Sociodemographic form
A sociodemographic questionnaire was also completed by parents at baseline only. It included questions about the child/adolescent’s and participant’s own background, such as age, sex, ethnicity, child’s schooling, and parent/caregiver’s employment, education, and marital status.
Statistical analysis
Quality checks were performed to ensure completeness and accuracy of the data. These included checking missing data and verification of data on case report forms against study electronic datasets. All instruments (WFIRS-P, CHIP-CE-PRF76, and PedsQL) were scored and analyzed according to developers’ guidelines. Raw scores of the CHIP-CE-PRF76 were converted to standardized T-scores for each domain, using a published algorithm.Reference Riley, Forrest, Starfield, Rebok, Robertson and Green 17 Descriptive statistics (mean, median, SD, frequency) were calculated as appropriate for all questions, and all analyses were completed using SPSS, version 17 (IBM, Armonk, NY, USA). Background demographic data were compared against data from the ADORE study by descriptives only.Reference Preuss, Ralston and Baldursson 18 Missing data were left as missing, which meant that parents were excluded from specific analyses (eg, if a parent provided baseline but no follow-up data). All instruments (WFIRS-P, CHIP-CE-PRF76, and PedsQL) were compared between baseline and follow-up using 1-sample t-tests. Responses to the anchor questions were compared between children and adolescents who were taking an ADHD medication at baseline and those who were not. P-values presented are nominal (uncorrected for multiplicity). All analyses were conducted for the parents of the child and adolescent separately and combined as a total group.
For the anchor-based MID method, parents were grouped according to their responses to the anchor questions, and the mean change from baseline for each group was estimated. Participants who reported either “a little better” or “a little worse” change were included in the minimal change group, with others included in a no-change group or a much better/worse group. Participants who reported “a little better” or “a little worse” change were used to establish the MID for the anchor-based approach.
Distribution-based methods were also used to estimate the MID for the WFIRS-P total score and CHIP-CE-PRF76 domains.Reference Guyatt, Osoba, Wu, Wyrwich and Norman 5 , Reference Wyrwich, Tierney and Wolinsky 8 Two common methods, SEM and ½ SD, were used to estimate the MID.Reference Wyrwich, Tierney and Wolinsky 8
Results
Participant characteristics
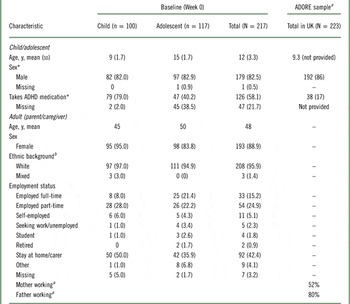
Parents who expressed an interest in the study (N=430) were screened and 398 UK parents were sent consent forms. A total of 288 parents (72%) took part in the study, of which 217 (100 parents of children and 117 parents of adolescents; Table 1) completed all the questionnaires at baseline and follow-up. The majority of parents in both groups were mothers (95% of parents of children and 84% of parents of adolescents) and were of white background (97% and 95%, respectively). Almost twice as many children (79%) were taking an ADHD medication at baseline compared with adolescents (40%). There were no other significant differences between those who had completed baseline assessments in the current study and those in the ADORE study.
Child/adolescent and parent demographic/background characteristics at baseline

Data are given as n (%) unless otherwise stated.
a Data from Preuss et al Reference Preuss, Ralston and Baldursson 18 ; b not all data are shown.
* p<0.05. The p-values are for comparing group of child and adolescent. No multiplicity adjustments were performed, the p-values need to be interpreted with caution.
ADHD, attention-deficit/hyperactivity disorder; SD, standard deviation.
Baseline and follow-up (4-week) data for WFIRS-P and CHIP-CE-PRF76
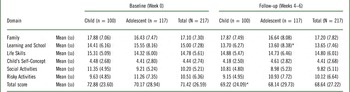
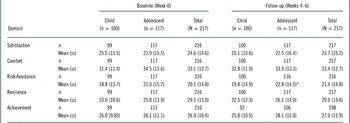
Mean scores for the WFIRS-P were significantly different (p<0.05) for the total score (child sample only) and Learning and School (adolescent sample only) at follow-up compared with at baseline; all other comparisons were not significantly different (Table 2). Mean scores for the CHIP-CE-PRF76 were significantly different (p<0.05) for the Risk Avoidance domain (adolescent sample only) at follow-up compared with at baseline; all other domains were not significantly different (Table 3).
Participants’ WFIRS-P scores at baseline and follow-up

* p<0.05. The p-values are for comparing group of child and adolescent. No multiplity adjustments were performed, the p-values need to be interpreted with caution.
SD, standard deviation; WFIRS-P, Weiss Functional Impairment Rating Scale–Parent Report.
Participants’ CHIP-CE-PRF76 domain and sub-domain scores at baseline and follow-up

* p<0.05. The p-values are for comparing group of child and adolescent. No multiplity adjustments were performed, the p-values need to be interpreted with caution.
CHIP-CE-PRF76, Child Health and Illness Profile–Parent Report; SD, standard deviation.
Minimal important difference
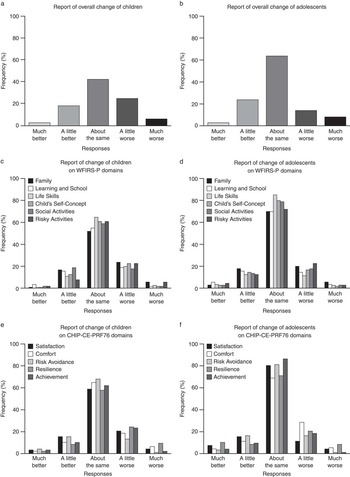
The anchor question data showed that most parents reported no change in their child/adolescent from baseline (42% and 64%, respectively). A proportion reported that their child/adolescent was “a little better” (18% child, 21% adolescent) or “a little worse” (25% child, 12% adolescent), and a much smaller proportion reported that their child/adolescent was “much better” (3% child, 3% adolescent) or “much worse” (6% child, 7% adolescent) (Figures 1a and 1b). Change from baseline for children/adolescents by instrument and domain are shown in Figures 1c–1f. The figures show that similar variation occurred for both children and adolescents during the time period. Some participants reported change similarly across both measures and the overall change anchor question.
Change as reported by the anchor questions. CHIP-CE-PRF76, Child Health and Illness Profile–Parent Report; WFIRS-P, Weiss Functional Impairment Rating Scale–Parent Report.

The anchor question responses were not significantly different for parents who reported that their child/adolescent was taking pharmacological therapies for ADHD (53% reported no change) compared with those who were not on medication (62% reported no change) (p > 0.05 for overall change and for all subscales).
WFIRS-P
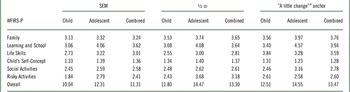
The MID estimates for the WFIRS-P based on statistical dispersion and anchor question are shown in Table 4. The MID estimates generated by the 3 different methods were similar, and results from all methods showed some evidence of convergence, with values of 11.31 (SEM), 13.30 (½ SD), and 13.47 (anchor) for overall change in WFIRS-P for the total sample. The distribution-based methods produced lower estimates than the anchor-based method. MID estimates within each domain and by child and adolescent are also presented in Table 4.
MID estimates of WFIRS-P by child, adolescent, and combined scores

a Including “a little better” or “a little worse.”
½ SD, half a standard deviation; MID, minimal important difference; SEM, standard error of measurement; WFIRS-P, Weiss Functional Impairment Rating Scale–Parent Report.
CHIP-CE-PRF76
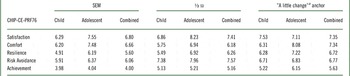
The MID estimates for the CHIP-CE-PRF76 based on statistical dispersion and anchor question are shown in Table 5. There was also evidence of convergence between the different estimates, but the estimates differed more than they did for the WFIRS-P. The range of MID estimates for the CHIP-CE-PRF76 varied by domain. The Satisfaction domain ranged from 6.80 to 7.41, the Comfort domain from 6.18 to 7.34, the Resilience domain from 5.60 to 6.72, the Risk Avoidance domain from 6.06 to 7.57, and the Achievement domain from 4.00 to 5.63, for the total sample. MID estimates within each domain and by child and adolescent are also presented in Table 5.
MID estimates for CHIP-CE-PRF76 by child, adolescent, and combined scores

a Including “a little better” or “a little worse.”
½ SD, half a standard deviation; CHIP-CE-PRF76, Child Health and Illness Profile–Parent Report; MID, minimal important difference; SEM, standard error of measurement.
Discussion
This study presents 3 ways of calculating the MID for the WFIRS-P and CHIP-CE-PRF76, including 2 distributional methods and an anchor-based method. To date, this is the first study that has estimated MIDs for these 2 outcomes instruments. The study presents MIDs for children and adolescents separately as well as for the combined sample, which we believe is also a potentially useful addition to the literature; this allows for greater flexibility of use of these values in future studies. The study was conducted in a naturalistic setting without an intervention and therefore measured participants’ change entirely subjectively. Although a naturalistic, community sample was found to be largely stable over time, there was enough variance to be able to determine the degree of change that would be perceived by parents as clinically meaningful. Defining the MID in a naturalistic population provides the ideal reference point for future studies looking at whether the outcome of an intervention has provided clinically meaningful improvement. Treatment studies and clinical trials may predispose to a halo effect that biases the parent perception of whether their child has improved.
ADHD can impact the functioning of children and adolescents differently; for example, hyperactivity or other symptoms can present in varying ways.Reference Harpin 19 , Reference Hurtig, Ebeling and Taanila 20 Thus, participants’ scores on performance and functioning measures will vary by age. The current study enables future studies to use estimates by child or adolescent category and to determine change that is more specific to the age of the sample. Three different methods for estimating the MID were used because there is no gold standard method. The practice has been to use several methods to calculate the MID, which results in a range of MID values that can be considered, and if convergence is observed, the range is narrower, making it easier to determine a specific MID. In our analysis, there was a degree of convergence between the methods. This shows that, at least in our case, there is a reasonable range in which to determine the MID, although the methods vary in how they determine these values. The data suggest that the MID estimates for adolescents are slightly higher for WFIRS-P and higher for 4 of the 5 dimensions of the CHIP-CE-PRF76. This may be due to some domain items of the WFIRS-P being more applicable to adolescents (eg, Risky Activities); however, this needs to be studied further. The sample size of adolescents in the group reporting change was smaller, so these results need to be interpreted with caution. If verified, the finding underlines the importance of having separate estimates for children and adolescents. The WFIRS-P has demonstrated good reliability and validity in previous research in children and adolescents.Reference Gajria, Kosinski and Sikirica 21 , Reference Weiss, Iverson and Brooks 22 The results have shown that this is a robust functioning measure that can be used in the future to demonstrate treatment efficacy.
It is important for patients, clinicians, and healthcare decision makers to assess treatment benefit in a meaningful way. It is also important to be able to interpret the degree of change reported in clinical studies. The establishment of meaningful differences in outcomes measures assists in the interpretation of study findings. They can be used alongside estimates of statistical significance to understand the importance of any change in any patient-reported measures and, therefore, the likely clinical impact of a new treatment. The current study provides estimates that can show meaningful changes in quality of life or functioning of people with ADHD.
The anchor question data showed similar variation for children and adolescents during the time assessed. Although there was no intervention, some participants reported change similarly across both measures and the overall change anchor question, which shows that a 4-week period was adequate to assess change in people with ADHD. The changes observed in this study are likely characteristic of the day-to-day fluctuation seen in an otherwise stable population. The baseline of change in this naturalistic population forms a useful reference point of treatment as usual for comparison with systematic treatment studies. Even in a treated and untreated naturalistic, community population, patients may show either deterioration or improvement because of changes in their family or school setting, or community-based changes in treatment.
In the present study we used 3 methods to assess MID, but we would suggest that the estimate based on the individual anchor question should be considered the most important or primary estimate. This is because the anchor-based method incorporates parents’ perception of the meaningfulness of the change in score. It also yields practical meanings that can be interpreted easily by both clinicians and parents/patients. As the distribution-based methods are purely statistically driven, they do not incorporate patients’ perceptions of the importance and meaningfulness of the change. Further, the choice of ½ SD rather than ⅓ or ⅔ is somewhat arbitrary.Reference Farivar, Liu and Hays 11
In the current study, 63% of the sample reported no change in scores on the WFIRS-P, which means that the MID estimates were based on the 29% of the sample who experienced a little change. This is a limitation of the present study, and arose in part due to the fact that the data were from a non-interventional study, and possibly also as a result of the duration of the follow-up period. A review of previous studies designed to identify MIDs in pediatrics revealed a wide range of sample sizes upon which the MID has been estimated. Sample sizes ranging from 34 participantsReference Newcombe, Sheffield and Chang 23 to 10,241 participantsReference Varni, Burwinkle, Seid and Skarr 16 have been included to evaluate MID using different approaches. Dhanani et al Reference Dhanani, Quenneville, Perron, Abdolell and Feldman 24 conducted an observational study to evaluate MID in pain associated with change in quality of life in children with rheumatic disease using the anchor-question approach. In that study, 369 (69%) of 533 children with rheumatic disease showed at least some change at the second visit. Newcombe et al Reference Newcombe, Sheffield and Chang 23 assessed MID for the Parent-Proxy Quality-of-Life Questionnaire for Pediatric Chronic Cough in 34 participants using distribution-based and anchor-based methods. Only 18 of the participants reported a change on the anchor. Similarly, Juniper et al Reference Juniper, Guyatt, Feeny, Ferrie, Griffith and Townsend 25 evaluated the psychometric properties of the Pediatric Asthma Caregiver’s Quality of Life Questionnaire, and the MID was estimated based on data from 23 of the 52 participants. Other studies have reported much larger sample sizes for the estimation of MID,Reference Varni, Burwinkle, Seid and Skarr 16 but these were typically secondary analyses of data from studies designed for other purposes. The sample size in the present study is within the range for studies designed to assess the MID of other outcome measures. Further work may be needed to explore whether the follow-up period needs to be longer in order to measure change in a non-interventional setting.
The interpretation of this study is subject to some important limitations. One limitation is the validity of the anchor questions themselves. Their validity as measures of change has not been established, and the questions themselves were not cognitively debriefed. The assessment of change from baseline using the anchor questions may have been subject to recall bias; however, this is a limitation of this method as all anchor questions will rely on recall.
Conclusions
This study estimated MID thresholds using different methods, which showed evidence of convergence. These thresholds can be used to interpret functional outcomes generated by the WFIRS-P and HRQoL data generated by the CHIP-CE. Future research should look at the MID in pharmacological and psychological treatment studies. Further work is also needed to establish the MID using an anchor method for parent-rated ADHD symptom scores. This would allow us to determine the extent to which parent perceived minimal improvement in symptoms is required to meet the MID threshold for non-symptom outcomes. This study has also demonstrated that, although a naturalistic treated and untreated ADHD sample is largely stable, parents are able to report on what they perceive to be meaningful change in functioning and quality of life. These data provide a reference point for interpreting whether changes in functioning and quality of life seen in clinical trials are clinically significant.
Disclosures
Paul Hodgkins has the following disclosures: Shire, employee, salary (when the research was completed); Vertex, employee, salary. Andrew Lloyd has the following disclosures: ICON PRO, sub-contractor, fees (ICON was contracted by Shire for this study). M. Haim Erder has the following disclosures: Shire, employee, salary, and stock options (when the research was completed). Juliana Setyawan has the following disclosures: Shire, employee, salary, and equity (when the research was completed). Rahul Sasané has the following disclosures: Shire, employee, salary, and stock options (when the research was completed). Beenish Nafees has the following disclosures: ICON PRO, employee, salary (at the time of conducting the study); Independent PRO consultant, self-employed, salary. Margaret Weiss has the following disclosures: Purdue, consultant, research support, and honoraria; Eli Lilly, speaker’s bureau, honoraria; Shire, speaker’s bureau, honoraria; Janssen, speaker’s bureau, honoraria; Rhodes, speaker’s bureau, honoraria.