


1. Introduction
The contrasts between baltic sea ice and its oceanic counterparts are manifold, extending from the history of its study to its growth environment. despite the long tradition of sea-ice studies in the economically important baltic sea waters (Reference Leppäranta, Makkonen, Palosuo and KuusistoLeppäranta and others, 2001), several fundamental aspects of the low-salinity and high-temperature baltic sea ice remain to be examined (Reference GranskogGranskog, 2004). regardless of the distinct differences in the growth environment compared to its arctic and antarctic counterparts, baltic sea ice also shows many similarities. most pertinent might be that despite the low water and hence also ice salinities, the ice shows a characteristic sea-ice structure, with, for example, brine inclusions (Reference KawamuraKawamura and others, 2001), that hosts an actively functioning food web (Reference KaartokallioKaartokallio, 2004), as in its oceanic counterparts. the wealth of information on sea ice from the arctic and antarctic has shaped our understanding of sea-ice growth, development and decay (Reference Eicken and JeffriesEicken, 1998).
To parameterize the amount of salt present in the ice, the concept of salt segregation coefficient (also called distribution coefficient or partition coefficient; for details see, e.g., Reference W.F. and AckleyWeeks and ackley, 1982; Reference Eicken and JeffriesEicken, 1998) is often used. in the case of sea ice, the coefficient is simply the ratio of the salinity of sea ice to that of parent sea water, and describes the effective partitioning of solute between the solid and solution. it has been shown that there exists a close relationship between the ice growth rate and the segregation coefficient (e.g. Reference Nakawo and SinhaNakawo and sinha, 1981). recently, however, the concept of a mushy layer has been put forward to explain physical processes leading to the observed salinity (profiles) of sea ice (e.g. Reference Wettlaufer, Worster and HuppertWettlaufer and others, 1997a, Reference Wettlaufer, Worster and HuppertB; Reference Worster and WettlauferWorster and wettlaufer, 1997), rather than the effective distribution coefficient which is solely based on ice growth rate. when sea ice forms, the liquid is cooled from above and the rejected salt causes the liquid to become denser. therefore, both the thermal and the compositional buoyancy have the potential to drive convection (Reference Wettlaufer, Worster and HuppertWettlaufer and others, 1997a). however, in this respect the baltic sea may also differ from its oceanic counterpart: because of the brackish water (salinity <24.7 psu (practical salinity units), the temperature of maximum density is reached prior to freezing, further cooling makes the water less dense and therefore there is no thermal convection. compositional convection is possible. however, based on laboratory experiments, thermally driven convection is important not only during initial cooling but also during ice formation (Reference Wettlaufer, Worster and HuppertWettlaufer and others, 1997a). recent observations of under-ice turbulent fluxes indeed suggest that a supercooled and thereby thermally stratified layer may form underneath baltic sea ice (Reference Uusikivi, Ehn and GranskogUusikivi and others, 2006). despite the fact that the salt segregation coefficient does not describe the actual physical processes contributing to the observed salinity profiles, the concept may provide useful information on approximate estimates of sea-ice salinity, especially for numerical studies. however, observations on salt ion ratios in baltic sea ice indicate that different ions are expelled at different rates from the ice during initial growth, in a sequence that can be explained by the diffusion rates of the ions (see Reference Granskog, Virkkunen, Thomas, Ehn, Kola and MartmaGranskog and others, 2004a).
The present study was carried out in order to investigate if the models for salt segregation developed from investigations on arctic and antarctic sea ice apply to the freezing of low-salinity (brackish) baltic sea conditions. the information gathered here is vital for the development of a baltic sea ice salinity model. it also provides a means to interpret salinity data of baltic sea ice and to derive estimates for ice growth modes and rates, in a fashion outlined by Reference Eicken and JeffriesEicken (1998), although isotopic properties generally outperform salinity in this respect (e.g. Reference Souchez, Tison and JouzelSouchez and others, 1988).
2. Material and Methods
Ice and under-ice water samples were collected weekly from january to april 2000 from landfast sea ice, in the vicinity of hailuoto island located in the northeastern part of the bothnian bay, baltic sea (64˚03' n, 24˚25' e). between one and five ice cores were collected for salinity determinations (table 1). ice cores were cut into 2.5 cm sections immediately after retrieval to minimize brine drainage. however, as noted by Reference Nakawo and SinhaNakawo and sinha (1981), there is doubt whether the measured salinities for the bottommost layer truly represent the in situ salinities because of the possibility of drainage during the removal of the ice cores. the ice sections were put into zip-lock polyethylene bags, melted at room temperature, and conductivity was measured immediately. water samples were collected in the field into 30 ml vials from the ice–water interface for later conductivity and δ18o determinations and kept in the dark at +4˚c until they were analyzed. snow depth was measured with a ruler.
Summary of samples collected for this study in 2000. Salinity was measured from every core
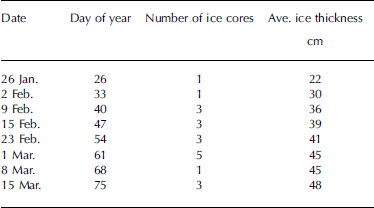
The conductivity of the water samples and melted ice samples was measured with temperature-compensated conductivity meters, namely an ati orion model 170 and a radiometer cdm210 conductivity meter, respectively. the salinity of the samples was computed using the unesco (Reference Fofonoff and MillardFofonoff and millard, 1983) algorithms. the conductivity meters were calibrated using calibration solutions with (low) conductivities comparable to those of the samples.
δ18o for water samples was measured at the dating laboratory, university of helsinki, finland, with a finnigan mat delta plus xl mass spectrometer in continuous flow mode interfaced to a gas bench ii (for details see Reference Granskog, Kaartokallio, Kuosa, Thomas, Ehn and SonninenGranskog and others, 2005). the δ18o values are expressed as % relative to the vienna standard mean ocean water (v-smow) standard. reproducibility of replicate analyses was generally better than 0.1%.
Weather data during the whole winter were obtained from the nearby finnish meteorological institute weather station. these data were used to force the thermodynamic sea-ice model developed by Reference SalorantaSaloranta (2000). in short, the model has been developed for the conditions in the northern baltic sea, and was used here to estimate the average growth rate during the formation of every 2.5 cm thick ice layer.
Statistical calculations were performed using the sas software (sas institute inc., nc, USA).
3. Results and Discussion
3.1. Weather conditions, ice-cover properties and growth rates
figure 1 shows the development of air temperature, under-ice water salinity and δ18o during winter 2000. freeze-up occurred on 19 january (day of year 19; day of year hereafter simply referred to as day), and sampling was commenced on
Development of (a) daily mean air temperature (solid line; dashed line represents 7 day moving average); (b) surface or under-ice water salinity; and (c) surface or under-ice water δ18O during the observation period. The horizontal line in (a) shows the period chosen for analysis.

Day 26. for this study we chose to use data from the day 26–75 period (table 1), excluding the top 10cm layer, because the exact time of freeze-up could not be determined (hence growth rates are not accurate). also the ice structure pointed towards somewhat different growth conditions (granular ice) for the topmost layer, and the inclusion of snow was also possible during initial ice formation exemplified by the low salinities of the surface ice layers (see below). during the chosen period the air temperature was generally below freezing (fig. 1a), and based on the under-ice water salinity and δ18o no appreciable ice melt occurred during this period that affected the under-ice water composition (fig. 1b and c). after day 80, under-ice water salinity decreased drastically, most likely due to the formation of a sub-ice meltwater layer. at the same time the δ18o values decreased somewhat, indicating an influx of snowmelt after day 80, although another possible explanation would be river discharge that is known to form under-ice plumes in the area (Reference Granskog, Kaartokallio, Kuosa, Thomas, Ehn and SonninenGranskog and others, 2005). however, a simple isotopic mass-balance calculation indicates a freshwater end-member with a δ18o value of around –15% which is lower than for river water in the area (Reference Granskog, Martma and VaikmäeGranskog and others, 2003). the mean (±std dev.) sea-water salinity, S w, during the day 26–75 period was 3.2±0.2 psu, and the mean δ18o for water was –9.5±0.2%.
figure 2 shows the evolution of ice salinity during the investigation period. salinities were generally 0.5–1.0 psu, values generally decreasing with depth. the low surface values may be attributed to initial ice formation from snow.
Development of ice salinity during the observation period. If several cores were sampled at a certain date, the average salinity profile is shown (see Table 1). Vertical dashed lines represent salinity of 0.75 psu and are given as reference.

Very few data points were available when only salinity values were used for which growth rates had been measured. therefore, modeled growth rates were included in the analysis. the growth rates were calculated for every sampled 2.5 cm layer by modeling the ice-thickness evolution, with the thermodynamic sea-ice model developed by Reference SalorantaSaloranta (2000). figure 3 compares the modeled and observed ice thicknesses, and shows that a good relationship exists between the two for the period of investigation, thus supporting the validity of the approach. the thermodynamic model shows that ice-thickness growth after day 80 was caused mainly by superimposed ice formation and not by growth at the ice/water interface.
Modeled and observed ice thicknesses. The horizontal line shows the period chosen for analysis.

3.2. The effective salt segregation coefficient
The (initial) salinity of sea ice in relation to the growth rate is often described by the following equation (see, e.g., Reference Nakawo and SinhaNakawo and sinha, 1981; Reference W.F. and AckleyWeeks and ackley, 1982; Reference Eicken and JeffriesEicken, 1998):

Where k eff is the effective (in this case the observed) solute distribution coefficient defined as the solute concentration in the solid (in our case the sea-ice bulk salinity, S i) divided by the solute concentration in the solution (in our case the seawater salinity, can be considered as the value of k eff when the growth rate, v i, is zero (e.g. Reference W.F. and AckleyWeeks and ackley, 1982). this is the theoretical equilibrium fractionation coefficient. D is the diffusion coefficient of the solute in the solution, and z bl is the diffusion-limited boundary layer thickness (for a detailed discussion see Reference Eicken and JeffriesEicken, 1998).
Rearrangement of equation (1) gives (e.g. Reference Nakawo and SinhaNakawo and sinha, 1981)

Which is a straight line on a plot of ln(1/k eff – 1) against v i with a slope of –z bl/D and a zero intercept of ln(1/k*eff –1) (e.g. Reference W.F. and AckleyWeeks and ackley, 1982). the slope and intercept have been estimated from a number of laboratory and field studies
For oceanic salinities (S > 30) (see, e.g., Reference Eicken and JeffriesEicken, 1998). often used are the values obtained from a field study by Reference Nakawo and SinhaNakawo and sinha (1981) with  and
 obtained from growth rate and stable salinity (where stable refers to the average salinity at a certain level over the investigated period). a few drawbacks exist with this approach. the model used is strictly valid only for a planar interface and here applied to a case where (at least in standard sea water) a planar interface is not stable. therefore the obtained value of k*eff includes a geometry effect of the ice/water interface. the drift of higher ln(1/k
eff–1) values in the low v
i range (see fig. 4) is related to the fact that the ice/water interface approaches conditions where the planar interface is stable (Reference W.F. and AckleyWeeks and ackley, 1982). using stable salinity furthermore complicates the issue, since the stable salinity includes not only initial entrapment but also further desalination processes acting on ice layers. however, the value of this approach lies in the possibility of comparing our observations directly with those of Reference Nakawo and SinhaNakawo and sinha (1981) made in similar conditions.
Using our stable salinity values for the investigated period and the (modeled) growth rate data, equation (2) can be solved for  and
 figure 4 shows the resulting plot from our data using the modeled growth rate and measured k
eff based on the stable salinity of ice layers (cf. Reference Nakawo and SinhaNakawo and sinha, 1981). a least-squares fit of the
Ln(1/k eff–1) against modeled growth rate, using modeled growth rate and measured stable salinity. The dashed line represents the least-squares fit of Equation (2) to the data (R 2 = 0.75, p < 0.001), giving and z bl/D = 26 600 s cm–1 (see text for details).

Data give  (mean ± standard error) and
 with R
2 = 0.75 (p < 0.001). however, these values are valid only for a finite range of v (Reference Eicken and JeffriesEicken, 1998), and should therefore not be extrapolated (Reference Nakawo and SinhaNakawo and sinha, 1981).
5 shows the relationship of growth rate and k
eff in our data, and compares our results to those obtained by Reference Nakawo and SinhaNakawo and sinha, 1981 for arctic first-year ice and those reported by Reference Cox and WeeksCox and weeks (1975, Reference Cox and Weeks1988).
Modeled growth rate against stable salinity. The thick solid line represents Equation (2) with and δ/D = 26 600 obtained from our dataset and the thin solid lines ±1 standard error. The dashed line shows the corresponding plot based on Nakawo and Sinha (1981), and the dotted line that based on the Reference Cox and WeeksCox and Weeks (1975, Reference Cox and Weeks1988) datasets.

The result for z bl/D provides a way to estimate the solute boundary layer thickness from

With D = 7.5×10⁻¹⁰m2 s–1 for nacl at –0.2˚c (roughly the freezing point for water with a salinity of 3.2 psu). D has been derived using the stokes–einstein relation as described in Reference Eicken and JeffriesEicken (1998, and personal communication, 2004).
The values of k eff are generally lower than those reported by Reference Nakawo and SinhaNakawo and sinha, 1981 and Reference Cox and WeeksCox and weeks (1975, Reference Cox and Weeks1988). therefore the model by Reference Nakawo and SinhaNakawo and sinha (1981) tends to overestimate the salinity in our case (fig. 5). the higher value obtained by Reference Cox and WeeksCox and weeks (1975) is at least partly due to the fact that their results show the true initial salt entrapment, while our and Reference Nakawo and SinhaNakawo and sinha’s (1981) results include later desalination mechanisms acting on ice layers above the skeleton layer (Reference Cox and WeeksCox and weeks, 1975), therefore lowering the obtained k eff values. however, even if we limit the analysis to the new ice layers formed every week, which would better represent the initial salinity of the ice layers (although brine loss at sampling has to be taken into account) than the stable salinity, the results are virtually identical (not shown). therefore these results are deemed representative of the salt entrapment during freezing of low-salinity baltic sea water, and the models used for, for example, antarctic sea ice (Reference EickenEicken, 1992) are not directly applicable to baltic sea ice modeling. a well-grounded question is obviously why the k eff values are lower. a detailed investigation is beyond the scope of this study, but the reasons may be linked to the low salinity of the sea water and the resulting characteristics (morphological effects) of the ice/water interface during ice growth. one indication of this is that the value of 2.0 mm derived for z bl is smaller than the value of 2.9 mm obtained from the nakawo and sinha (1981) dataset (Reference Eicken and JeffriesEicken, 1998). not only growth rates, as observed by Reference Cox and WeeksCox and weeks (1975), but also changes in reservoir salinity result in changes in the morphology of the ice/water interface, the latter being especially pertinent here. it is unclear for how wide a range of salinities our results are applicable, and further experiments at a range of sea-water salinities should be conducted.
4. Conclusions
Using a time-series dataset of low-salinity baltic sea ice salinity profiles and modeled growth rates using a one-dimensional thermodynamic sea-ice model, we have determined the effective salt segregation coefficient k eff as a function of ice growth rate v i. the estimate for the effective salt segregation coefficient is

For 0:2 × 10⁻⁴ < V i < 4:5 × 10⁻⁴ mms–1. this relation is valid for a finite range of growth rates, and most likely also for a finite range of salinities. one should, however, be aware of possible shortcomings, especially those arising from collection of the ice cores, especially for brine loss from the bottommost ice layers. the obtained relationship is pertinent for the future development of a numerical sea-ice model incorporating salinity for baltic sea conditions. future work should, however, look into initial salt segregation, ice/water interface morphological effects, and the resulting salt segregation at the range of salinities characteristic for the baltic sea. also desalination processes of baltic sea ice after initial ice formation deserve attention: because of the mild climate conditions the sea-ice salinities fluctuate significantly (Reference Granskog, Leppäranta, Kawamura, Ehn and ShirasawaGranskog and others, 2004b). therefore a representative model requires a good description of both effective salt entrapment (as described here) and later desalination processes, especially flushing.
Acknowledgements
K. kanto assisted in the field. bothnian bay research station provided facilities and aid in fieldwork. h. eicken helped with salt diffusivity. the comments of d. notz and j.-l. tison, as well as the editorial aid of the scientific editor, h. eicken, aided in improving the manuscript. funding was provided through the academy of finland and the walter and andrée de nottbeck foundation.



