I. INTRODUCTION
The high temperature stability of Si–B–C–N polymer-derived ceramics (PDCs) against the crystallization of the amorphous matrix and the chemical degradationReference Su, Remsen, Zank and Sneddon1–Reference Riedel, Kienzle, Dressler, Ruwisch, Bill and Aldinger4 has drawn considerable attention for the structural investigations of these materials since the middle of the 1990s (e.g., see Refs. Reference Schuhmacher, Berger, Weinmann, Bill, Aldinger and Müller5–Reference Bernard, Weinmann, Gerstel, Miele and Aldinger9).
The composition of amorphous Si–B–C–N PDCs after thermolysis is generally located within the limits of the four-phase region SiC–Si3N4–BN–C of the quaternary Si–B–C–N system.Reference Seifert, Peng, Golczewski and Aldinger10 Phase separations within the microstructure of these amorphous ceramics have been resolved based on the structural investigations by NMR measurementsReference Schuhmacher, Berger, Weinmann, Bill, Aldinger and Müller5, Reference Haug, Lamparter, Weinmann and Aldinger11 and wide-angle neutron- and x-ray scattering studies.Reference Berger, Müller, Aldinger and Müller12 Accordingly, particular structural features common for the as-thermolyzed materials are Si–C–N domains related with regions of amorphous domains composed of stacked layers containing carbon, boron, and nitrogen (turbostratic B–N–C domains). Further annealing of the as-thermolyzed Si–B–C–N PDCs at temperatures T ≥ 1300 °C leads to the formation of SiC nanocrystallites, as the primary crystalline phase, within the amorphous microstructure.Reference Janakiraman, Weinmann, Schuhmacher, Müller, Bill and Aldinger7, Reference Müller, Zern, Gerstel, Bill and Aldinger13, Reference Müller, Gerstel, Weinmann, Bill and Aldinger14 Si3N4 nanocrystallites emerge at significantly higher temperatures, depending on the boron content. In this connection, it was shown that the increase of boron up to ~8 to 9 at.% retards the crystallization of Si3N4,Reference Müller, Gerstel, Weinmann, Bill and Aldinger14, Reference Müller, Gerstel, Weinmann, Bill and Aldinger15 whereas the crystallization of SiC is promoted with addition of the boron content.Reference Golczewski and Aldinger16
A number of attempts were recently made to model the crystallization behavior of Si–B–C–N PDCs and to explain the impact of boron on the crystallization behavior. The thermodynamic model including the Gibbs free energies of amorphous Si–C–N domains and the completely crystallized state cannot satisfactorily describe the crystallization behavior; however, it proves that the addition of boron increases the driving energy for the crystallization process.Reference Golczewski and Aldinger16, Reference Tavakoli, Gerstel, Golczewski and Bill17 Using the model of metastable phase equilibria comprising the Gibbs free energies of amorphous Si–C–N domains and nanocrystalline phases,Reference Golczewski18, Reference Golczewski19 the crystallization process was described showing a satisfactory accordance with the experimental investigations performed on Si–B–C–N PDCs.Reference Tavakoli, Gerstel, Golczewski and Bill20 Moreover, this model can also describe the promoting role of boron in the SiC crystallization. Nevertheless, modeling of the metastable phase equilibria does not explain the hindering role of boron in the Si3N4 crystallization. Indeed, getting more insight regarding the effect of boron on the energetics of the Si3N4 crystallization in Si–B–C–N PDCs seems hard to achieve at present because of the limited detail information on crystallization of these materials.
In the present work, the crystallization kinetics of Si3N4 has been investigated for two ceramics with a similar Si/C/N atomic ratio and variable boron contents of 3.7 and 6.0 at.% with the aim to get a better understanding of the retarding role of boron in the Si3N4 crystallization. For this purpose, the volume fraction of the crystallized Si3N4 during isothermal annealing has been quantitatively evaluated using XRD measurements and subsequently analyzed using the classical kinetic theory for the description of isothermal phase transformations. The results obtained together with the data recently reported concerning the crystallization kinetics of Si3N4 for the ceramic including 8.3 at.% BReference Tavakoli, Gerstel, Golczewski and Bill21 allow clarification of the boron impact on the activation energy of the crystallization and to determine the nucleation and growth-dominant mechanisms controlling the crystallization course.
II. EXPERIMENTAL PROCEDURES
A. General remarks
The ceramics with chemical compositions of SiC1.5N0.9B0.15 and SiC1.5N0.9B0.24 including 3.7 and 6.0 at.% B, respectively, were obtained by direct thermolysis of two boron-containing precursors synthesized via hydroboration of poly(methylvinylsilazane) with variable [–H3CSi(Vi)NH–]/H3B.S(CH3)2 molar ratio of 8:1, 4:1, (Vi: –CH=CH2) as described in detail elsewhere.Reference Müller, Gerstel, Weinmann, Bill and Aldinger14 The thermolysis process was carried out at 1100 °C in quartz Schlenk tubes in a flowing argon atmosphere (heating rate 25–1100 °C: 1 °C/min followed by a dwell time of 4 h). The as-obtained large ceramic particles in a size between 1 and 3 mm were isothermally heat treated at various temperatures ranging between 1550 and 1775 °C for different time periods ranging from 1 to 525 h (heating rate: 25 °C/min; cooling rate T ≥ 1200 °C: −120 °C/min, T < 1200 °C: −25 °C/min). Annealing of the samples was carried out in a graphite furnace using graphite crucibles under nitrogen atmosphere (105 Pa).
Chemical analysis of nitrogen was performed using the equipment ELTRA ONH-2000 based on the combustion technique.
B. X-ray diffraction analysis
X-ray diffraction (XRD) measurements were carried out with a Philips unit using Cu Kα1 radiation (40 kV/40 mA) equipped with X’Pert accelerator (position-sensitive Si-strip detector) to do quantitative analysis of the as-obtained diffraction patterns. Therefore, the following conditions were considered in terms of the sample preparation and the measurement parameters as well. As-annealed particles were milled to reach fine powders with the average size of 1 to 2 μm. Then, 10 mg of the as-milled powders were dispersed in toluene using ultrasonication. Subsequently, a thick layer of powders with diameter of 15 mm and thickness of ~30 μm was formed on surface of a single crystalline silicon wafer by sedimentation. To observe a better precision during XRD measurement, the step size of ~0.01° and the counting time of 600 s/step were applied. Further investigations concerning the quantitative evaluation of the XRD data were performed using the ProFit software.Reference Sonneveld and Delhez22
III. RESULTS
A. Course of crystallization
1. Growing amount of crystalline Si3N4
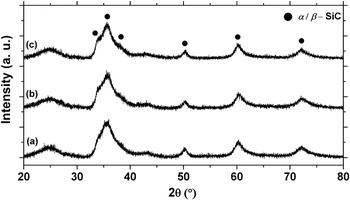
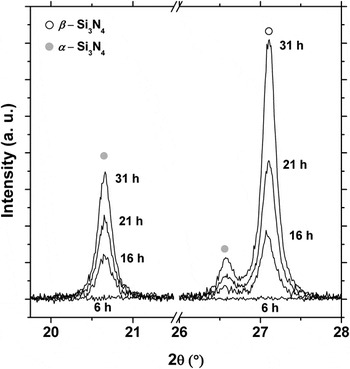
To investigate the crystallization of Si3N4 in the Si–B–C–N PDCs, the high-temperature stability of the ceramics should be taken into account. The corresponding results of the high-temperature thermal gravimetric analysis (HT-TGA) reported in the literatureReference Tavakoli, Gerstel, Golczewski and Bill17 prove the chemical stability of SiC1.5N0.9B0.15 and SiC1.5N0.9B0.24 at temperatures T ≤ 1700 and T ≤ 1800 °C, respectively. Therefore, two sets of temperatures were designated for the isothermal heat treatment of the samples: (i) T =1550, 1625, and 1700 °C for the ceramic with 3.0 at.% B, (ii) T = 1625, 1700, and 1775 °C for the ceramic with 6.0 at.% B. Figures 1(a)–1(c) exhibit the XRD patterns of the ceramic samples containing 3.7, 6.0, and 8.3 at.% B, respectively, which have been isothermally annealed at T = 1700 °C prior to the initiation of the Si3N4 crystallites formation. It should be noted that the crystallization behavior and the crystallization kinetics of Si3N4 in SiC1.6N1.0B036 including 8.3 at.% B was recently investigated in detail.Reference Tavakoli, Gerstel, Golczewski and Bill21 As shown in Fig. 1, the broad peaks in XRD patterns correspond to SiC nanocrystallites that form within the amorphous microstructure of the ceramics during the annealing period. Moreover, the time lag for the start of the Si3N4 crystallization course increases from ~2 to ~15 h with increasing the boron content from 3.7 to 8.3 at.%. As expected, the increase of annealing time leads to the initiation and progress of the Si3N4 crystallization. For instance, Fig. 2 exhibits the intensity of the characteristic α- and β-Si3N4 XRD peaks located at 2θ = 20.58 and 27.06°, respectively, growing with time at T = 1700 °C in the ceramic including 6.3 at.% B.
XRD patterns of the Si–B–C–N ceramics including (a) 3.7 at.% B, (b) 6.0 at.% B, and (c) 8.3 at.% BReference Tavakoli, Gerstel, Golczewski and Bill21 prior to the crystallization of Si3N4 after isothermal heat treatment at T = 1700 °C for 2, 6, and 15 h, respectively.

Exemplary XRD peaks corresponding to the diffraction lines of α- and β-Si3N4 dependent on the annealing time of amorphous SiC1.5N0.9B0.24 at constant temperature of T = 1700 °C.

The integrated intensity of the diffracted x-ray beam from a (hkl) lattice plane corresponds with the number of the (hkl) plane within a crystalline state. Moreover, the number of the (hkl) plane correlates with the corresponding crystallized volume fraction within an amorphous matrix. Thus, for quantitative analysis of crystallization in this study, the crystallized volume for two modifications of Si3N4 (α,β) was assumed proportional to the integrated intensity Ii(t) (i = α,β) of a single XRD peak at temperature T. Accordingly, the normalized volume fraction of the crystalline phase  has been evaluated where
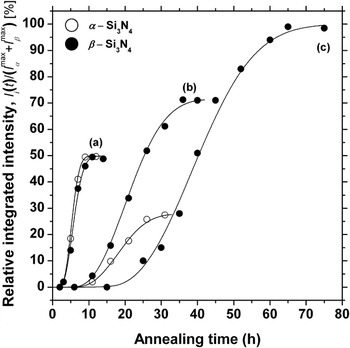
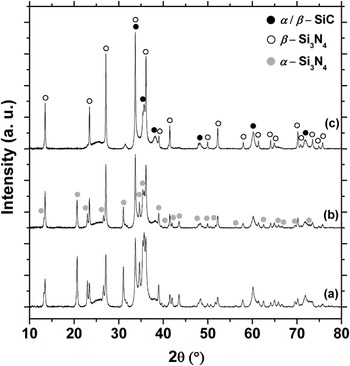
 is the corresponding value for the complete crystallization of the Si3N4. In this connection, two peaks corresponding to α and β modifications of Si3N4, respectively, located at 2θ = 20.58 and 27.06° (shown in Fig. 2), were selected for quantitative analysis of the growing fraction of the phase Si3N4. To calculate the integrated intensity of the investigated peaks Ii(t) (i = α,β), the pseudo-Voigt function was fitted to the measured XRD data and subsequently the values Xi (i = α,β) were calculated as the volume fraction of the crystalline α- and β-Si3N4 at time t. The results obtained at T = 1700 °C are presented in Fig. 3 where the estimated volume fraction of the crystalline α- and β-Si3N4 are plotted as a function of time. For the ceramic including 3.7 at.% B, the complete α- and β-Si3N4 crystallization are estimated to last 9 and 11 h, respectively. The corresponding XRD pattern is indicated in Fig. 4(a). With increasing the boron content to 6.0 at.%, the time required for the complete α- and β-Si3N4 crystallization increases to ~31 and 36 h, respectively [see Fig. 3(b)]. Moreover, the XRD pattern shown in Fig. 4(b) signifies the reduced ratio of α-Si3N4/β-Si3N4 compared with the XRD pattern of the completely crystallized ceramic containing 3.7 at.% B [Fig. 4(a)]. As exhibited in Fig. 4(c), Si3N4 nanocrystallites only form in the β modification in the case of the ceramic including 8.3 at.% B. In addition, the complete crystallization course in SiC1.6N1.0B036 lasts much longer compared with SiC1.5N0.9B0.15 and SiC1.5N0.9B0.24 (see Fig. 3). To obtain a certainty about the thermal stability of the ceramic samples in the time period of isothermal heat treatment at T = 1700 °C, the chemical analysis was carried out for the fully crystallized samples. The obtained results are given in Table I. As observed, the average values of nitrogen (wt%) measured for the heat treated samples are comparable with the corresponding values measured for the as-thermolyzed samples. This finding proves the chemical stability of the ceramic samples during the Si3N4 crystallization process.
Relative integrated intensity of the characteristic XRD peaks corresponding to α (○) and β (●) modifications of Si3N4 growing with increasing the annealing time at the constant temperature of T = 1700 °C in the Si–B–C–N ceramics with various boron content: (a) 3.7 at.%, (b) 6.0 at. %, and (c) 8.3 at.%.Reference Tavakoli, Gerstel, Golczewski and Bill21 Solid lines correspond to fit of the data by Eq. (2).

XRD patterns of the Si–B–C–N ceramics including (a) 3.7 at.% B, (b) 6.0 at.% B, and (c) 8.3 at.% BReference Tavakoli, Gerstel, Golczewski and Bill21 after the complete crystallization of Si3N4 at constant annealing temperature of T = 1700 °C. The annealing time of the corresponding ceramics is 11, 36, and 65 h, respectively.

Elemental analysis of nitrogen in the Si–B–C–N ceramics with various thermal histories.

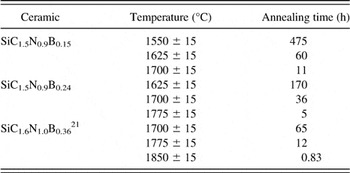
The isothermal crystallization course of Si3N4 at T = 1700 °C was described previously in detail. The growing amount of crystalline Si3N4 was also studied at other temperatures. The corresponding results are summarized in Table II where the times required for the complete Si3N4 crystallization are estimated at various temperatures. The results for SiC1.6N1.0B0.36Reference Tavakoli, Gerstel, Golczewski and Bill21 are also included.
The annealing times estimated at various temperatures for the complete crystallization of Si3N4 in the Si–B–C–N PDCs.

2. Crystallite size analysis
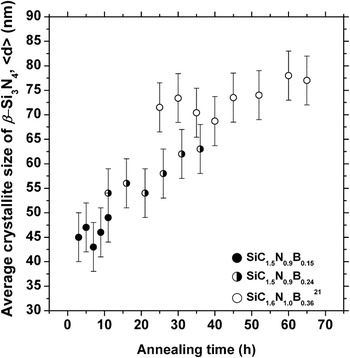
To analyze the time dependence of the Si3N4 crystallite dimensions as well as the influence of boron on the crystallite size, the average dimensions of β-Si3N4 crystallites 〈d〉 in the time period of crystallization at constant temperature T = 1700 °C were studied. For this purpose, the XRD data were applied to investigate the values of 〈d〉 using the Scherrer formulaReference Scherrer23

where λ = 0.1540 nm is the wavelength of the applied Cu Kα1 radiation, B is the full width at half-maximum (FWHM) of the corresponding peak, and θ is Bragg angle at the position of peak. The same peak as selected for the analysis of the β-Si3N4 phase volume fraction (2θ = 27.06°) was also used for the calculation of the crystallite dimensions. FWHM of the diffraction line was calculated with fit of the XRD data by the pseudo-Voigt function. The instrumental peak broadening was subtracted from the calculated data estimated using LaB6 as a standard sample. The obtained results are shown in Fig. 5 where the average crystallite size of β-Si3N4, which forms at T = 1700 °C in the Si–B–C–N ceramics including various boron contents, is plotted versus the time. Accordingly, the average crystallite dimensions were calculated to be 〈d〉 ≈ 43 to 49 nm for SiC1.5N0.9B0.15 and 〈d〉 ≈ 54 to 63 nm for SiC1.5N0.9B0.24. In addition, the values of the β-Si3N4 average crystallite size 〈d〉 ≈ 69 to 78 nm obtained for SiC1.6N1.0B0.36 at the same annealing temperature have also been presented in Fig. 5. These results reveal that the values of 〈d〉 do not remarkably increase within the crystallization period at constant temperature, whereas a significant increase of 〈d〉 with increasing boron content is observed. It is worth noting that the evaluation of the single diffraction peaks by XRD single-line analysis methodReference Delhez, de Keiser and Mittemeijer24 yielded a negligible contribution of microstrain to profile broadening and also justifies using the Scherrer formula for the crystallite size analysis.
Average crystallite size of β-Si3N4 forming within the Si–B–C–N ceramics with various boron content during the isothermal crystallization course at T = 1700 °C.

B. Kinetic analysis of crystallization
The nucleation and growth kinetics of Si3N4 in SiC1.5N0.9B0.15 and SiC1.5N0.9B0.24 were investigated using the classical kinetic theory developed by Johnson, Mehl, Avrami, and Kolmogorov (JMAK theory).Reference Avrami25–Reference Kolmogorov29 Accordingly, the volume fraction of crystalline Si3N4, Xi (i = α,β) as a function of time t is expressed as

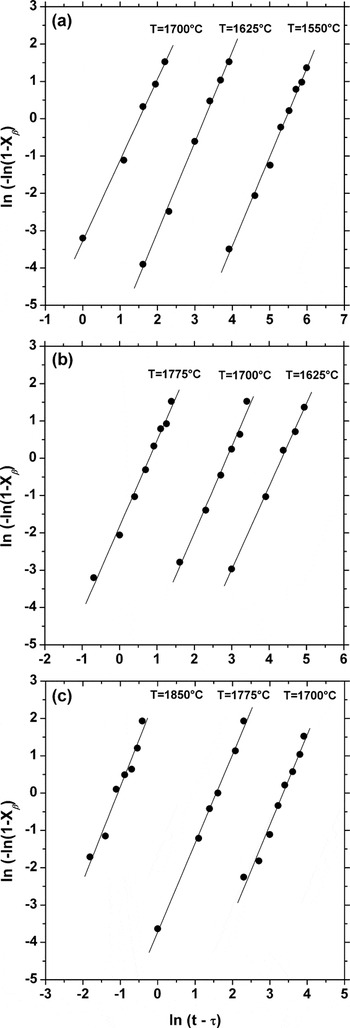
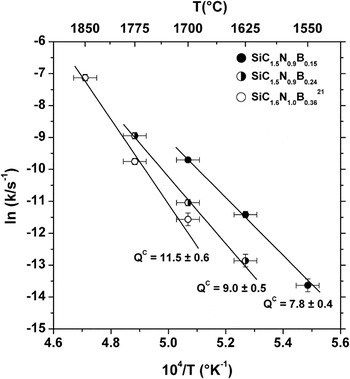
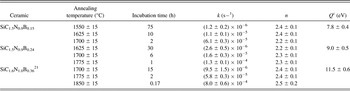
where t is the isothermal annealing time, τ is the incubation time required for the initiation of the Si3N4 crystallization, k is a temperature-dependent effective rate constant of the crystallization process comprising both nucleation and growth of the crystallites, and n is the JMAK exponent, which effectively depends on the type of crystallite nucleation (site saturation or continuous), dimensionality of growth, and growth-controlling mechanism. Also, the term t − τ in Eq. (2) represents an effective time of the crystallization process. Fitting Eq. (2) to the obtained data corresponding to the growing fraction of crystallized Si3N4 at the temperature T = 1700 °C (see Fig. 3) gives the sigmoid curves plotted in Fig. 3. The kinetic analysis for the ceramic including 3.7 at.% B yields the values of JMAK exponent n = 2.4 ± 0.1 for α-Si3N4 and n = 2.2 ± 0.1 for β-Si3N4. Additionally, the rate constants of k α = (7.2 ± 0.4) × 10−5 s−1 and kβ = (6.1 ± 0.3) × 10−5 s−1 were determined for the formation course of crystalline phases α- and β-Si3N4, respectively. For the ceramic with 6.0 at.% B, the values n = 2.5 ± 0.1 and n = 2.3 ± 0.1 were obtained for the α and β modifications, respectively. Moreover, the rate constants of k α = (1.9 ± 0.5) × 10−5 s−1 and k β = (1.6 ± 0.3) × 10−5 s−1 were achieved. Considering the kinetic data presented previously, crystallization of the phases α- and β-Si3N4 proceed simultaneously and can be described with nearly the same kinetic parameters. Hence, further kinetic analysis is restricted to the crystallization behavior of β-Si3N4. For this reason, a linear formula derived from Eq. (2) has been used. Accordingly, the term ln{−ln[1 − X β(t)]} plotted versus ln(t − τ) at different annealing temperatures for the ceramics including various boron contents have been fitted yielding the straight lines as shown in Fig. 6. The parameters (k and n) derived from the kinetic investigation are given in Table III. For SiC1.5N0.9B0.15, the same values of JMAK exponent n = 2.4 ± 0.1 were obtained in the case of isothermal heat treatment at T = 1550 and 1625 °C. For SiC1.5N0.9B0.24, n = 2.2 ± 0.1 and 2.3 ± 0.1 were determined for annealing at T = 1625 and 1775 °C, respectively. Furthermore, the recently reported kinetic analysis for SiC1.6N1.0B0.36 gives almost the same values (n = 2.4 ± 0.1, n = 2.4 ± 0.1, and n = 2.5 ± 0.2 derived at T = 1700, 1775, and 1850 °C, respectively).Reference Tavakoli, Gerstel, Golczewski and Bill21 For further analysis, the natural logarithms ln k of the rate constants k obtained for the β-Si3N4 crystallization are plotted versus the reciprocal temperature, 1/T, in Fig. 7. These data revealing apparent linear relation can be analyzed by an Arrhenius equation:

Plot of the term ln{−ln[1 − X β(t)]} versus ln (t − τ) based on the linear formula derived from Eq. (2) at various temperatures for (a) SiC1.5N0.9B0.15, (b) SiC1.5N0.9B0.24, and (c) SiC1.6N1.0B0.36.Reference Tavakoli, Gerstel, Golczewski and Bill21 Solid straight lines correspond to the linear fit of the data.

Plot of the term ln(k) versus reversible temperature for the Si–B–C–N ceramics including nearly the same Si/C/N ratio and variable boron content. Solid straight lines are associated with fit of the data by Eq. (3).

Rate constants k, JMAK exponents n, and effective activation energies Q c of β-Si3N4 crystallization within the Si–B–C−N ceramics including nearly the same Si/C/N ratio and variable boron content. The obtained values were derived from the kinetic analysis of the experimental data using Eqs. (2) and (3).

where k 0 is a pre-exponential factor, Q c is an effective activation energy of crystallization, and R is the gas constant. As illustrated in Fig. 7, the data are satisfactory described by Eq. (3). The obtained values of activation energies are Q c = 7.8 ± 0.4, 9.0 ± 0.5, and 11.5 ± 0.6 eV corresponding to the ceramics including 3.7, 6.0, and 8.3 at.% B, respectively.
IV. DISCUSSION
The kinetic analysis of β-Si3N4 crystallization for three ceramics with compositions of SiC1.5N0.9B0.15, SiC1.5N0.9B0.24, and SiC1.6N1.0B0.36 was presented in Sec. III. B. As a result, the average values for the JMAK exponent n ≈ 2.3, 2.3, and 2.4 corresponding to the ceramics with 3.7, 6.0, and 8.3 at.% B, respectively, were estimated. These nearly equal values of n imply that the controlling mechanisms of the Si3N4 crystallization are not essentially influenced by the amount of boron. Using the formal theory of transformation kinetics,Reference Christian30 the value n = 2.5 suggests mechanism of continuous nucleation followed by a three-dimensional growth of the crystallites controlled by the volume diffusion of the constituent elements. Despite the crystallization mechanisms that appear to be independent of the boron content, really different energy barriers for the Si3N4 crystallization have been estimated for the ceramics investigated. As displayed in Fig. 7, the fitted values of Q c increases from 7.8 to 11.5 eV with the increase of the boron content from 3.7 to 8.3 at.%. The obtained results allow determination of the individual activation energies corresponding to the nucleation and growth processes using the recent developments on the analysis of solid-state phase transformations.Reference Kempen, Sommer and Mittemeijer31 Accordingly, the effective activation energy of crystallization Q c can be defined as

where d is the dimensionality of growth (1, 2, 3), m is the growth mode parameter (m = 1: interface-controlled growth; m = 2: diffusion-controlled growth), Q N and Q G are the activation energies for processes of nucleation and growth, respectively. For the particular case of continuous nucleation and a three-dimensional diffusion-controlled growth (n = 2.5, d = 3, and m = 2) as deduced previously, Eq. (4) can be written as:

where Q D is the activation energy of diffusion. In recent years, the extensive studies on the self-diffusion of Si, C, and N in similar amorphous Si–B–C–N ceramics including ~9.0 at.% B were carried out with the stable isotopes using ion mass spectroscopy. The obtained results revealed that the activation energies of diffusion Q D for all the investigated elements are within the range 5.5 to 7.2 eV.Reference Schmidt, Borchardt, Weber, Scherrer, Baurmann, Müller and Bill32–Reference Schmidt, Borchardt, Kaïtasov and Lesage35 Additionally, the measurements of the self-diffusion of Si in amorphous Si–C–N PDCs yield the value of Q D = 5.7 eV.Reference Schmidt, Borchardt, Weber, Scherrer, Baumann, Müller and Bill36 These results demonstrate that the addition of boron does not generate any noticeable change in the activation energy of the Si diffusion within Si–C–N domains separated in Si–B–C–N ceramics. Hence, the activation energy of the N diffusion during the growth of Si3N4 crystallites can also be supposed as independent of the boron content. Consequently, to estimate the activation energies of nucleation using Eq. (5), a common average value Q D ≈ 6.3 eV has been assumed for the activation energy of volume diffusion of the constituent elements in Si–C–N domains. Taking the values Q c ≈ 7.8, 9.0, and 11.5 eV as obtained for the ceramics containing 3.7, 6.0, and 8.3 at.% B, respectively, the corresponding values for the activation energy of nucleation Q N were calculated to be ~10.6, 13.3, and 19.3 eV. The estimated values Q N ≫ Q G signify that the nucleation process is a main factor determining crystallization kinetics of Si3N4 in the Si–B–C–N ceramics. Moreover, the strong dependence of Q N on the boron content indicates also the influence of boron on the nucleation kinetics of Si3N4 and consequently can be used to explain the observed impact on the Si3N4 crystallization.
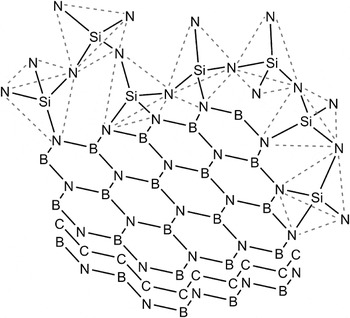
A simple way to explain the apparent role of boron in the nucleation kinetics of Si3N4 seems to consider an impact of boron on the structural transformations of the amorphous matrix as caused by interaction with components of the Si–C–N domains. Since the results of the extended structural investigations performed by means of NMR and wide-angle x-ray/neutron scattering have not indicated so far the existence of boron within the amorphous Si–C–N domains,Reference Schuhmacher, Berger, Weinmann, Bill, Aldinger and Müller5, Reference Haug, Lamparter, Weinmann and Aldinger11, Reference Berger, Müller, Aldinger and Müller12 the interdomain interfaces between B–N–C domains, emerging in form of turbostratic BNCx layers, and Si–C–N domains can be regarded as the only origin of the interaction postulated. This interaction should be presumably associated with existence of the Si–N–B bonds at the interface between turbostratic BNCx layers and SiN4 tetrahedra as schematically illustrated in Fig. 8. Hence, the cleavage of Si–N–B bonds between B- and Si-containing structures would be necessary for the nucleation of Si3N4 crystallites. As a result, the energy required for the cleavage of these bonds plays a role for the actual activation energy of nucleation. On the other hand, the increase of the boron content at a constant Si/C/N atomic ratio in the ceramics investigated leads to the growing fraction of B–N–C domains within the ceramics microstructure,Reference Golczewski and Aldinger37 which means the increased interface area between B- and Si-containing domains and the growing fraction of Si–N–B bonds at the interdomain area as well. Therefore, for the formation of Si3N4 crystallites, a larger number of Si–N–B bonds should be cleaved for the ceramic including 8.3 at.% B compared with the ceramic including 3.7 at.% B. In other words, the increased value of Q N for the formation of Si3N4 crystallites with increasing the boron content as estimated in this work can be explained as a result of the growing value of the energy required for the cleavage of the Si–N–B bonds developing at the interdomain interfaces with the increase of boron in the ceramic.
Schematic illustration exhibiting the Si–N–B bonds that presumably form at the interdomain interface between BNCx turbostratic layers (B–N–C domains) and Si-containing domains (SiN4 tetrahedras) within the amorphous matrix of Si–B–C–N PDCs.

The results reported in Sec. III. A. 2 reveal the increase of the Si3N4 average crystallite size with increasing the boron content despite the inconsiderable change of the average crystallite diameters in the time period of the isothermal crystallization (see Fig. 5). The nearly constant crystallite size during the progress of the crystallization process has been interpreted as a consequence of the continuous Si3N4 nucleus formation followed by a rapid growth of as-nucleated crystallites.Reference Tavakoli, Gerstel, Golczewski and Bill21 This conclusion also justifies the nucleation mechanism as deduced above based on the JMAK exponent values n ≈ 2.5 obtained from the kinetic analysis of the crystallization process. The increased crystallite dimensions of Si3N4 with addition of boron at the constant temperature in the Si–B–C–N PDCs reflects the decreased average number of the Si3N4 nuclei per unit volume N(T,t) with increasing the boron content. According to the classical theory of nucleation in condensed materials [30,38], N(T,t) which continuously increases during the crystallization course, is significantly affected by the term  where ΔG * is the free activation energy of the formation of a supercritical nuclei, and R is the gas constant. Hence, the decreased value of N with addition of the boron content at constant temperature as deduces before can be regarded as a consequence of the increased value of Q N as resulted in this work (Fig. 7). Moreover, the increased value of ΔG * with increasing the boron content could also result in the decreased value of N. Since the value of ΔG * is determined using two thermodynamic parameters (driving energy for nucleation, Δμ, and crystalline/amorphous interface energy, γ), the decreased value of N can also be supposed as connected with the influence of boron on the thermodynamics of the Si3N4 nucleation.
V. SUMMARY AND CONCLUSIONS
In this work, the isothermal crystallization of Si3N4 for two Si–B–C–N polymer-derived ceramics with nearly the same Si/C/N atomic ratio and various boron content (3.7 and 6.0 at.%) was investigated. Subsequently, the formation kinetics of Si3N4 crystallites was analyzed using JMAK approach. The main aim of this attempt was to clarify the kinetic impact of boron on the crystallization course. Therefore, the data concerning the crystallization kinetics of Si3N4 in a Si–B–C–N ceramic with 8.3 at.% BReference Tavakoli, Gerstel, Golczewski and Bill21 was also considered for the final analysis. The findings of this study can be summarized:
(1) For the ceramic including 3.7 at.% B, the complete crystallization lasts for ~475, 60, and 11 h at temperatures of 1550, 1625, and 1700 °C, respectively. The corresponding crystallization times for the ceramic comprising 6.0 at.% B are estimated as ~170, 36, and 5 h at temperatures of 1625, 1700, and 1775 °C, respectively.
(2) The average crystallite size of Si3N4 does not significantly change during the crystallization course. However, the results of investigations at the constant annealing temperature of 1700 °C show that the increase of the boron content from 3.7 to 6.0 and 8.3 at.% leads to a considerable increase of the average nanocrystallite size from 43–49 to 54–63 and 69–78 nm, respectively.
(3) The crystallization process for α and β modifications of Si3N4 follows almost the same kinetic behavior.
(4) The kinetic analysis of the β-Si3N4 crystallization results in the JMAK exponent values n ≈ 2.3, 2.3, and 2.4 for to the ceramics with 3.7, 6.0, and 8.3 at.% B, respectively. Moreover, the corresponding values for the effective activation energy of the crystallization Q c were obtained to be ~7.8, 9.0, and 11.5 eV, respectively.
Continuous nucleation and a three-dimensional diffusion-controlled growth were concluded as the mechanisms of the crystallization process. Since the values n obtained were nearly the same for the ceramics investigated, these mechanisms seem to be independent of the boron content. The values of the activation energy for the Si3N4 nucleation Q N were estimated much larger than those for the growth Q G. This conclusion indicates the crucial role of the nucleation kinetics in the progress of the Si3N4 crystallization. Furthermore, the significant increase of Q N with increasing the boron content was also demonstrated. This effect was attributed to the increased number of Si–N–B bonds, which presumably form at the interdomain interfaces between B- and Si-containing domains, with further addition of boron. The insignificant change in the crystallite dimensions during the process of crystallization signifies the continuous nucleation of Si3N4 nanocrystallites in accordance with the interpretation of the kinetic parameters obtained. The dependence of the Si3N4 crystallite size on the boron content can either be considered as a consequence of the boron influence on the crystallites nucleation kinetics or can be suggested as a possible thermodynamic effect of boron on the Si3N4 nucleation.
ACKNOWLEDGMENTS
The authors would like to thank M. Dudek for XRD measurements and R. Mager for technical support. Comments of Dr. Udo Welzel for evaluation of the x-ray diffraction patterns are greatly appreciated. Financial support by the European Community’s Sixth Framework Program through a Marie Curie Research Training Network and International Max Planck Research School for Advanced Materials is highly acknowledged.