1 Introduction
The funding of long-term care continues to be the subject of debate in England as in many countries with ageing populations (Colombo et al., Reference Colombo, Llena-Nozai, Mercier and Frits2011). The long-term care system in England, has been characterised as a ‘safety-net’ (Fernández et al., Reference Fernández, Forder, Truckeschitz, Rokosova and McDaid2009) or ‘residual’ (Brodsky et al., Reference Brodsky, Habib, Hirschfeld, Siegel and Rockoff2003) care system, supporting only those with very severe needs who, on the basis of a strict income and assets test, are judged unable to meet the costs of their care. There has been consensus on the need to reform the system for some time but less agreement on the detailed workings of any new system.
In 2006–2007, there were around 325 thousand people aged 65 and over living in care homes in England (Comas-Herrera et al., Reference Comas-Herrera, Wittenberg and Pickard2010). The National Health Service (NHS) pays care home fees in full for an estimated 29 thousand of them who are assessed as having a need that is primarily for health care. Others must apply to a Local Authority (LA) and undergo a means test, as well as a needs assessment, to obtain any contribution from an LA towards the costs of living in a care home. About a third of those not eligible for NHS fully funded care are estimated to have resources that disqualify them from LA support. They are known as ‘self-funders’. The other two-thirds receive a contribution to the costs of their care from their LA (Comas-Herrera et al., Reference Comas-Herrera, Wittenberg and Pickard2010).
In April 2010, 93% of care homes in England were in the independent sector (Care Quality Commission, 2010). LAs purchase care home places from these providers on behalf of residents to whom they provide financial support. In 2005, the Office of Fair Trading (OFT) noted:
…people have told us that the fees paid by Authorities to care homes for older people do not cover the full costs to the care home of providing care, plus a reasonable profit margin.(OFT, 2005, paragraph 1.50)
The report identified possible consequences of this as being that care homes may be forced out of the market leading to a shortfall in capacity and/or that care homes may charge higher fees to self-funders who thus cross-subsidise publicly funded residents. In a 2000–2001 study of care home closures, 72% of responding inspection unit managers cited LA pricing policies as a factor in home closures (Netten et al., Reference Netten, Williams and Darton2005). More recent evidence indicates that the fee differential persists:
Self-pay fees are still typically £50–£100 higher than local authority fees on a similar service and similar amenity basis, though premiums may be lower in areas of acute capacity shortage where local authorities have been forced to match self pay rates.(Laing and Buisson, 2011: 203)
A recent report for the OFT concluded that
The residential care homes market is a ‘buyers’ market … but [Local Authorities] appear to lack a full understanding of the impact of their decisions on the market, with a short term focus on price … .(PricewaterhouseCoopers, 2011: 29)
A major private sector provider of care homes has recently collapsed following financial difficulties and has referred to “downward pressure of average weekly fee being paid by Local Authorities” as one contributory factor (Southern Cross, 2011: 3). A survey of 238 social care providers carried out by Community Care magazine at the beginning of 2011 revealed that two-thirds of responding providers had had their fees cut (Community Care, 16 February 2011). The same source also reports that a number of councils are facing legal challenges to their fee reductions, amid concerns that councils are abusing their position as the biggest purchasers in their local area. At least one council has been forced to raise their fees by a judicial review.
Most proposed reforms to the long-term care funding system would result in more care home residents being eligible for some financial help from the state (see Comas-Herrera et al. (2011) for a summary of proposals). Recently, the independent Commission on Funding of Care and Support (CFCS) also recommended a reform which would increase the proportion of residents receiving LA funding (CFCS, 2011). Under all of these proposals, LAs could therefore have more bargaining power in negotiating fees but there would be fewer – and under some proposals no – self-funders to cross-subsidise publicly funded residents. The fee levels negotiated by LAs could affect the public cost of the reforms, the revenue, and hence profitability and supply, of care homes and the fees that any remaining self-funders face. Yet there has been little discussion of this issue in analysis of proposed reforms. Hancock and Hviid (Reference Hancock and Hviid2010) demonstrate that under the current means test there are enough self-funders for care homes to be able to recoup any losses on LA-funded residents via higher fees for self-funders, but that reforms to the means test could change this. At a time of tight budgets, LAs may respond to any reform which requires them to meet a greater share of the costs of residential care, by seeking larger fee discounts, exacerbating the concerns identified by the OFT. The issue is relevant beyond the United Kingdom. In the United States, the difference in fees paid by residents supported through the means-tested Medicaid and by private payers or those supported via the insurance-based Medicare programme has attracted attention (Ettner, Reference Ettner1993; Cohen and Spector, Reference Cohen and Spector1996; Harrington Meyer, Reference Harrington Meyer2001; Troyer, Reference Troyer2002; Grabowski, Reference Grabowski2007; Millers et al., Reference Millers, Mor, Grabowski and Gozalo2009).
The aim of this paper is to assess how alternative assumptions on the care home fees paid by LA-supported and other care home residents change the projected effects of possible reforms to the means tests. It is not our purpose to argue that LAs should pay higher fees or that care homes should not cross-subsidise from self-funders to LA-supported residents. We argue, however, that under reforms which increase the proportion of residents who receive LA funding, an assumption that there would be no change in the fees paid by LAs or by any remaining self-funders is only one of several possible assumptions that could be made in preparing projections of the effects of such reforms. The ability of care homes to absorb the reduction in revenue implied by such an assumption is open to question. Machin and Wilson (Reference Machin and Wilson2004) found that the main effect on the care home sector of an increase in the UK minimum wage was an exit of providers from the market suggesting that they do not have substantial scope to accommodate increased costs or revenue reductions.
Using two linked simulation models, we consider the effects on public spending on older people in care homes for a base year (2007) and for 20 years from then. The numbers of older people needing care is expected to rise and the balance between LA-supported and self-funders may change (Hancock et al., Reference Hancock, Wittenberg, Pickard, Comas-Herrera, Juarez-Garcia, King and Malley2007a; Wittenberg et al., Reference Wittenberg, Pickard, Malley, King, Comas-Herrera and Darton2008; King et al., Reference King, Malley, Darton and Comas-Herrera2010), so it is important to consider not only the likely immediate effects of any reforms but also the effects in future years. We also present estimates of how the costs met by care home residents would be distributed by income level. Much of the debate on reform of long-term care funding has focussed on the need for a fairer system (Keen and Bell, Reference Keen and Bell2009). One reason why two members of the 1997 Royal Commission on Long-Term Care dissented from its recommendation of ‘free personal care’ was that they believed that the immediate beneficiaries would be relatively well-off older people (Royal Commission on Long-Term Care, 1999). Previous analysis showed that the benefits of reforms to the long-term care funding system can vary considerably according to the income level of the care recipient but did not consider the role of care home fees (Hancock et al., Reference Hancock, Juarez-Garcia, Comas-Herrera, King, Malley, Pickard and Wittenberg2007b).
2 Financing long-term residential care in England: the current system and some reform options
2.1 The current long-term residential care funding system in England
In England, access to public funds for long-term residential care is means-tested, other than for the small proportion (about 6%) of care home residents for whom the NHS meets the fees in full. For others who are assessed as needing nursing care, the NHS makes a fixed non-means-tested contribution to that part of the care home fee attributed to the cost of nursing care. LAs contribute to the remainder of the care home's fees based on a means test (Department of Health, 2010) which assesses a resident's income, financial wealth and, after 12 weeks in a care home, their housing wealth. In Scotland, care home residents also receive a non-means-tested flat-rate contribution to the part of a care home fee attributed to personal care; Scotland accepted the Royal Commission recommendation of free personal care.
Many care home residents are entitled to one of two non-means-tested social security benefits – Attendance Allowance (AA) and Disability Living Allowance (DLA) – which are paid to people with care needs. AA, the care component of DLA if received at one of the two higher rates and the related Severe Disability Premium (SDP) paid with means-tested benefits, are included in assessable income in determining a resident's contribution to care home fees. However, if a resident receives LA support with a care home's fees, payment of these benefits ceases after four weeks. Further details of the means test are given in the appendix. Few care home residents are liable for the full costs on the basis of their incomes alone; self-funders are generally people with significant assets, usually in the form of housing wealth (Mayhew et al., Reference Mayhew, Karlsson and Rickayzen2010).
2.2 Criticisms of the current system and reform options
The ability to insure against the risk of needing long-term care is likely to be welfare enhancing (Barr, Reference Barr2010) but the current English long-term care system does not permit people to insure fully against the risk of needing to fund care in later life. The market for private long-term care insurance is very small in the United Kingdom (Comas-Herrera et al., Reference Comas-Herrera, Butterfield, Fernandez, Wittenberg and Wiener2011b). The public system provides only partial insurance. The complex means test for public support makes it difficult for individuals to judge whether it would benefit them to supplement public support through private savings or insurance. The means test generates 100% effective marginal tax rates on income and the capital thresholds produce discontinuities in the return to savings. The system may therefore distort savings decisions (in general and as between saving in different forms). This has led to concerns that the current system reduces incentives to save (Her Majesty's Government, 2009; Mayhew et al., Reference Mayhew, Karlsson and Rickayzen2010). The inclusion of housing wealth in the means test for residential care but not care at home (Department of Health, 2003) gives LAs an incentive to fund residential rather than home care for people with housing wealth when the gross cost of care in their own homes is close to that of residential care. In such situations, LAs can recover more of the cost if the care is provided in a care home. The corollary is that older people with housing wealth face higher charges for care in a care home than for equivalent cost care at home.
Most of the reform options that have been debated for residential care in England involve the state making some non-means-tested contribution to the personal care component of care home fees, moving closer to a system of social insurance (Comas-Herrera et al., Reference Comas-Herrera, Wittenberg and Pickard2010). One option is to follow Scotland and introduce a flat-rate non-means-tested state contribution to the personal care component of care home fees. This is one interpretation of the ‘comprehensive’ option, as it would apply to residential care, that was stated as the then Government's long-term ambition in a 2010 White Paper (Her Majesty's Government, 2010). It is also one version of ‘free’ personal care recommended in the majority report of the Royal Commission on Long-Term Care (1999). The Wanless Review of Social Care (Wanless, Reference Wanless2006) and the 2009 Green Paper (Her Majesty's Government, 2009) both suggested a ‘partnership model’ in which a proportion of care costs would be met by the state without a means test; state help with the remainder of the costs would remain means-tested. The 2010 White Paper proposed an interim reform in which the state would meet the costs of personal care without a means test once a resident had been in a care home for two years. Such a reform would provide a degree of protection for residents’ assets. By placing a maximum on the period for which residents’ would be required to contribute to care home fees, it might also encourage a market for insurance products to cover the more limited risk that individuals would face. The central recommendation of the CFCS is similar to this but defines the limit in terms of the total value of care received including home care (CFCS, 2011).
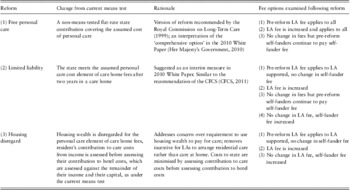
We analyse three potential reforms to the means tests for residential care, which have their roots in the options discussed above (Table 1).
Summary of reforms examined

LA = Local Authority; CFCS = Commission on Funding Care and Support.
Under two reforms, the state would provide a fixed non-means-tested contribution to the costs of personal care for all care home residents (reform 1, ‘free personal care’) or for those who have been in a care home for more than two years (reform 2, ‘limited liability’). Under these reforms, the contribution would equal an amount deemed to be the component of care home fees attributable to personal care costs.
Reform 3 (‘housing disregard’) exempts housing wealth from the means test for the personal care component of care home fees although it would still be taken into account in assessing a resident's contribution to ‘hotel’ costs, that is, that part of the fees attributable to accommodation, food etc. This reform would reduce the incentive for LAs to fund residential rather than care at home but would introduce a greater differential in the treatment of housing and non-housing wealth. We assume that the assessment of the contribution towards the personal care component of fees is made before the assessment for hotel costs. The resident's contribution to hotel costs would then be determined by any income and non-housing wealth remaining after meeting their contribution towards personal care and by their housing wealth after the first 12 weeks.
Reform 1 (free personal care) would result in all those assessed as having a need for a care home place being entitled to a contribution from a LA. LAs could thus negotiate fees for all care home residents who claimed this entitlement. The other reforms would increase the proportion of care home residents entitled to a contribution from the state but some residents would remain liable for the full fees. For each of the reforms we test the sensitivity of the results to the fees paid in respect of LA-supported residents after the reform. Initially, we assume that fees are unchanged after the reform. An alternative is that the fees paid by LAs rise after the reform to maintain care homes’ revenue per resident at the current estimated levels. A second alternative is that residents who would be self-funders under the current system, pay the self-funder fee rate after the reform, apart from the flat-rate non-means-tested state contribution. This happened when free personal care was introduced in Scotland. It is likely to be practicable only where the state contribution to care costs is not means-tested so we consider it only for reforms 1 and 2. For reforms 2 and 3, where there would remain residents who are wholly self-funded, we examine the possibility that it is the self-funder fee rate rather than the LA fee rate that rises.
For all reforms, we assume that payments of AA, DLA and the SDP would cease for residents in receipt of any LA support. This happens under the current English system and under free personal care in Scotland.
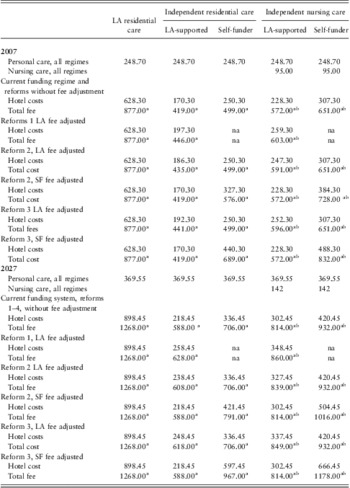
To examine the effect of these reforms, care home fees must be decomposed into nursing care costs, personal care costs and hotel costs. Assumed levels of fees and their decomposition are shown in Appendix Table A2. The amount of the fee that is deemed to be care rather than hotel costs is assumed to be the same for all types of care homes places. Hotel costs are then the difference between the assumed total fee (less any state contribution to nursing care) and this amount, and vary across types of care home places. For independent sector homes, we assume that under the current funding system, self-funders pay higher fees than LA-supported residents. In LA homes, the fees are assumed throughout to be the same for LA-supported and self-funding residents.
An important issue for the effects of the reforms in future years is how any non-means-tested state contribution is determined over time. The projected future cost of reforms can appear more affordable if it is assumed that the non-means-tested state contribution (or in the case of reform 3, the part of the fee for which housing wealth is disregarded) grows by less than any growth in care home fees (Hancock et al., Reference Hancock, Malley, King, Pickard, Comas-Herrera and Morciano2010). Although the future costs of reforms would be contained by such a policy, benefits to care home residents compared with the current funding regime would fall over time. Here we assume that total care home fees grow by a little less than real earnings growth (staff and capital costs, which form the majority of care home costs, are assumed to rise at the rate of real earnings growth; other costs are assumed to rise at the rate of general price inflation). We assume that the amount of the fee that is deemed to be care rather than hotel costs is uprated over time by real earnings growth. This matches our assumption that the NHS contribution to the nursing care component of fees for nursing home places is linked to earnings, which has been past practice. The proportion of fees accounted for by care costs and hence exempted fully (reform 1) or partially (reform 2) from the means test or not tested against housing wealth (reform 3) changes only marginally over time.
3 Methods
The two simulation models that we use are the Personal Social Services Research Unit (PSSRU) Long-term Care model and CARESIM, a microsimulation model of care charges.
3.1 The PSSRU long-term care model
The PSSRU model is concerned mainly with the aggregate effects of long-term care policies. It makes projections of private and public expenditure on long-term care in absolute terms and as a per cent of Gross Domestic Product (GDP), volumes of services provided and public expenditure on disability benefits. Here we are concerned with residential care, which includes care in homes that provide nursing care and/or personal care.
3.2 CARESIM
CARESIM is a microsimulation model that uses a pooled sample of 25,747 people aged 65+ living in England from the 2002–2003, 2003–2004 and 2004–2005 UK Family Resources Survey (FRS; Department for Work and Pensions, 2010). Information on sample members’ incomes, assets (including estimates we make of their housing wealth) and other relevant characteristics are used to simulate their liability to pay for care, should care be needed, under the current and alternative means tests. The simulations are performed for a base year and for future years. Monte Carlo techniques are used to ‘age’ the sample and to assign uncompleted lengths of stay in a care home to sample members. Liability to contribute to care home fees is calculated allowing for asset depletion to have taken place during the assigned time in a care home. In effect for each projection year, this mimics the observation of a cross-section of care home residents, producing results that can be used with the PSSRU model. Both models produce outputs that relate to a point in time.
Because it is more difficult to predict the future incomes of people who are not yet retired than it is for those who are already drawing pensions, the sample is not refreshed. By 20 years from the base year, the simulations are representative only of people aged 85 and over. The distributional analysis shown below is therefore confined to people aged 85 and over. It is amongst this oldest age group that the proportion of people living in care homes is highest.
3.3 Links between the two models
Within CARESIM, simulations are performed for three types of care home place: places with nursing care in independent sector homes, which provide both nursing and personal care; places without nursing care in independent sector homes, which provide only personal care (independent residential care places); and LA-run homes, which provide personal but not nursing care.
The PSSRU projections on the numbers and characteristics of people in each type of care home place provide weights with which to adjust the CARESIM sample to be representative of people in care homes. A proportion of independent sector nursing care places are assumed to be fully funded by the NHS. For other types of places, CARESIM provides output to the PSSRU model, which is used to apportion total expenditure into private and public expenditure under the current and alternative means tests.
Results from the models provide point-in-time estimates of public and private expenditure on care and of changes in care home residents’ disposable incomes. Further model details are in the Appendix.
In this paper, there is no direct allowance for demand for or supply of care homes to respond to changes in the funding system. Projections assume that demand for care home places grows as a result of population ageing and assumed trends in other needs-related characteristics and the supply of care homes adjusts such that demand is no more constrained by supply than in the base year.
3.4 Key assumptions
All the analysis in this paper relates to England. The key economic and demographic assumptions used for a ‘base case’ are set out in Box A1 in the appendix. Projections for this base case are compared with projections under alternative funding regimes and alternative assumptions on fee levels. All money values are expressed in 2007 prices. Public expenditure on long-term residential care for older people includes disability benefits received by self-funders and used towards the cost of their care as well as LA spending on care home fees.
Key economic and demographic assumptions used in the base case
• The number of people by age and gender changes in line with the GAD (Government Actuary's Department) 2006-based principal population projections for England. Marital status changes in line with GAD 2006-based marital status and cohabitation projections for England and Wales.
• Prevalence rates of disability by age and gender remain unchanged, as reported in the 2001–2002 GHS (General Household Survey) for Great Britain for household population (and assuming that all those in care homes are disabled).
• Home-ownership rates, as reported in the pooled 2003–2004, 2004–2005 and 2005–2006 Family Resources Survey, change in line with projections produced by CARESIM.
• The proportions of older people receiving care in a care home and disability benefits remain constant by age, disability and other needs-related characteristics.
• The staff and capital cost components of care home fees rise by 2% per year in real terms. Non-staff revenue costs remain constant in real terms. Average earnings increase by 2% per year in real terms. Real GDP rises in line with 2008 Her Majesty's Treasury assumptions.1
• The supply of care home places will adjust to match demand and demand will be no more constrained by supply in the future than in the base year.
• State pensions and means-tested benefits for pensioners follow policy as it was before recent Coalition Government changes which are currently going through Parliament: the Basic State Pension is uprated in line with earnings from 2012; the Guarantee Credit level in Pension Credit, Housing and Council Tax Benefit is linked to earnings growth; the savings credit threshold within Pension Credit is linked to earnings until 2014 after which it is linked to price inflation as measured by the Retail Price Index (RPI).
• Attendance Allowance and Disability Living Allowance are linked to the RPI.
• The long-term care funding system is the current system that operates in England. The non-means-tested National Health Service contribution to nursing care in a care home us uprated according to real earnings growth
• The differences in fees paid by Local Authority-supported and self-funding residents in independent sector care homes are as given in Table A2for the current funding regime.
1Short-term GDP and cash deflators based on 30 November 2008 estimates. Long-term GDP projections are based on 2008 budget report (Her Majesty's Treasury, 2008).
3.5 Measuring the distributional effects of potential reforms
To assess the distributional effects of funding regimes we analyse the simulated financial gains to care home residents according to their position in the income distribution specific to their age group – here those aged 85 and over. We classify residents by their position in the income distribution specific to their age group, rather than by their position in the income distribution for the whole population because we are examining reforms that affect mainly people in the older age group. Our analysis thus assesses the extent to which among the age group affected, gains would be concentrated on those with relatively high or low incomes for that age group. Our approach also ensures that sample sizes are equal in each income quintile. Income is the net income of the family unit (single older person or older couple) that would be received by the unit when living at home without any care needs. AA/DLA, and associated additions to means-tested benefits are not included. To include them without any allowance for the costs of disability that they are designed to address, would overstate recipients’ living standards (Stapleton et al., Reference Stapleton, Protik and Stone2008; Hancock and Pudney Reference Hancock and Pudney2010). Net income for this purpose includes investment income but does not take account of housing wealth. It is adjusted for composition of the family unit using the OECD modified equivalence scale (Hagenaars et al., Reference Hagenaars, de Vos and Zaidi1994) of 1 for the first adult, 0.5 for each subsequent adult or child aged at least 14 years and 0.3 for each younger child. Amongst the 85+ age group the thresholds for the income quintiles are £6400, £7200, £8000 and £10,400 (annual income in 2007 prices). Corresponding thresholds for the total population are £5700, £9200, £13,400 and £20,100. Incomes of the 85+ population are much lower than for the total population; for example, the threshold for the top quintile for the 85+ population is roughly half that for the total population.
Gains from the reforms are measured as the change in disposable income, net of contribution to care home fees. AA/DLA and associated additions to means-tested benefits are included in disposable income for this purpose, because the reforms may change irrespective of such income is received. Since some of the benefit of the reform derives from a slower depletion of capital, disposable income includes an assumed 2% real return on any capital that is left at the point that we ‘observe’ residents.
4 Results
4.1 The consequences of differential fees under present funding policy
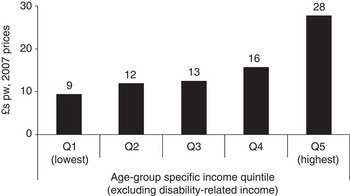
Under our base case, public expenditure in England on long-term residential care for people aged 65+ and associated disability benefits is estimated to be £5.5 bn in 2007, or 0.45% of GDP. If the fee differential were removed such that fees paid in respect of LA-supported and self-funding residents are equal to the weighted average of those assumed under the base case, the public cost of long-term residential care for older people would need to be about 4% higher to meet the extra cost to LAs. If public spending remained at base case levels, the implication is that there would be some 13,000 fewer care home places attracting public funding. If public funding were expanded to meet this extra cost, we estimate that the distribution of gains across income groups, in terms of reduced costs to residents (before taking account of how this expansion would be financed), would be as shown in Figure 1. The main beneficiaries would be current self-funders. This is because under the current means test, the contribution that LA-funded residents pay towards care home fees is insensitive to the level of the care home fees, being determined largely by their income, rather than by the fee itself. In contrast, self-funders pay higher fees as a consequence of LAs negotiating below market fees, and so benefit if this differential is removed. There are more self-funders in the higher income groups. Average gains from removing the fee differential are highest in the top quintile at £28 per week and lowest in the bottom quintile at £9. That average gains are positive in all quintiles shows that self-funders are spread around the income distribution, largely because self-funding status depends more on wealth, and in particular housing wealth, than income. Thus, there are income-poor, housing-rich individuals who would benefit from removal of the fee differential.
Average gains from removing the difference between the self-funder and Local Authority fee rates; care home residents aged 65+, 2007

Our projections suggest that by 2027, public expenditure on long-term residential care for people aged 65+ would double to £11 bn (April 2007 prices) under the current funding system, assuming the present differences in LA and self-funder fees remain. This would amount to around 0.66% of GDP. Removal of the fee differentials would add a little under £0.5 bn to public spending in 2027, taking it to 0.68% of GDP.
4.2 Effects of reforms
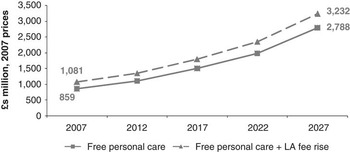
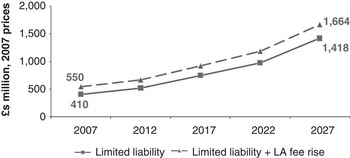
Figures 2–4 show the extra public expenditure costs of the reforms in the base year and after 20 years. Free personal care would increase public spending the most, adding around £0.9 bn in 2007, rising to £2.8 bn by 2027, bringing expenditure to 0.82% of GDP at that point. If LAs were to increase the fees they pay on behalf of residents to a level which maintains care homes’ revenue per place, this would add a further £0.2 bn in 2007 rising to £0.4 bn by 2027 at which point public spending would amount to 0.85% of GDP. The housing disregard reform costs less than the limited liability reform, although the public cost of both increases noticeably if LA fee levels rise. The public cost of the housing disregard reform is projected to be £0.25 bn in 2007 if LA fees are unchanged (bringing the total public cost to 0.47% of GDP) and £0.43 bn (total cost 0.49% of GDP) if they are increased. Corresponding figures for 2027 are £0.75 bn (total cost 0.70% of GDP) with no fee change and £1.11 bn (total cost 0.72% of GDP) if LA fees rise. Equivalent costs for the limited liability reform are £0.41 bn (total cost 0.49% of GDP) compared with £0.55 bn (total cost 0.50% of GDP) in 2007 and £1.42 bn (total cost 0.74% of GDP) compared with £1.66 bn (total cost 0.75% of GDP) in 2027.
Projected additional public expenditure on care home places, 2007–2027, under free personal care

Projected additional public expenditure on care home places, 2007–2027 under limited liability

Projected additional public expenditure on care home places, 2007–2027, under housing disregard

If the self-funder fee is assumed to rise (reforms 2 and 3) or if those who would otherwise be self-funders continue to pay the self-funder rate (reforms 1 and 2) public expenditure is affected only in so far as residents liable for the higher self-funder fee deplete their assets faster and may become eligible for state support sooner. Our results suggest this effect is marginal. These variants are therefore not included in the graphs.
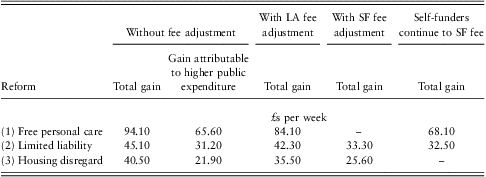
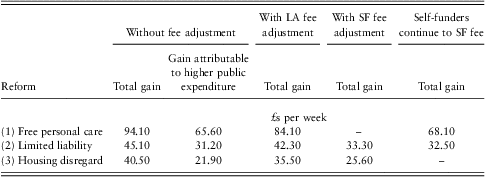
Table 2 presents the simulated mean weekly gains from each of the reforms for care home residents aged 65+ in 2007. Figures in the first column show that without any fee adjustment, mean weekly gains are projected to be around £94 for free personal care, £45 for limited liability and £40 for the housing disregard. The gains attributable to higher public spending shown in column two, are £66, £31 and £22. The differences between these two sets of figures are attributable mostly to the gains to residents resulting from a switch from the self-funder fee rate to the LA fee rate. They are thus indicative of the reduction in care home income per resident that the reforms would produce if care homes received the LA fee for all residents receiving some LA support. Thus under free personal care, care home providers would receive about £29 less on average per resident. The reduction is least, at around £14, for the limited liability option. These amounts can be compared with the average total fee over all types of care home places that we simulate to be received by care homes. In 2007, this average was £542. So the loss in income under the reforms if fees are not adjusted ranges from 2.6% to about 5.3% per resident.
Simulated average weekly gains from reforms, care home residents aged 65+, 2007
LA = Local Authority; SF = self-fund.
Subsequent columns in Table 2 show that the gains to residents would be less if the LA or the self-funder fee were to rise or those who self-fund under the current system continue to be liable for the self-funder rate even if they receive LA support. The mean gains are all lower. The differences are largest if those who self-fund under the current financing system remain liable for the self-funder rate. Under limited liability, for example, this would reduce the mean gain from £45.10 to £32.50 (28%). The differences are smallest if the LA fee is increased but even here gains are lower by between 8% (limited liability) and 12% (housing disregard).
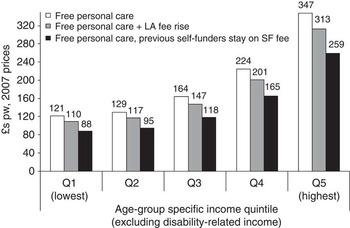
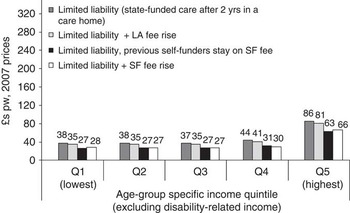
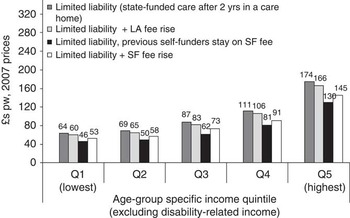
The effects of the reforms and of the alternative assumptions on fee rates vary according to the residents’ income levels (Figures 5–10). Gains from free personal care increase steadily with income level, favouring most those in the highest income quintile. Without any fee adjustment, mean weekly gains in 2007 from free personal care range from £73 in the lowest income group to £175 in the highest group. Increased fee levels or maintaining self-funders on the self-funder fee rate reduces the gains most in the higher income quintiles but the association between size of gain and income level remains. The limited liability reform also benefits the highest income quintile most but there is less variation across the other income quintiles, at least in 2007.
Mean gains by income quintile, free personal care and partnership reforms, care home residents aged 85+, 2007

Mean gains by income quintile, free personal care and partnership reforms, care home residents aged 85+, 2027

Mean gains by income quintile, limited liability reforms, care home residents aged 85+, 2007

Mean gains by income quintile, limited liability reforms, care home residents aged 85+, 2027

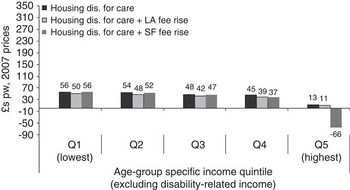
Mean gains by income quintile, housing disregard for care reforms, care home residents aged 85+, 2007

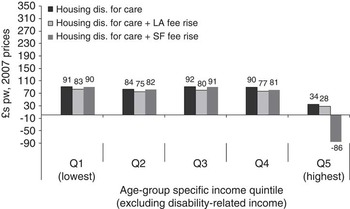
Mean gains by income quintile, housing disregard for care reforms, care home residents aged 85+, 2027

In contrast to reforms 1 and 2, the housing disregard reform benefits those in the highest income group the least. Residents in this income group are likely to be able (and would be required) to meet their care home fees in full from their income. This is a reform that favours those who are housing-rich but income-poor. Indeed, if the self-funder fee rate rises to compensate for the increased proportion of residents paying the LA rate, residents in the top income quintile would lose an average of £66 per week from this reform in 2007.
Expressed in 2007 prices, all the gains are larger in 2027 than in 2007 but the pattern across income quintiles of the different reforms and fee assumptions is similar.
5 Discussion
In this paper, we have used two simulation models to examine the costs and distributional effects of potential reforms to the English system of funding long-term residential care for older people. We have paid attention to the differentials between the fee rates paid in respect of LA-supported residents and those paid by self-funders. The current differentials imply the existence of cross-subsidies from self-funders to LA-supported residents. The price differential could be viewed as a form of price discrimination which can be welfare enhancing, but the care home market does not appear to meet the conditions for this to be the case (Hancock and Hviid, Reference Hancock and Hviid2010).
In common with funding reforms proposed in recent years, all the reforms examined here would increase the proportion of residents receiving some LA support. If care homes were to receive the lower LA fee rate for all such residents, their income per resident would fall. The supply of care home places could reduce as a result. We therefore examined three ways in which care home income per resident might be maintained after implementation of the reforms. One option is for the fee paid by LAs to rise. A second is for those who would be self-funders under the current system to continue to be liable for the self-funder fee. This is likely to be practicable only for reforms in which there is a non-means-tested state contribution. The third option is for the self-funder fee rate to rise. This last option is clearly possible only for reforms where there remain some self-funders.
We found that raising the LA fee rate would raise the public cost of the reforms by over £200 m for free personal care in 2007, and more than double that by 2027. For this reform it would reduce the average gain to care home residents by about £10 a week in 2007. Raising the self-funder rate has little effect on the public cost. Requiring residents who would self-fund under the current system to pay the self-funder rate under reforms where they would be eligible for a non-means-tested state contribution reduces the 2007 gains to care home residents by £13 (limited liability) and £26 (free personal care) on average. If fee rates remain at their projected levels under the current system, the reforms would reduce the income per resident received by care homes by between £14 and £29 a week or 2.6% to 5.3% of their current average fee per resident.
The precise details of how a reformed system would operate in practice are important to its effects. In the reforms examined here, a key assumption was that the split of care home fees into costs associated with nursing care, personal care and hotel costs remains broadly constant over time. Within the current funding system there is already a non-means-tested contribution to nursing care. The reforms examined would introduce a non-means-tested contribution to personal care or exempt housing wealth from the means test for help with the personal care component of fees. Under the current system, a fall in the value of the non-means-tested contribution to nursing care relative to the total fee, would result in more of the fee being subject to the means test. Similarly, in the reforms examined, if the personal care component does not keep pace with growth in fees, the costs and benefits to residents of the reforms would decline over time. The method of uprating any component of fees that is treated more favourably in the means test is a political choice but one whose effects need to be understood. When Scotland introduced a non-means-tested state contribution to the care component of care home fees in 2002, that contribution remained constant in nominal terms for several years before being increased in 2008 (Scottish Government, 2009). A similar thing happened in Germany (Rothgang, Reference Rothgang2002).
For the reform in which housing wealth is disregarded in assessing a resident's contribution to the care component of care home fees we assumed that this assessment is made before assessing their contribution to hotel costs. This is important since only income and non-housing wealth would be assessed for a resident's contribution to personal care. If residents are allowed to use their income and non-housing wealth towards hotel costs before their contribution to these care costs is assessed, that contribution will be smaller and the cost to public funds will be larger. Moreover, only those whose income and non-housing wealth is sufficient to cover the full costs of the fees would be self-funders.
A strength of this paper is the use of two linked simulation models. This allows us to model the complex English long-term care funding system and its interactions with the income tax and benefit system for older people, and investigate the likely aggregate and distributional effects of a wide range of potential reforms to the system. However, any modelling exercise such as this relies on a great many assumptions about factors that are treated as exogenous to the reforms examined, and how demand and supply might respond to reforms. The sensitivity of projections of long-term care expenditure to alternative assumptions on the numbers of disabled older people and trends in unit costs of care has been investigated elsewhere (Hancock et al., Reference Hancock, Comas-Herrera, Wittenberg and Pickard2003; Wittenberg et al., Reference Wittenberg, Pickard, Malley, King, Comas-Herrera and Darton2008; Malley et al., Reference Malley, Hancock, Murphy, Adams, Wittenberg, Comas-Herrera, Curry, King, James, Morciano and Pickard2011). We do not here allow explicitly for potential changes in the supply and demand for care home places as a result of the reforms. Nonetheless, a concern that potential reforms to the funding system could reduce care home revenues and hence the supply of places is at the heart of this paper. We have sought to illustrate how adjustments to care home fees that could prevent this fall in revenues would affect the cost and distributional consequences of such reforms.
We have had to make a number of assumptions based on imperfect data. One area is length of time care home residents spend in care homes. Assumptions on such durations are important for determining the extent to which residents have depleted their capital by the point at which we calculate their assessed contribution to a care home's fees and under reform 3, which of them have been in a care home for at least two years. The data and method used follows that described in Wittenberg et al. (Reference Wittenberg, Hancock, Comas-Herrera and Pickard2002). In our base year, it produces a mean and median uncompleted length of stay of 2.7 and 2.1 years, respectively. This is higher than the mean and median completed duration of 2.2 and 1.3 years found using more recent data (Forder and Fernandez, Reference Forder and Fernandez2011). A sample of the stock of care homes spells in process may contain more long spells and fewer short spells than a sample of completed spells. Nonetheless, our data on uncompleted spells are somewhat out of date and durations in care homes may have fallen since then (Forder and Fernandez, Reference Forder and Fernandez2011). If that has happened we will have overestimated the effects of reforms that change the rate at which residents deplete their capital and overestimated the costs of the limited liability reform.
For the distributional analysis, we have classified care home residents according to their position in the income distribution for their age group. This ensures a reasonable sample size in each income quintile and, given that the sample is not refreshed, allows us to draw comparisons at least for the 85+ age group between the base year and 20 years hence. However, it needs to be remembered that in the analysis people aged 85+ in the top income quintile have high incomes for their age group. In our sample, in 2007, only 20% of the 85+ age group who were in the top income quintile for their age group, had incomes in the top quintile for the total adult population. For the 65+ population as a whole, 35% of those in the top quintile for their age group were in the highest income quintile for the total population. Our analysis addresses vertical but not horizontal equity concerns. Much of the debate on long-term care funding has been concerned with so-called ‘diagnostic inequities’. The NHS seeks to provide health care on the basis of health need alone rather than ability to pay. Access to publicly funded long-term personal care takes account of both care needs and ability to pay. People suffering from some illnesses receive personal care without charge as a by-product of NHS care, whereas those whose care needs stem from conditions for which treatments are not available on the NHS are required to contribute. Nevertheless, it seems important than any reforms to the system are made with knowledge of their effects on different income groups.
Finally, no account is taken of how the reforms would be financed. All involve higher public expenditure. This could be financed by cuts in spending elsewhere, borrowing or raising extra public revenue. There are very many ways to raise extra revenue, each with the potential to affect different population groups differently. Our assessment of the distributional effects of potential reforms to the long-term care funding system thus needs to be complemented by an assessment of the distributional effects of any proposals to raise revenue to finance them.
6 Conclusion
In England, it is commonly believed that LAs currently pay care home fee rates that are below the level at which care homes break even. If this is the case, the supply of care homes is dependent on care homes being able to charge self-funders higher rates. A policy reform that substantially increases the proportion of residents on the lower LA fee may not be sustainable unless the LA fee rate is increased. If that happens, the cost to the public sector will be higher and the gains to care home residents will be lower. Alternatives to increasing the LA fee rate are either an increase in the self-funder rate or retaining the self-funder rate for those who would be self-funders under the present funding regime. Although these have relatively small effects on the public finances, they can considerably reduce the benefits to residents that result from the reform. Indeed, they can result in losses for some residents. It would be unwise to ignore this issue when considering proposals to reform the English long-term care financing system or other systems in which there may be cross-subsidisation between publicly and privately funded recipients of care.
Acknowledgements
This research was funded under grant RES 339-25-0002 from the UK Economic and Social Research Council. Material from the Family Resources Survey and General Household Survey is crown copyright and made available by the Office for National Statistics via the UK Data Archive. Responsibility for the analysis and view expressed in this paper rests with the authors.
The means test for state help with care home fees
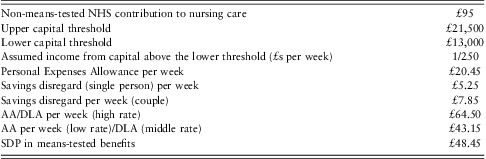
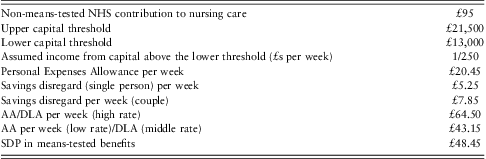
Residents with capital above an upper threshold are not entitled to Local Authority (LA) support. Housing wealth is included in capital, after the first 12 weeks in a care home, unless a qualifying relative continues to live in the resident's home. For residents with capital below the upper limit, LAs meet any positive difference between the care home fee and their income after deducting a personal expenses allowance (PEA) and a disregard on income from savings. Income from capital is not included in assessed income, but capital above the lower threshold is deemed to generate a return that is included to assessed income.
Values of main parameters of the care home means test, April 2007
Assumed components of care home fees, £s per week, April 2007 prices

Decomposing care home fees into nursing care, personal care and hotel costs
Assumptions on the average LA fee rate charged in each kind of home in April 2007 are based on Department of Health administrative data (PSS EX1) on fees paid by LAs in 2006–2007, uprated to 2007 prices using the Retail Price Index (RPI). Self-funder fee rates are assumed to be about £80 a week higher than this, based on various Laing and Buisson surveys of the care home market. An estimate of personal care costs for LA-supported residents in independent sector residential care is derived as follows. We take the minimum income guaranteed for a single pensioner through the means-tested benefit system in April 2007, plus an allowance for accommodation costs as being the hotel cost component of the assumed fee for a residential care place in an independent sector home. The allowance for accommodation is based on the residential allowance which existed until 2003 for older people in care homes who were claiming means-tested benefits, increased by the RPI to April 2007 prices. Personal care costs are then derived as the difference between the fee rate for LA-supported residential care places in independent homes and these hotel costs and assumed to be the same for all types of care home places. The nursing care costs of nursing care places are assumed to be the level met by the National Health Service. Hotel costs are then assumed to be the difference between the fee level and the assumed personal care and (where relevant) nursing care costs.
Further details of the simulation models
For the base year, the Personal Social Services Research Unit (PSSRU) model uses data on care home residents from the 2001 Census on their age, gender and marital status of care home residents and from PSSRU sample surveys on their previous household composition and housing tenure. It makes projections for the future year based on specified assumptions about the evolution of future trends in the socio-demographic and economic drivers of demand for and expenditure on long-term care (see Box A1). Details can be found in Wittenberg et al. (Reference Wittenberg, Comas-Herrera, King, Malley, Pickard and Darton2006).
In CARESIM, death of sample members is simulated according to official age and gender-specific mortality rates, using Monte Carlo techniques. The evolution of gross incomes and capital is modelled under certain assumptions and taking account of the inheritance of pension rights and assets when a partner is simulated to die. Each older sample member is randomly allocated an uncompleted duration (in weeks) in each of three types of care home place using data from Netten et al. (Reference Netten, Bebbington, Darton, Forder and Miles1998; see also Wittenberg et al., Reference Wittenberg, Hancock, Comas-Herrera and Pickard2002, Appendix 3.1).
Underlying entitlements to Attendance Allowance (AA)/Disability Living Allowance (DLA) are assigned for each type of care home place using probabilities based on a 1999 survey of self-funded admissions to care homes (Netten et al., Reference Netten, Darton and Curtis2001). Income tax liability and entitlement to means-tested social security benefits are then simulated to arrive at net income on which liability to pay for care home fees is assessed. In determining residents’ contributions to their care home fees, we assume that they first allocate income apart from the PEA, to these costs and draw on capital (financial assets followed by housing wealth) only if income is insufficient. We assume that capital is not used for purposes other than the resident's contribution to care home fees. Self-funders in receipt of AA or DLA are assumed to use that income before other income.
CARESIM provides age-group-specific estimates to the PSSRU model of: the proportion of residents who self-fund; the proportion of the fees of self-funders met from AA/DLA; and the proportion of fees contributed by LA-supported residents from their assessed income and assets. For each projection year up to 2020, a weighted average across the three oldest age groups (75–79, 80–84, 85+) of the proportion of care recipients entitled to LA support is derived using as weights the proportions of care recipients that the PSSRU model projects would be accounted for by each age group. For 2027, data for the oldest age group are used. The trend over time in the resulting average is then applied to the base year proportion entitled to LA funding assumed in the PSSRU model. Weighted averages for the shares of costs met by LA-supported residents are derived in a similar manner.