1. Introduction
Ice-shelf moraines are linear accumulations of debris deposited or relocated around the margins of ice shelves (Reference Benn and EvansBenn and Evans, 2010). They are widely used to reconstruct the presence of floating glacier ice because they record the position of ice margins and frequently contain marine organisms that can be dated (e.g. Reference England, Bradley and MillerEngland and others, 1978; Reference Sugden and ClappertonSugden and Clapperton 1981; Reference Hjort, Bentley and IngόlfssonHjort and others, 2001). Such reconstructions are particularly important in Antarctica where 45% of the continent is fringed by ice shelves, and in the Arctic where ice shelves were extensive during glaciations (Reference Hattersley-SmithHattersley-Smith 1969; Reference England, Atkinson, Dyke, Evans and ZredaEngland and others, 2004). Although ice-shelf moraines are used as a form of proxy evidence to reconstruct the former presence of ice shelves in contact with land (e.g. Reference AndersonAnderson, 1999; Reference Hjort, Bentley and IngόlfssonHjort and others, 2001), there have been few studies of the glaciological and sedimentary processes involved in their formation. A study of the ice-shelf moraines in George VI Sound, Antarctica, by Reference Sugden and ClappertonSugden and Clapperton (1981) evaluated three mechanisms by which debris can be incorporated into the ice shelf and concluded that it is primarily sourced from basal debris from terrestrial glaciers with the addition of some glaciomarine debris by bottom freezing and sliding. By contrast, a study of the same moraines by Reference Hjort, Bentley and IngόlfssonHjort and others (2001) suggested that they consisted of thrust slabs of glaciomarine sediment together with folded fluvial sediments derived from epishelf streams and lakes. Slabs of thrust glaciomarine sediments were also observed in recent ice-shelf moraines that have formed adjacent to Sørsdal Glacier, an outlet glacier with a small ice shelf in East Antarctica (Reference FitzsimonsFitzsimons, 1997). In this location the moraines were interpreted as the product of basal freezing followed by thrusting to produce an ice-shelf moraine that consisted of an en echelon arrangement of thrust plates.
Developing an understanding of the glaciological and sedimentary processes of ice-shelf moraine development requires examination of the formation of marine ice at the landward margins of ice shelves, developing a knowledge of the entrainment of marine debris into ice shelves, and understanding the relationship between the age of entrained marine organisms and the age of the moraines.
The McMurdo Ice Shelf is a relatively small (~5000km2) ice shelf located at the southern end of McMurdo Sound in the western Ross Sea (Antarctica) embayment that has extensive accumulations of debris on its surface and large ice-shelf moraines along its southern margin (Reference DebenhamDebenham, 1920; Reference Kellogg, Hughes and KelloggKellogg and others, 1996; Fig. 1). Previous research conducted on the McMurdo Ice Shelf has focused on the interpretation of surface features, particularly on the extensive debris cover that mantles parts of the ice-shelf surface (e.g. Reference DebenhamDebenham, 1920, Reference Debenham1948; Reference Stuiver, Denton, Hughes, Fastook, Denton and HughesStuiver and others, 1981; Reference Kellogg and KelloggKellogg and Kellogg 1987; Reference Kellogg, Kellogg and StuiverKellogg and others, 1991a, Reference Kellogg, Kellogg and Stuiverb, Reference Kellogg, Hughes and Kellogg1996; Reference CliffordClifford, 2005; Reference Glasser, Goodsell, Copland and LawsonGlasser and others, 2006). Reference DebenhamDebenham (1920) attributed the presence of marine debris on the ice-shelf surface to the ice shelf touching the bottom of the sea floor where sediment was entrained and brought to the surface of the ice shelf because of the strongly negative surface mass balance. This mechanism has been widely cited in numerous studies of marine debris entrainment by ice shelves (e.g. Reference Gow and EpsteinGow and Epstein, 1972; Reference Lyons and MielkeLyons and Mielke, 1973; Reference Kellogg and KelloggKellogg and Kellogg, 1987; Reference BaroniBaroni, 1990). However, Reference SwithinbankSwithinbank (1970) pointed out that the Debenham mechanism is not compatible with an environment where there is considerable water depth beneath the ice shelf. He advocated the formation of anchor ice as an explanation for debris on the surface of the ice shelf, a suggestion that Reference DebenhamDebenham (1965) later accepted. Later, the pattern of radiocarbon dates of marine fossils led Reference Kellogg, Kellogg and StuiverKellogg and others (1991b) to conclude that two types of surface material can be identified: remnant deposits from supraglacial transportation of former grounded ice sheets, and sediment entrained by the Debenham mechanism.

The aim of this paper is to examine the structure and composition of ice at the southern edge of the McMurdo Ice Shelf to develop an understanding of the formation of marine ice, entrainment of marine debris and the deposition of ice-shelf moraines.
2. Field and Laboratory Methods
Five short (3–5 m) ice cores were recovered from three locations on the southern McMurdo Ice Shelf using a 90 mm Kovacs ice auger, and two 1m long cores were extracted from the ice-cored moraines (Fig. 1). All ice samples were maintained below –10˚C in the field before they were shipped to Scott Base and on to New Zealand, during which time they were kept below –18˚C. The topography of the moraines at the edge of the ice shelf was surveyed with a compass and clinometer. A pulseEKKO 100 ground-penetrating radar (GPR) with a 400V transmitter was used to map subsurface structures. The radar was used in a broadside configuration (antennas perpendicular to the survey line) with 50 and 100MHz antennas. The wave propagation velocity of the ice and debris-bearing ice was determined using common-midpoint surveys, which showed that clean ice had a velocity of 0.16mns–1 and the debris-bearing ice beneath the ice-cored moraines had a velocity of 0.16–0.12mns–1. An average velocity of 0.14mns–1 has been used to calculate depth from two-way-travel time because exposures of the ice-cored moraines consisted of a mixture of clean ice and debrisbearing ice, and because the pattern of velocity variation was not predictable. Although using an average velocity changes the depth scale of the radargrams and introduces some geometrical distortion, the strength and overall geometry of the reflections did not change with different velocity solutions.
The GPR data were ‘dewowed’ to remove the transient signal associated with the low-frequency component of the radar pulse, migrated and topographically corrected using Ekko View 2 (Sensors and Software Inc.). The aim of the F-K migration used by the Sensors and Software program is to collapse hyperbolae produced by diffractions, which are a characteristic of heterogeneous materials, discontinuous layers and open cracks, all of which are likely to be encountered in ice-cored moraines.
Subsamples were cut from the ice cores using a bandsaw in a laboratory maintained at –20˚C. Solute concentrations were assayed using flow injection analysis and atomic absorption mass spectrometry. Deuterium concentrations were measured with a VG Sira Isotope Ratio Mass Spectrometer using the chromium reduction technique described by Reference Donnelly, Waldron, Tait, Dougans and BearhopDonnelly and others (2001). The samples were assayed six times per injection, and repeated in triplicate with a precision of 0.5%. The oxygen isotopes were analysed by equilibrium of carbon dioxide in a closed system and measured using gas chromatography isotope ratio mass spectrometry following the method described by Reference NelsonNelson (2000) and Reference Tu, Brooks and DawsonTu and others (2011). Each sample was assayed six times, and the first injection was ignored to reduce memory effects in the data. Samples were measured against a standard laboratory reference gas and calibrated using Standard Light Antarctic Precipitation (SLAP) and Standard Mean Ocean Water (SMOW). The precision for this method is 0.10%. Once the freezing slopes for the co-isotopic data were calculated, the values were used to model the freezing process using the theoretically derived and empirically tested relationships of Reference Jouzel and SouchezJouzel and Souchez (1982) and Reference Souchez and JouzelSouchez and Jouzel (1984) for a modified Rayleigh distillation system.
3. Moraine Morphology and Structure
The edge of the ice shelf is characterized by a 5 km wide dark zone, which represents an area where there is no firn on the surface and the ice contains low volumes of debris (Fig. 1). The ice flow measured ~3 km west of site 2 is ~4ma–1 in a southwesterly direction, i.e. flowing obliquely toward Minna Bluff (Fig. 1). This is two orders of magnitude lower than velocities on the adjacent Ross Ice Shelf (Reference SwithinbankSwithinbank, 1970; Reference CliffordClifford, 2005). The edge of the ice shelf is marked by a series of epishelf lakes fed by drainage of surface melt from the ice shelf and seasonal snowpatches which are widespread on the landward edge of the lakes (Fig. 2). A 400m wide belt of ice-cored moraines oriented parallel to the ice edge occurs inland of the epishelf lakes (Fig. 2). Within the belt of ice-cored moraines, four to six individual ridge crests form an irregular topography that rises 7–20m above the ice-shelf surface. The moraines closest to the ice margin have sharp crests and become progressively more rounded and less distinct away from the ice margin. The ridge closest to the ice margin consists of a concave ramp of gravel with slopes from 10 to 25˚ and an active tide crack that is parallel to the ice edge (Fig. 2) and the ridge crest (Fig. 3).
Ice-cored moraines at the edge of the ice shelf at site 4 (Fig. 1). (a) Photograph of a 10m high gravel ridge. (b) Northern side of the ridge closest to the ice edge, with active tide-cracks in front of the two people.

Debris-bearing ice in the core of the moraines. (a) Clean ice resting over debris-bearing ice exposed in the crest of a moraine. (b) Diffuse sand-sized debris layers. (c) Strongly deformed debris-rich accretion-layered ice.

Surface material on the moraines consists of a thin (<200 mm) veneer of poorly sorted sub-angular to well-rounded gravel with a mean particle size of 20 mm. About 8% of the particles are striated and faceted, and occasional boulders up to 1.5m in diameter occur on the moraine slopes. Numerous small linear accumulations project 0.2– 2 m above the moraine surface (Fig. 2a) together with abundant open cracks which extend from the underlying ice core of the ridge.
Exposures of the core of the moraine show that each ridge is associated with the outcrop of individual or multiple layers of debris-rich ice that are overlain and underlain by clean ice (Fig. 3). Although the moraine deposits contain abundant fragments of marine shells and worm tubes up to 20 mm in diameter, no intact shells were observed in the deposits. Well-preserved marine shells, sponges, bryozoans and worm tubes occur on the surface of the ice shelf adjacent to the ice-cored moraines, including delicate Adamussium colbecki (Fig. 4) and Yoldia eightsi valves.
Marine fossils on the surface of the ice shelf: (a) sponges and (b) a delicate Adamussium colbecki valve on the surface of the ice shelf ~600m north of the Minna Bluff shoreline.

The GPR profiles are characterized by strong, linear reflections that are up to 50 m below the surface and rise to intersect the moraine surface obliquely (Figs 5–7). Figure 5 shows a 50 MHz line that crosses the moraine closest to the ice shelf. At 2 m the diffractions in the radar data record the presence of an open crack. Migration of the data has been partly successful because it has collapsed the diffractions, although it has produced artefacts such as concave reflections (e.g. at 10 m) and destructively interfered with the radar data (e.g. at 100 m). The strength of the main reflectors is spatially variable, and three distinct clusters intersect the surface at 70, 150 and 200 m along the profile. Examination of the area where the layers intersect with the surface of the moraine showed that the stronger reflections occur where debris-rich ice crops out and the areas of weak or no reflections were associated with relatively clean, massive ice. The layers dip north (i.e. in an up-ice direction) at angles up to 40˚ at 70 m in the profile and decrease away from the ice shelf to reach slopes of ~15˚ in the southern part of the profile (Fig. 5). Many of the stronger reflectors are concave and increase in steepness toward the moraine surface. Numerous reflectors are discontinuous and folded (e.g. 10 m depth at 75 m).
50 MHz GPR profile surveyed over the ice-cored moraine closest to the edge of the ice shelf (site 4, Fig. 1). (a) Raw data showing strong diffractions from the surface and the tide crack. (b) Migration of the data has collapsed many of the surface diffractions but has destructively interfered with some of the reflections. The near-surface synform structures from 0 to 40m are an artefact produced by migration of the part of the profile where there were no reflections. The predominant structure is a northward-dipping layering which can be traced through to the surface of the moraine. Between 160 and 200m numerous small synform, antiform and cut-off structures are interpreted as the product of compression-induced ductile deformation and thrusting.

50 MHz GPR profile surveyed over a low-relief ice-cored moraine 100m south of the line shown in Figure 5. (a) Raw data showing numerous strong diffractions from the surface and possibly from truncated debris layers. (b) Migration of the data has collapsed many of the diffractions. This profile shows reflections that have a low dip, are frequently truncated and are gently folded. The profile is located at site 4 in Figure 1.

100MHz GPR profile located 200 m east of the profile shown in Figure 5. The unmigrated data contain numerous diffractions (dashed lines) that do not conceal the main reflections, which are predominantly linear and intersect the surface of the moraine obliquely. The greater resolution of the 100MHz data shows the debris layers are clustered and very closely spaced, which is consistent with outcrops of the marine organisms layers at the surface of the moraine (Fig. 4). The profile is located at site 4 in Figure 1.

A radar profile of a low ridge 100m south of the one described above records internal structures that have a much lower dip (0–5˚; Fig. 6). These data record numerous crosscutting structures and low-amplitude folds that rest above a strong, near-horizontal reflector at 12 m depth that extends for >40 m.
A third radar profile surveyed with 100 MHz antennas 200 m to the east of the radar data shown in Figure 5 crossed the open tide crack at 10m in the profile and a low-lying accumulation of gravel (Fig. 7). Diffractions from the near-vertical tide crack are visible on the southern side of the diagram at 68 m, and numerous diffraction tails caused by surface cavities and cryoconite holes occur along the surface of the radargram. From 4 to 35 m there are no radar reflectors above the main group of reflections that intersect the surface at 55 m. Several of these diffractions destructively interfere with the GPR signal from the layers although the main reflectors are very strong and have the same geometry as the other radar data, i.e. they dip northwards toward the ice shelf at an angle of 30˚. Surface excavations at the intersection of the reflectors with the moraine surface at 58m show that the strongest reflectors are associated with strongly layered debris-bearing ice (Fig. 7).
Two impediments to the interpretation of the radar data are the use of an average velocity to calculate two-way travel time and the migration of the data to remove diffractions. As described in Section 2, the use of an average velocity of 0.14mns–1 to calculate the depth axis of the radargrams introduces some geometrical distortion. In addition, migration of the data when the velocity varies in two dimensions resulted in some destructive interference with the structures that we were trying to map. Despite this problem, the strength, position and geometry of the main reflections that dip north, towards the ice shelf, remain stable despite migration of the data. The stability of these reflections together with the presence of debris-rich ice where they intersect the surface of the moraine suggests that they are the basal layers of the ice shelf into which debris has been entrained as it has grounded and flowed onto land. The strong reflections are consistent with debris contained within the ice because variations in liquid water content related to ions sorbed onto particle surfaces (Reference Souchez and LorrainSouchez and Lorrain, 1991). The truncated nature of the reflections, together with the variable dip, isoclinal folds, synforms and antiforms, suggests that the ice has experienced compression and shortening. Such shortening suggests compression of the layers that has resulted in warping and possibly thrusting of the debris-bearing ice. Both these ductile and brittle styles of deformation are consistent with grounding of the ice shelf against Minna Bluff.
4. Ice Composition
Ice samples from the outer part of the ice shelf (sites 1 and 2, Fig. 1) have low solute concentrations (Table 1). By contrast, solute concentrations in ice close to shore and from the ice-cored moraine (sites 3 and 4, Fig. 1) are high (maximum electrical conductivity of 570 ms cm–1), albeit two orders of magnitude less than the concentration of modern-day sea water. Bromide was absent or below detection limits for most locations, but was measured at site 3 (2.7 μm), and occurs at a ratio to chloride of 0.002, which is consistent with the Br : Cl ratio in sea water (Table 1). The ratios of Na :Cl and Ca : Cl in sea water are 0.86 and 0.02 respectively, and the solute data from site 3 are consistent with an origin of sea water based on these ratios, albeit considerably diluted. The ionic concentration of accreted marine ice at the base of ice shelves has been shown to be substantially less than that of sea water, with values reported between 40 and 200 μScm–1 (e.g. Reference OerterOerter and others, 1992; Reference Tison, Lorrain, Bouzette, Dini, Bondesan, Stiévenard and JeffriesTison and others, 1998; Reference CravenCraven and others, 2004), which is consistent with our observations. Reference Tison, Ronveaux and LorrainTison and others (1993) contended that marine accreted ice with a salinity 1/30 the concentration of sea water may have been attributable to the evolution of ice crystals resulting in salt ejection. The rate of salt ejection is highly variable and is dependent on freezing rate and gravity-driven convection of brine away from the freezing front (Reference Killawee, Fairchild, Tison, Janssens and LorrainKillawee and others, 1998), so conditions of very slow freezing are most conducive to salt ejection beneath the ice shelf (e.g. Reference OerterOerter and others, 1992). Alternatively, the combination of enriched δ18O and low salinity has been interpreted by other authors as mixing of sea water with meteoric-origin water (e.g. Reference OerterOerter and others, 1992; Reference Tison, Lorrain, Bouzette, Dini, Bondesan, Stiévenard and JeffriesTison and others, 1998), or by a frazil-ice compaction mechanism (e.g. Reference Tison, Khazendar and RoulinTison and others, 2001). Given that only short ice cores were examined and the high variability in salt concentration with depth (226– 568 ms cm–1), it is also possible that desalination of the ice has occurred over time, or that greater salinity of the ice may be observed with depth.
Median solute composition (μM), electrical conductivity (EC; μScm–1), selected ionic ratios and the stable-isotope composition for each of the four sample locations. n.d. indicates that Br was not detected or below detection limits of the analytical method. Twenty-five samples were analysed for solute composition (site 1: n = 5; site 2: n = 7; site 3: n = 7; site 4: n=6). For locations see Figure 1

The measured solutes from the moraines (site 4) are most similar to those of site 3, but with elevated amounts of base cations, which may record chemical weathering processes imparted from the sediments contained in the ice, and nutrients (NO3 – and PO4 3–) associated with biological processes. The ionic concentration is relatively high compared to meteoric ice, and is likely a mixture of marine and meteoric-origin ice.
Mann–Whitney tests were used to determine that the δD and δ18O values from sites 1 and 2 are statistically indistinguishable; sites 3 and 4 are distinguishable from each other and from sites 1 and 2 (p-values <0.05). The average values for the ice from site 3 (δD –257.1%and δ18O 2.3%) fall within the range of δ18O values measured by Reference Kellogg, Kellogg and StuiverKellogg and others (1991a) on the McMurdo Ice Shelf (δ18O 0.0–3.0%). These authors noted a slight enrichment compared with sea water, which they interpreted as the product of slight fractionation during freezing. Reference Kellogg, Kellogg and StuiverKellogg and others (1991a) also measured 24 samples with δ18O values between 0.0 and –25.0%, which they interpreted as the result of mixing of local precipitation and frozen sea water. Although values from the ice-cored moraines (site 4) fall within this range (Table 2), our interpretation, based on coisotopic modelling described below, is quite different.
Average stable-isotope composition and deuterium excess (Dx) for each of the four sample locations. Standard deviations are reported in parentheses. For locations see Figure 1

Linear regression of the δD/δ18O values from all sites results in the equation δD = 7.82 ±0.10δ18O– 0.82 (r 2 = 0.98, n = 36); however, linear regression of the δD/ δ18O values from sites 1 and 2 results in the equation δD= 7.56±0.10δ18O– 8.97 (r 2 = 0.98, n = 18), which is interpreted as the local meteoric waterline and consistent with other reported meteoric waterlines for Antarctic ice. This slope is lower than the global meteoric waterline of 8.17 (Reference Rozanski, Araguás-Araguás, Gonfiantini, Swart, Lohmann, McKenzie and SavinRozanski and others, 1993), probably because of the localized effects of surface evaporation and partial melt by insolation associated with the low altitude of ice-shelf surface (Reference StewartStewart, 1975). Following Reference Jouzel and SouchezJouzel and Souchez (1982) and Reference Souchez and JouzelSouchez and Jouzel (1984), a ‘freezing slope’ in an open system is calculated to derive the isotopic signature produced by freezing water using

where δ i D and δ18 i O is the isotopic composition of the parent water, and α and β are the values of the ice–water equilibrium fractionation coefficients taken as 1.0212 and 1.00291 for δD and δ18O respectively (Reference Lehmann and SiegenthalerLehmann and Siegenthaler, 1991). Taking an initial value SMOW = δ18O 0.0% and δD 0.0%, the modelled freezing slope has a value of 7.45, which is indistinguishable from the slope of the local meteoric waterline. Sea water from McMurdo Sound is slightly depleted in heavy isotopes relative to SMOW due to the effect of mixing meteoric melt and runoff from the Antarctic ice sheets. Measurements of the δ18O composition of sea water vary seasonally and with the density of ocean currents (e.g. Reference LeonardLeonard and others, 2011); however, the range of δ18O across both surface and deep-water currents in the Ross Sea region falls between –0.05%and –0.67%(Reference LeonardLeonard and others, 2011). In a situation where the water reservoir is more than an order of magnitude greater than the thickness of the ice formed, the bulk of the reservoir will remain equal to δ i D and δ i 18O, and the ice formed is no longer described by a Rayleigh-type distribution, but instead approximates a steady-state isotopic value in the ice that is dependent on the freezing rate (Reference Souchez and LorrainSouchez and Lorrain, 1991). Thus, in an ocean reservoir beneath an ice shelf, the accreted marine ice will have an isotopic composition that is enriched, relative to δ i D and δ i 18O, and enriched relative to SMOW.
Plots of the isotopic data on a δD–δ18O diagram (Fig. 8) are more revealing and emphasize that three families of ice are present: meteoric-origin ice (sites 1 and 2); ice from the ice-cored moraine (site 4), which is depleted in 2H and 18O; and marine ice (site 3), which is even more depleted in 2H and 18O (Fig. 8). In order to understand the distribution of isotopic values located in the marine ice zone of the ice shelf, a modified Rayleigh-based distillation model to describe the isotopic fractionation from liquid to solid in a closed system from Reference Jouzel and SouchezJouzel and Souchez (1982) was employed:

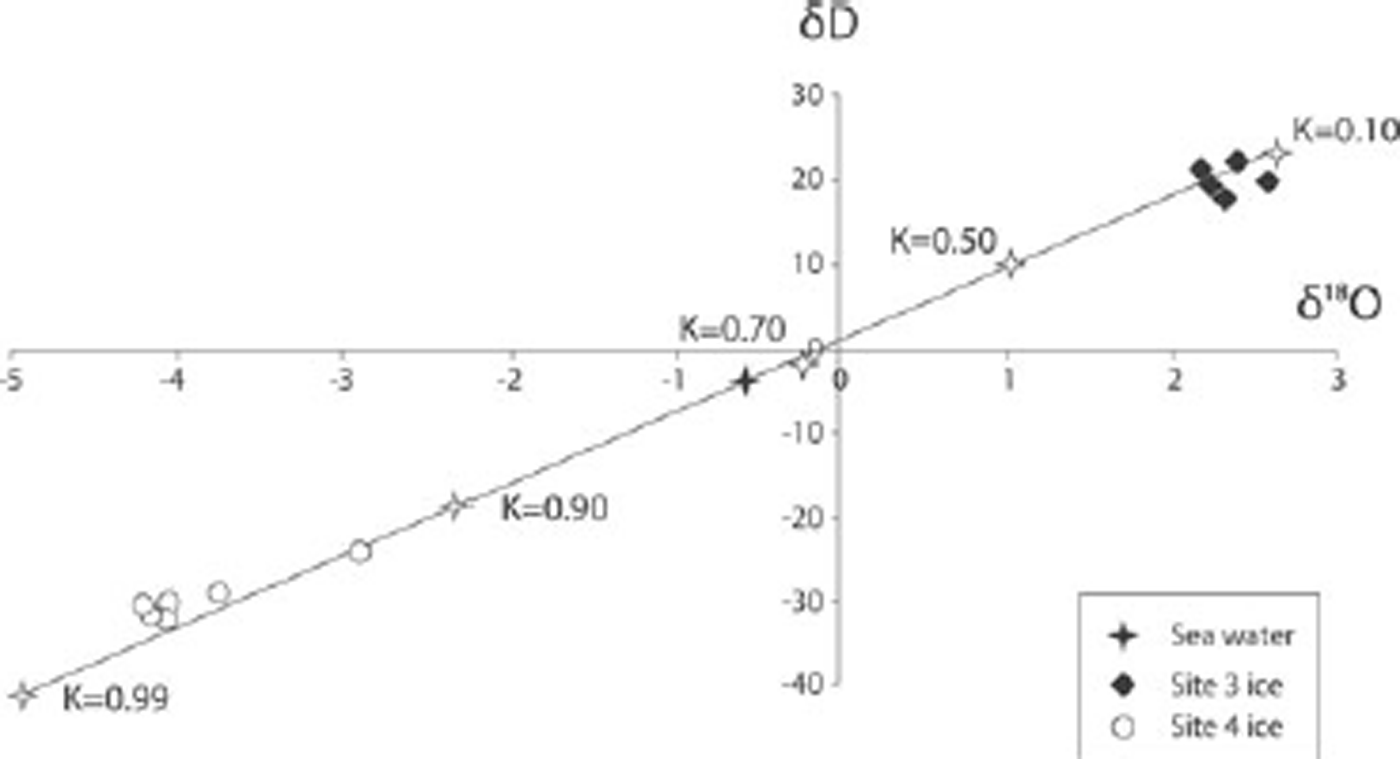
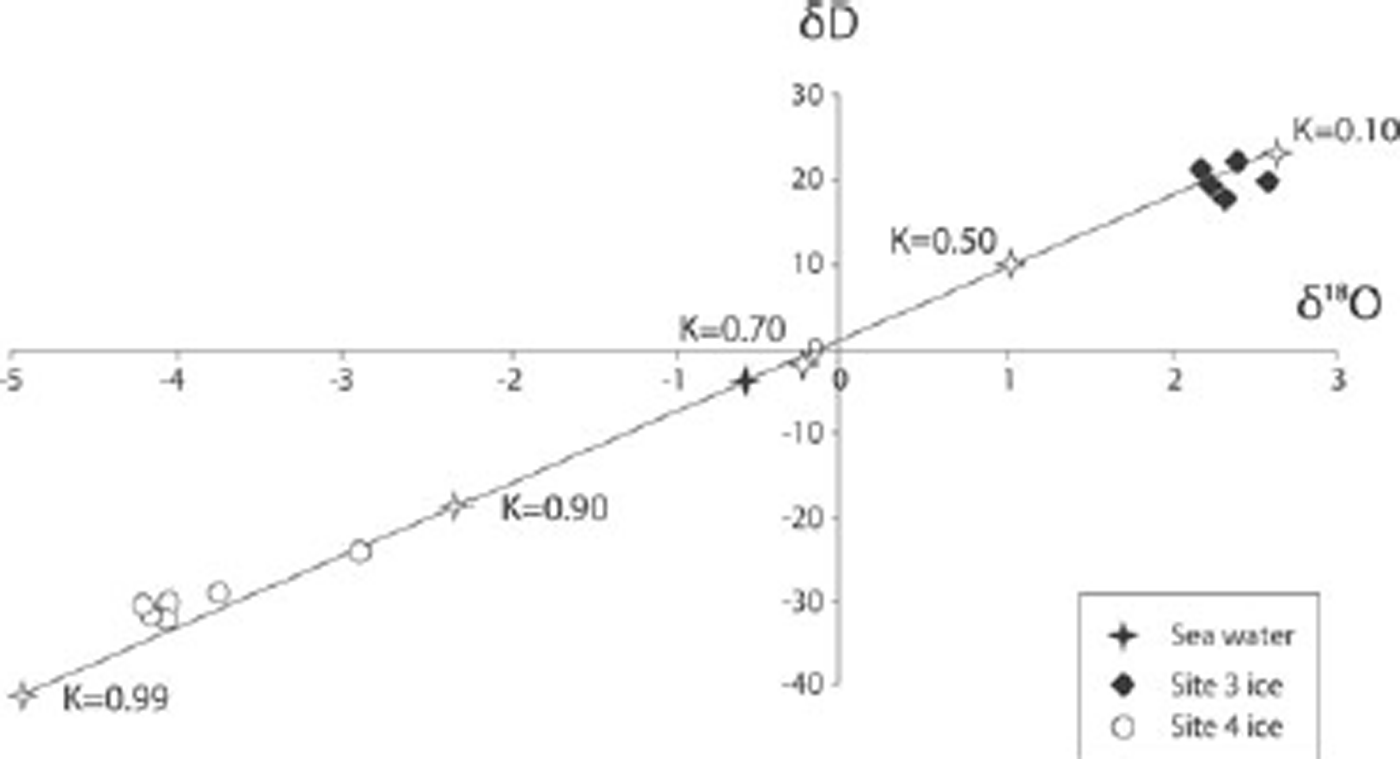
where δs is the composition for δ18O or δD of the solid phase near the liquid/solid interface and K is the frozen fraction. Using an initial isotopic value of δ18O= –0.7% for local oceanic isotopic composition for McMurdo Sound (Reference Jacobs, Fairbanks, Horibe and JacobsJacobs and others, 1985; Reference LeonardLeonard and others, 2011), successive frozen fractions have been calculated (Fig. 9). The initial freezing fraction (10% or K = 0.1) will form ice with an isotopic composition of δ18O= 2.35%, which is significantly enriched in heavy isotopes compared with the parent oceanic water. Thereafter successive frozen fractions are progressively depleted in both δ18O and δD.
Co-isotopic plot for each field site. The local meteoric waterline (dashed line) is determined from samples from sites 1 and 2 and has a slope of 7.56. The theoretical freezing slope (solid line) is also shown. Locations of the sites are shown in Figure 1.

Plotting the co-isotopic depletion during freezing, together with the data from site 3, shows that the marine ice is likely to have been formed as the product of freezing from a sea-water reservoir (K = 0.1–0.2). The co-isotopic plot indicates that the samples from site 4 plot near the freezing slope (Fig. 9), suggesting that the ice may have formed when the freezing was almost complete (i.e. K > 0.9). An alternative explanation of the origin of the ice from site 4 could be the mixing of meteoric-origin meltwater and sea water, which would require the reservoir to contain ~20% meteoric water by volume. Such mixing could be possible in a subglacial ice-shelf system with limited influx and exchange with the ocean, which supports our premise of a closed (or limited-mixing) system; but is unlikely in an open system, due to isotopic mixing with an effectively unlimited 16O ocean reservoir. In light of the isotopic evidence and other indicators, we suggest that the most likely interpretation for the isotopic signature for site 4 is that of a closed-system freezing model, although we cannot discount mixing of meteoric- and marine-origin water, particularly in light of the low ionic concentrations measured at site 3.
5. Ice Formation and Debris Entrainment
The structure and composition data suggest there are two distinct marine ice facies represented at the sampling sites: facies A is marine ice that is exposed at the edge of the ice shelf (site 3, Fig. 1) and consists of ice with low debris concentrations that contains well-preserved, delicate marine fossils; and facies B, which rests landward of the epishelf lakes (site 4, Fig. 1) and consists of ice with high debris concentrations. The well-preserved nature of delicate fossils such as Adamussium colbecki valves in facies A suggests that the ice has not undergone significant mechanical deformation during or after entrainment. The lack of evidence of mechanical deformation, together with low debris concentrations, solute concentrations and co-isotopic data consistent with the early stages of freezing of a water reservoir, is interpreted as evidence of a selective entrainment mechanism associated with freezing of sea water. Under an ice shelf the most likely scenario to explain the data is formation of frazil ice on the seabed, ice-rafting of sea-floor detritus by anchor ice, and incorporation of the ice into the bottom of the ice shelf. In McMurdo Sound such anchor ice is known to form at depths up to 33 m below sea ice and is responsible for carrying pieces of the sea floor up to 25 kg in weight into the overlying ice (Reference Dayton, Robilliard and DeVriesDayton and others, 1969). The formation of anchor ice and ice-rafting associated with growing anchor ice is also a well-known agent of disturbance of benthic communities (Reference BarnesBarnes, 1999). Once entrained into the bottom of ice shelves the entrained particles can progress to the ice-shelf surface by ablation, which is consistent with negative surface mass-balance measurements (Reference CliffordClifford, 2005).
Facies B, which occurs landward of the epishelf lakes, consists of debris-bearing and clean ice layers with much higher average debris volumes than facies A. The fragmentary nature of marine fossils, together with GPR profiles that record folds and truncations, suggests that the ice has experienced considerable mechanical deformation. In contrast to the early-freezing interpretation for facies A, the coisotopic data from facies B suggest the ice was formed from a water reservoir that experienced nearly complete freezing, or a water reservoir containing a substantial portion (~20%) of meteoric meltwater and with little or no mixing with an open ocean (effectively a closed or limited system). Near-complete freezing, or a closed reservoir, together with the entrainment of significant volumes of sediment (Fig. 3), suggests freezing may have occurred at or close to the seabed. This interpretation is broadly consistent with the freezing model proposed by Reference DebenhamDebenham (1920), which is widely quoted in studies of debris entrainment in ice shelves (Reference Gow and EpsteinGow and Epstein, 1972; Reference Lyons and MielkeLyons and Mielke, 1973; Reference Sugden and ClappertonSugden and Clapperton, 1981; Reference BaroniBaroni, 1990). In the case of the southern McMurdo Ice Shelf, the southern edge is flowing obliquely toward Minna Bluff (Fig. 1), a situation in which the sea-water reservoir beneath the ice shelf will progressively close as the ice shelf approaches the land. These conditions favour entrainment of the marine sediment and transportation of both onto land where ice-cored moraines have formed. The interpretations described above suggest that the two marine ice facies identified have two different origins: accumulation of anchor ice and rafting of glaciomarine sediment into the ice shelf, and possible basal freezing associated with ice-shelf grounding. If the freezing and entrainment of the large volumes of debris occurred in a closed or limited-mixing system the question that arises is, where is the 90% of the ice that formed in the early stages of freezing? This is uncertain, but there is a strong possibility that this ice has been removed by ablation which has also exposed and concentrated the basal debris along the ice edge to form the ice ridges.
The moraines that form at the edge of the southern McMurdo Ice Shelf have formed by accretion of ice, entrainment of glaciomarine sediment and transportation of the ice and sediment onto land where the debris has concentrated during ablation. Deformation during transportation has resulted in abrasion and faceting of clasts and the comminution of marine fossils. Explanation of the multiple ridges remains uncertain, but one possibility is that they represent episodes of grounding at the ice edge in which high debris loads are entrained during grounding events and relatively clean ice forming when the margin is floating.
6. Conclusion
Two distinctly different types of debris-bearing marine ice occur at the margin of the McMurdo Ice Shelf:
-
1. Ice with well-preserved marine macrofossils, low volumes of inorganic sediment, and solute concentrations more than an order of magnitude greater than meteoric ice. Co-isotopic analysis of this ice is consistent with the open-system freezing of sea water. Such a situation is consistent with the formation of anchor ice that has formed on fossils on the sea floor, which have been rafted to the bottom of the ice shelf where the ice and debris has been entrained.
-
2. Ice with abundant inorganic debris, and crushed marine macrofossils in ice-cored moraines. Although we cannot discount the possibility that meltwater from the ice shelf has been refrozen to the ice shelf, isotopic modelling of the freezing process is consistent with ice formation in nearly complete freezing of a sea-water reservoir, which is most likely associated with grounding of the ice shelf or bottom freezing in shallow water.
Well-defined reflections in the GPR survey of the ice-cored moraines together with multiple debris bands cropping out on moraine surfaces are consistent with repeated complete freezing of a water reservoir. Such freezing would produce layers differentiated by solute concentrations resulting in strong differences in velocity and attenuation, a situation that favours strong linear radar reflections.
The ice-shelf moraines have formed as marine debris has been entrained into the bottom of the ice shelf by freezing. Subsequently the debris has been transported onto land where surface ablation has resulted in concentration of debris where the debris-rich layers crop out parallel to the ice edge.
Acknowledgements
Fieldwork was financially supported by a University of Otago research grant to G.W. and S.F., and laboratory analyses by a research grant to S.F. We thank Emma Davis for field assistance with the GPR survey, and Antarctica New Zealand for excellent logistical support. The comments of two anonymous referees resulted in considerable improvement of the manuscript.