Natural and man-made disasters in the United States increased 60% in the past 2 decades.Reference Vick, Wilson, Fisher and Roseamelia1 Weather-related disasters, including hurricanes, are among events with the capacity for widespread immediate destruction, long-term negative outcomes due to infrastructure damage, and creation of environmental hazards.Reference Vick, Wilson, Fisher and Roseamelia1,Reference Krause and Reeves2 Many of these disasters cause mass casualties requiring immediate medical attention, resulting in local hospital medical surges.Reference Vick, Wilson, Fisher and Roseamelia1 However, community hospitals in storm impact and surrounding areas may not have the resources and staff to accommodate large-scale disasters affecting thousands of persons.Reference Shartar, Moore and Wood3
Hurricane Harvey made landfall in Texas on August 25, 2017, resulting in 88 fatalities and more than US $180 billion in damages.Reference Pines4 In Houston, over 125 cm of rain caused massive flooding, covering nearly one-third of the city and disturbing more than 200 000 homes.Reference Pines4 The flooding exposed affected areas to a toxic mix of chemicals, sewage, biohazards, and over 6 million cubic meters of garbage.Reference Friedrich5 The level of biohazard exposure and injuries from trauma among persons residing in affected areas were widespread and contributed to increases in emergency department (ED) visits in Houston and cities that received people evacuating from the hurricane impact zone.Reference Liu, Morshedi and Miller6
To explore the geographic extent of the medical surge associated with Hurricane Harvey, we assessed ED visit surges in Dallas–Fort Worth (DFW) metroplex EDs before, during, and after the storm period (August 25–September 4, 2017). Specifically, we considered evacuees from 60 Texas counties with disaster declarations who sought care outside of the storm impact zone, many in DFW, approximately 260 miles away. We examined spatial and temporal variation in ED visits to DFW hospitals attributable to the storm. We used the interrupted time series (ITS) analysis to estimate the magnitude and duration of the ED surge and global indicators of spatial autocorrelation to examine spatial clustering. Medical surge capacity is a critical component of community preparedness, with coalition building among hospitals and other health care facilities as an important concern.Reference Vick, Wilson, Fisher and Roseamelia1 The results have implications for public health emergency preparedness and hospital preparedness policy-makers.
METHODS
Data Sources and Measurement
Data were extracted from the Texas Health Services Region 2/3 syndromic surveillance data and associated ESSENCE analytics through the North Texas Syndromic Surveillance System during the period of March 1, 2017–January 06, 2018. The data captured for the North Texas area included all 109 contributing EDs – 55 in the DFW metroplex.7 These secondary data, collected through the aforementioned syndromic surveillance system, were analyzed for this study, with special focus on ED visit data from the patients who resided in the 60 counties with Federal Emergency Management Agency (FEMA) disasters declarations due to Hurricane Harvey.7 Surveillance data were de-identified and exempted from an institutional review board review.
We analyzed visit data of patients presenting at EDs in the DFW area, which may have received evacuees due to the storm. ITS analyses, previously applied by Wilt et al. and Ekperi et al. in 2018, examined the period March 1, 2017–January 6, 2018, defining the event that “interrupted” or perturbed the time series as August 25, 2017, the day that Hurricane Harvey made landfall in Texas.Reference Wilt, Adams and Thomas8,Reference Ekperi, Thomas and LeBlanc9 There were 177 days pre-event and 135 days post-event. Spatio-temporal analyses focused especially on the period surrounding Hurricane Harvey, August 14–September 15, 2017.
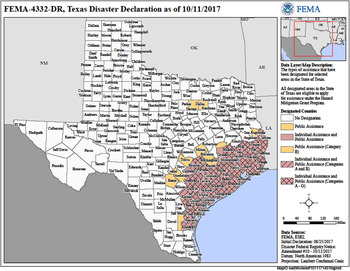
To identify Hurricane Harvey–attributable medical surge, we considered 3 types of visits with increasing specificity: all reported ED visits; evacuee visits, which were visits by patients who reported zip codes indicating residence in any of the 60 counties with disaster declarations due to Hurricane Harvey (evacuee); and Harvey chief complaints (CC) visits, visits where the chief complaint or triage notes mentioned “hurricane,” “Harvey,” “evacuee,” or “evacuate.” In the DFW area, daily counts for all ED visits and evacuee ED visits were examined. It was only possible to examine Harvey CC visit counts for dates after August 25, 2017, the day that Hurricane Harvey made landfall in Texas, because CC could not reference the event prior to that date. Figure 1 displays Texas counties with disaster declarations. Counties shaded in pink had disaster declarations.
Texas County-Level Disaster Declarations (n = 60) Due to Hurricane Harvey, 2017

Statistical Methods
Descriptive statistics of the mean, standard deviation, and range were calculated during 3 periods before (August 14–24, 2017), during (August 25–September 4, 2017), and after (September 5–15, 2017) the storm for all ED visits and evacuee ED visits. Statistical and time series analyses were conducted using SAS v9.3 (SAS Institute, Inc., Cary, NC). Spatial analyses were conducted using GeoDa 1.6.7 (Tempe, AZ) with visualization using ArcMap 10.5 (Redlands, CA).
ITS models of daily ED visit counts in DFW for all and evacuee ED visits were estimated via a maximum likelihood. These models were estimated for the period of March 1, 2017–January 6, 2018, the extended pre-event period allowing improved estimation of seasonal variation in the baseline. The ITS models were specified as linear segmented regressions with autoregressive errors to adjust for seasonal cyclical variation in ED visits.Reference Jandoc, Burden and Mamdani10 The resulting estimated parameters and standard errors were used to produce estimates and associated 95% confidence intervals of the event-attributable number and percentage change in visits at several time points post-event, the total, or cumulative, number of excess visits attributable to the event, including the date at which visits returned to normal or where predicted visits were not significantly different from the counterfactual trend, the predicted level in the absence of the event.Reference Molinari, LeBlanc and Stephens11 We use the term surge to refer to the event-attributable number and percentage change in visits, which is also referred to as excess visits.
For a comparison of results obtained using ITS, the switching detection algorithm (Poisson/Regressions/EWMAFootnote *) was applied in ESSENCEReference Burkom, Elbert and Magruder12 to all and evacuee ED visit counts on August 4 –September 23, 2017 to identify a statistically significant ED surge. A statistically significant medical surge was defined as the statistically significant difference between expected and observed daily visit counts. There were 50 days in each time series with 20 days pre-event (August 4, 2017–August 24, 2017) and 30 days post-event (August 25, 2017–September 23, 2017). However, ESSENCE includes a tuning period of 40 days prior to the start date of a time series to establish the baseline time series seasonal characteristics. We examined the magnitude, duration, and spatial variation of the identified statistically significant medical surge associated with Hurricane Harvey for all ED visits and for evacuee ED visits.
Data from evacuee visits to DFW hospitals during 3, 11-day periods before, during, and after the storm were analyzed for spatial autocorrelation (clustering) using global Moran’s I in GeoDa 1.6.7 (Tempe, AZ) and visualized using ArcMap 10.5 (Redlands, CA). The periods were broken up evenly (into 11-day increments) so that the change in space and volume would be more easily comparable: before the storm (August 14–24, 2017), during the storm (August 25–September 4, 2017), and after the storm (September 5–15, 2017). The maps provided visual information on where within the affected region (defined as counties with disaster declarations, n = 60) higher numbers of evacuated patients came from and which hospitals received the greatest spikes in visits. These maps characterize magnitude, duration, and geographic variation of medical surge associated with Hurricane Harvey. Evacuee visits were analyzed by CC, presenting ED, and patient characteristics.
RESULTS
As seen in Table 1, the means of all visits, evacuee visits, and Harvey CC visits rose during the event and after the event, compared with the time period before the event. The relative increase is most dramatic for evacuee visits during the event, when mean visits rose by over 260%, from 22 to 80 visits per day. All visits displayed a small relative increase during the event of 1.6%, from 7499 to 7615 visits per day, but that increase was magnified after the event to 7.4%, to 8056 per day. Harvey CC averaged 5 visits per day during and after the event, with the variability in visits declining in the after-event period. In addition to an increase in the mean number of visits, the standard deviation increased both during and after the event.
Descriptive Statistics for Daily Emergency Department Visits, Metropolitan Dallas—Fort Worth, TX, August 4, 2017–September 15, 2017

* Event = August 25, 2017, the date that Hurricane Harvey made landfall in Texas.
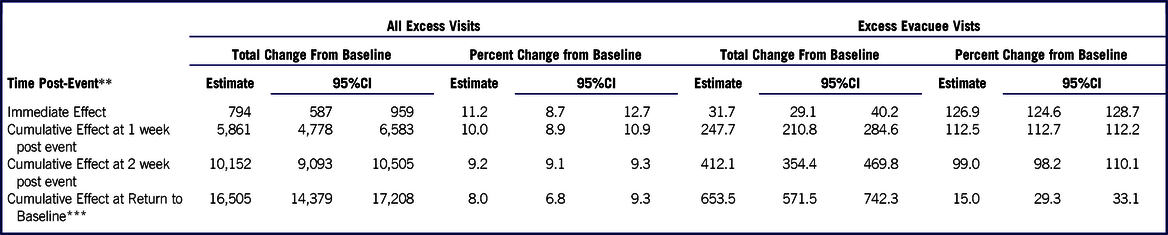
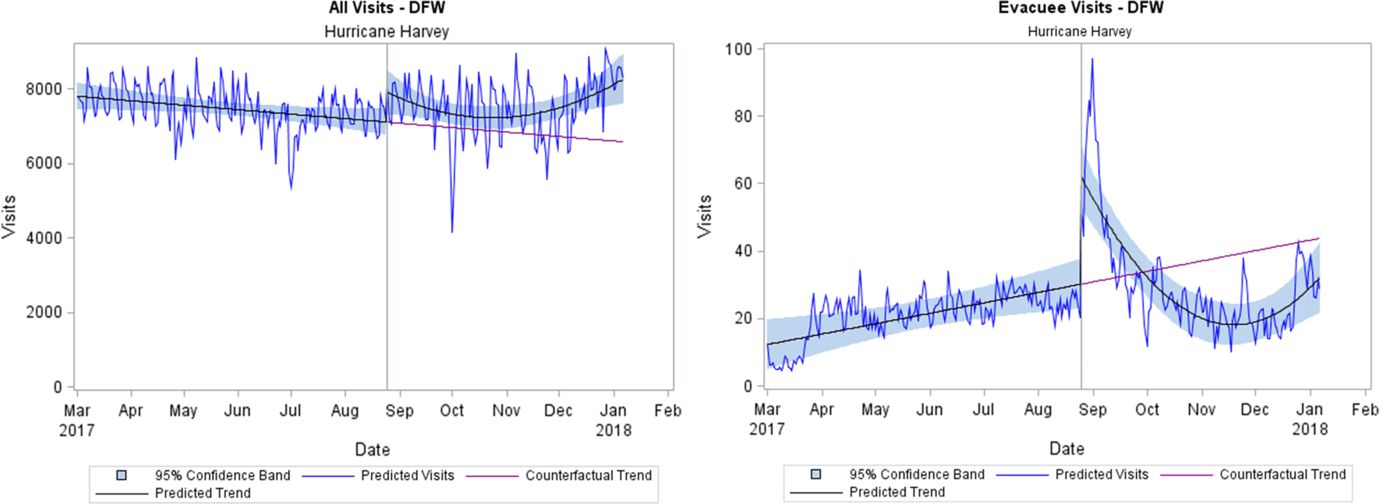
** DFW = Metropolitan Dallas-Fort Worth, Texas.
Table 2 and Figure 2 present results from the ITS analysis that estimated the magnitude and duration of the medical surge in 55 DFW metroplex EDs. The immediate effect of the event on all ED visits was an increase of 11.2% (95% CI: 8.7%, 12.7%), or 794 visits (95% CI: 587, 959), which was significant at P = 0.05. This immediate effect is represented in Figure 2 by the upward shift in the predicted trend of all visits at the Hurricane Harvey reference line. While the predicted trend does not ever cross the counterfactual trend, predicted visits fall below the counterfactual trend on September 21, 2017. At that point, 27 days after the event, estimated surge, or excess visits, attributable to Hurricane Harvey ended, amounting to 16 505 (95% CI: 14 379, 17 208) total visits, or ~611 excess visits per day. This estimated total impact was 6.7% (95% CI: 4.6%, 9.5%) more visits than would have occurred during that 27-day period if Hurricane Harvey had not made landfall in Texas.
Total and Percent Change * in Visits from Hurricane Harvey in Metropolitan Dallas—Fort Worth, TX on Daily Emergency Department Visits, March 1, 2017–January 6, 2018

* Estimated using Interrupted Time Series analysis specified as segmented with autoregressive errors.
** Event = August 25, 2017, the date that Hurricane Harvey made landfall in Texas.
*** All visits returned to baseline by 9/21/2017 and Evacuee visits returned to baseline by 9/29/2017.
Predicted Visits from Interrupted Time Series (ITS) Models of Daily Emergency Department Visits compared to counterfactual trend, Metropolitan Dallas–Fort Worth, TX, March 1 2017–January 6, 2018

Considering only evacuee visits in 55 DFW metroplex EDs, an immediate effect of about 32 visits or 126.9% increase (95% CI: 124.6%, 128.7%) per day was observed on August 25, 2017. This effect is represented in Figure 2 by the gap between the predicted trend and the counterfactual trend at the Hurricane Harvey reference line (August 25, 2017). Note also that predicted visits continued to rise after August 25, peaking on August 31, 2017, at 66 (95% CI: 56, 96) visits or 214% (95% CI: 204%, 365%) above the baseline. The predicted trend crossed the counterfactual trend on September 29, 2017, more than 1 month after the hurricane, indicating the end of the hurricane-attributable surge in evacuee visits. At that point, evacuee visits in DFW due to Hurricane Harvey amounted to 654 (95% CI: 572, 742) or about 15% (95% CI: 29%, 33%), more than would have occurred during that 35-day period in the absence of the event.
For all ED visits, a statistically significant surge, based on the ESSENCE detection algorithm, was observed in CC categories of fever, gastrointestinal illness, rash, and respiratory illness. When considering evacuee visits only, a statistically significant surge was observed in CC categories of traffic-related injuries, fever, gastrointestinal illness, injury, neurologic complaints, rash, and respiratory illness.
Evacuee visits increased across all age groups. Although 40% of “evacuee visits” were from Harris County (Houston) residents, only about 4% of the overall surge were from counties with disaster declarations due to the storm. About 25% of evacuee visits had a CC of gastrointestinal issues with significant increases in nausea-vomiting-diarrhea (NVD), 22% respiratory, and 19% fever. Injury accounted for 14% of visits. The remaining 20% of complaints varied and were categorized as “other.” A majority of evacuees (86%) seeking treatment were discharged from the emergency room, whereas 9% of visits resulted in hospital admission. No deaths were reported among evacuee visits to the DFW hospitals during the period.
There were 259 Harvey CC visits from August 25, 2017–September 28, 2017. About 37% of these visits occurred in patients residing in counties with disaster declarations due to Hurricane Harvey, whereas 34% of visits were among DFW residents. These visits represented patients across all age groups, although 47% occurred in patients ages 18–44 years. Of the 259 visits, 37 (14%) resulted in inpatient admissions, whereas the remainder were treated in the ED and discharged. About 12% of visits were due to injuries, 7.3% for gastrointestinal complaints, 6.5% for respiratory illnesses, and 4% for fever or neurologic complaints. The remaining 69% were categorized as “other” and included requests for medication refills.
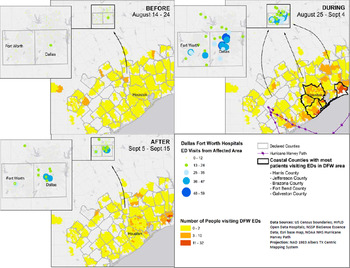
Figure 3 displays evacuee visits that presented at the ED in the DFW area. Results of the global Moran’s I analysis revealed mild to no clustering in the 11-day period before (August 14–24, 2017; Moran’s I = 0.04, P = 0.03) Hurricane Harvey hit and strong clustering in the 11-day period during (August 25–September 4, 2017; Moran’s I = 0.35, P < 0.0001) and after (September 5–15, 2017; Moran’s I = 0.29, P < 0.0001) the event. Further, Figure 3 illustrates that the highest clusters of “evacuee visits” in DFW hospitals from the August 25–September 4, 2017, period were from Harris, Galveston, Jefferson, Brazoria, and Fort Bend counties.
Spatial Analysis of Surge in Evacuees Presenting for Care at Emergency Departments in the Dallas-Fort Worth Area Before (August 14–24, 2017), During (August 25–September 4, 2017), and After (September 5–15, 2017) Hurricane Harvey.

Prior to the storm, there was a low number of visits in DFW among patients from the Houston area. There was a strong and significant increase in visits due to evacuees during the storm impact period. While most hospitals in the area experienced a significant surge in ED visits, at least 10 hospitals experienced a 600% increase (2 experienced > 1000% surge) in ED visits from patients seeking care in DFW from counties in the affected area. The number of evacuee patient visits in DFW decreased in the 11-day period post-storm; however, the ED visit rate was still elevated.
DISCUSSION
Although the DFW metroplex is approximately 260 miles from the major hurricane impact zone, which included Harris County (Houston) and surrounding counties, this study uncovered an ED medical surge possibly attributable to Hurricane Harvey, exceeding 16 500 visits in the 27 days following the storm. Notably, patients with zip codes from counties declaring storm emergencies accounted for only 4% of the estimated 16 500 visit total ED surge attributed to Hurricane Harvey in this study. Neither patient zip codes nor CCs were sufficiently sensitive for identifying storm-attributable ED surge and CCs were clearly the inferior method. We therefore recommend using all ED visits to estimate ED medical surge need due to hurricanes.
In addition, the spatial analysis revealed 5 counties bordering Harris County (Houston) that contributed significantly more patients than expected from those seeking care outside the storm-affected region. Thus, persons evacuating a disaster zone may seek medical care at hospitals far outside the disaster zone, in this case, 260 miles outside of the disaster zone. This study suggests that people able to evacuate may seek care in hospitals far outside disaster impact areas and outside their communities of origin. Some evacuees may also be residents from non-impacted communities who may have been in the disaster area but were able to return to their home communities for treatment due to lack of hospital access or capacity in the disaster zones. Alternatively, some patients who resided outside of the hurricane zone who would normally seek care in Houston for perceived improved medical care access may have opted to seek care in Dallas to avoid the hurricane and its aftermath. Thus, a multilayered ripple effect could result in medical surges in surrounding areas of impact zones as individuals make choices to seek optimal health care.
Strengths/Limitations
ITS analysis is a robust modeling technique, the strongest quasi-experimental method for evaluating longitudinal effects of an event.Reference Wagner, Soumerai, Zhang and Ross-Degnan13 Our use of segmented regression with autoregressive errors provides a powerful method for estimating the impact of the event while adjusting for seasonality and secular events.Reference Zhang, Wagner, Soumerai and Ross-Degnan14 ITS statistical methods address autocorrelation and seasonality, such as the day of the week and month of the year variation, via autoregressive errors. The main threat to validity using time series methods is the potential for confounding effects due to a co-occurring or secular event. Co-occurring events might confound the effect detected, especially in overall ED visits.
In order to better evaluate longitudinal and seasonality effects, we compared our results using ITS to those obtained with the switching detection algorithm (Poisson/Regressions/EWMA) in ESSENCE, which is designed to be conservative. This detection algorithm, which uses a 40-day tuning period, does not adjust for longer ranged seasonality not observed in the tuning period and may therefore adjust too quickly to perturbing events.Reference Burkom, Elbert and Magruder12 The resulting estimates of event-attributable surge magnitude and duration may therefore be biased downward. However, while ITS surge estimates reflect the difference in predicted and counterfactual visit trends, the switching detection algorithm surge estimates reflect the difference between actual and expected visits. This will typically result in a larger surge estimate. The duration of the surge estimated by the switching detection algorithm will be shorter than that estimated by ITS because the algorithm adjusts much more quickly to perturbing events.
Co-occurring events, like Labor Day weekend (August 31–September 2, 2017) in the instance of Hurricane Harvey or a co-occurring infectious disease epidemic, might confound the effect detected, especially in overall ED visits. Other than the Labor Day holiday weekend, the authors were not aware of any event that occurred in the DFW metro area at or near the time of Hurricane Harvey that could have affected the number of ED visits observed. There was no indication that the population of DFW changed significantly during the study period. We did test the effect of the Labor Day holiday weekend by including it as a segment in the segmented regression for all visits. The parameter estimate for the holiday weekend was not significant (P = 0.39), whereas the parameter estimate for the event remained sufficiently significant at P = 0.09 to affect the overall model.
We were able to place residence at the zip code level only; thus, some spatial patterns that aggregated to a larger scale may be masked (see Figure 3). Additionally, this study does not explore the underlying reasons as to why 40% of the total evacuations came from Harris County while residents from 60 counties evacuated. Understanding the demographics and exploring the social vulnerability and preparedness planning factors that led to Harris Country having the most patient visits in DFW are crucial next steps. Accounting for other emergency medical services available to evacuees would also illustrate the impact on DFW hospitals compared to the overall health care system.
Public Health Implications
Community disaster preparedness efforts should be coordinated across geographical boundaries to account for population mobility during an event. Health care coalitions within driving distance from major disasters are encouraged to coordinate preparedness plans in advance of emergencies to best prepare for the need of a potential medical surge capacity. Health care services to evacuee groups are likely to extend past the boundaries of the initial emergency event. This study highlights the utility of syndromic surveillance data and spatial and temporal methods for conducting timely analyses and detecting medical surge ED visits associated with disasters of a similar nature. Future studies may consider the impact of social, demographic, environmental, and preparedness-related factors that might contribute to medical surges occurring in areas distant from a disaster zone, but accessible to populations in surrounding areas. Going forward and applying theories of behavioral economics to medical surge analyses, as well as in other public health preparedness science research, may serve to shed light on exploration of the decision processes that people and populations use when seeking care or shelter. Behavioral economics theories emphasize that individual decisions are not always based on rational choices.Reference Bickel, Moody and Higgins15 In the context of an emergency situation, many social and psychological variables may factor into decisions regarding where to seek care, and indeed whether or not to evacuate. Our analyses call for deeper probes to understand driving forces behind disaster event-driven medical surges.
Conflict of Interest Statement
The authors have no conflicts of interest to declare.
Disclaimer
The findings and conclusions in this study are those of the authors and do not necessarily represent the official position of the CDC.