





1. Introduction
Radio sources show variability on timescales spanning orders of magnitude, from nanosecond bursts from the Crab pulsar (Hankins et al. Reference Hankins, Kern, Weatherall and Eilek2003) through to the slow evolution of radio supernova over months to years (Weiler et al. Reference Weiler, Panagia, Montes and Sramek2002). However, the timescales of seconds to hours have been relatively unexplored by untargeted surveys (Murphy & Kaplan Reference Murphy and Kaplan2026). This variability is too slow to be detectable with traditional single-dish techniques, but too fast to be detectable with the typical search cadences of traditional imaging surveys.
In the past decade there have been a small number of projects that have conducted imaging transient searches on timescales of order 10 s. These early attempts were mainly at low frequencies (tens of MHz) with low angular resolution and poor sensitivity
 $\sim$
tens of Jy (e.g. Lazio et al. Reference Lazio2010; Obenberger et al. Reference Obenberger2015).
The advent of high-sensitivity, well-sampled (in the u-v plane), widefield radio surveys has opened up this domain for exploration, and early searches have revealed a range of phenomena. Perhaps most notable are long period transients (LPTs; e.g. Hurley-Walker et al. Reference Hurley-Walker2022, Reference Hurley-Walker2023; Caleb et al. Reference Caleb2024) and slow pulsars (e.g. Caleb et al. Reference Caleb2022; Wang et al. Reference Wang2025a), two emerging, and related classes. LPTs are sources that show short, powerful bursts of radio emission, that are periodic and often highly polarised. There have been
 $\sim$
14 detected to date,Footnote
a
exhibiting a wide range of observed properties, with periods ranging from minutes to hours, and long-term on-and-off activity windows (e.g. Hurley-Walker et al. Reference Hurley-Walker2022, Reference Hurley-Walker2023, Reference Hurley-Walker2024; Caleb et al. Reference Caleb2024; Dong et al. Reference Dong2025; Wang et al. Reference Wang2025b; Lee et al. Reference Lee2025). In addition to these new classes of sources, searches of these timescales also reveal rapidly scintillating active galactic nuclei, some of which have been observed in geometric alignment (Wang et al. Reference Wang2021), eclipsing pulsars (Zic et al. Reference Zic2024; Petrou et al. Reference Petrou2026), and many types of radio stars (e.g. Driessen et al. Reference Driessen2024).
Motivated by these results, and the prospect of serendipitous discoveries, there have been a number of searches for short-timescale variability. While low-frequency instruments continue to play an important role in exploring this regime (e.g. de Ruiter et al. Reference de Ruiter2024; Horváth et al. Reference Horváth, Hurley-Walker, McSweeney, Galvin and Morgan2025), short-timescale searches have increasingly been extended to mid-frequency (
 $\sim$
GHz) facilities such as ASKAP and MeerKAT. On MeerKAT, Fijma et al. (Reference Fijma2024) searched for variability on 8 s, 128 s, and 1 h timescales in the field of NGC 5068, but found no transient candidates. On ASKAP, Wang et al. (Reference Wang2021) and (Reference Wang2023) performed transient searches on a timescale of 15 min, and detected a number of extreme scintillating galaxies, pulsars, and stellar flares. More recently, Lee et al. (Reference Lee2026) performed a search on a timescale of 10 s in ASKAP Galactic-plane fields targeting LPTs; while no new LPTs were discovered, several flaring stars were detected. For all of these projects, the short timescale imaging and transient detection was run in offline batch mode. This limits the opportunity for rapid follow-up of the transients detected, which is particularly important for source classes that can become quiescent rapidly.
ASKAP (Hotan et al. Reference Hotan2021) can search for millisecond transients, such as fast radio bursts, in real time using the Commensal Real-time ASKAP Fast Transients (CRAFT) backend, which operates on time-domain data at
 $\sim$
1 ms resolution, incoherently adding intensities from individual antennas (Macquart et al. Reference Macquart2010; Shannon et al. Reference Shannon2025). The recent CRAFT coherent upgrade (CRACO) extends this capability and operates on timescales between
 $\sim$
110 ms and 3 ms, using the correlated visibility data to generate a series of de-dispersed images of the mean-subtracted residual sky (Wang et al. Reference Wang2025c). While these systems have been highly successful in rapidly detecting millisecond-timescale transients (e.g. Shannon et al. Reference Shannon2025), a real-time fast-imaging system operating on standard image-domain data is crucial for studying slower variability (seconds to hours) in a timely manner.
A fast imaging pipeline has recently been developed for MeerKAT. TRON (Transient Radio Observations for Newbies) images MeerKAT data at the raw correlator dump rate (e.g. 2 s, 4 s, or 8 s, depending on the observing mode), and searches for radio transients on these or longer timescales using a tunable parameter (Smirnov et al. Reference Smirnov2025a). Searches of archival MeerKAT data with TRON have resulted in the detection of millisecond pulsars (Smirnov et al. Reference Smirnov2025a) and a stellar flare (Smirnov et al. Reference Smirnov2025b). At the time of writing, work is underway to get TRON running routinely on MeerKAT observations (I. Heywood, private communication).
The ASKAP Survey for Variables and Slow Transients (VAST; Murphy et al. Reference Murphy2013) is one of the key ASKAP Survey Science Projects.Footnote
b
VAST began its pilot survey in 2019 (Murphy et al. Reference Murphy2021) and its full survey in 2022 (de Ruiter et al. Reference de Ruiter2026). The VAST transient pipeline (Pintaldi et al. Reference Pintaldi, Stewart, O’Brien, Kaplan, Murphy, Ruiz, Pierfedereci and Teuben2022) is designed to identify radio variables and transients from the VAST surveys by associating sources across multiple epochs, with typical observing cadences ranging from days to months (de Ruiter et al. Reference de Ruiter2026). The VAST team is able to perform time-domain analysis commensally on other ASKAP Survey Science Projects. In contrast to the short, multi-epoch VAST observations, these surveys are typically longer (
 $\gtrsim$
a few hours) with limited or no repeat epochs, making them ideal for exploring faster, intra-observation transients.
In this paper, we describe the ‘VASTER’Footnote c real-time fast imaging pipeline. VASTER is primarily developed for long observations to identify intra-observation transients on timescales from seconds to hours. Wang et al. (Reference Wang2021) demonstrated the prototype and concept of VASTER, while Wang et al. (Reference Wang2023) described the workflow and technical details, and demonstrated its offline performance with ASKAP pilot surveys. As an extension of the previous work, VASTER was officially deployed on ASKAP in July 2025 and has been running as part of the standard ASKAP data processing workflow since then, imaging long observations on timescales of 15 min. Transient candidates are made available to users even before the standard imaging data products are made available, making it the first such system to be routinely doing image-plane transient detection in real time.
In Section 2 we describe the VASTER system and transient detection algorithm. In Section 3 we describe how VASTER operates commensally on the ASKAP surveys. In Section 4 we present the results from the first two weeks of VASTER operations, including the discovery of two LPTs, along with a host of other transients. Finally, in Section 5 we discuss our results and summarise our future plans for VASTER.
2. VASTER system description
ASKAP consists of 36 fully steerable 12 m dishes operating at radio frequencies of 700–1 800 MHz with instantaneous correlated bandwidths of 288 MHz and maximum baselines of 6 km (Johnston et al. Reference Johnston2007; Hotan et al. Reference Hotan2021). The wide bandwidths, together with the number of antennas and their layout provides excellent instantaneous (u, v) coverage, enabling high-quality snapshot imaging. Each antenna is equipped with a Phased Array Feed at its focal plane, elements of which are electronically combined to form 36 dual-polarised beams, providing a large instantaneous field of view. These specifications make ASKAP well-suited to discovering and localising transient and variable sources on sub-hour timescales.
This short-timescale ‘fast imaging’ capability has been demonstrated in previous work (e.g. Wang et al. Reference Wang2021; Rigney et al. Reference Rigney2022; Wang et al. Reference Wang2023; Dobie et al. Reference Dobie2023; Lee et al. Reference Lee2026), but has been limited to dedicated offline processing of specific datasets available on the ASKAP archive, leading to substantial latency in transient discovery and preventing timely follow-up.
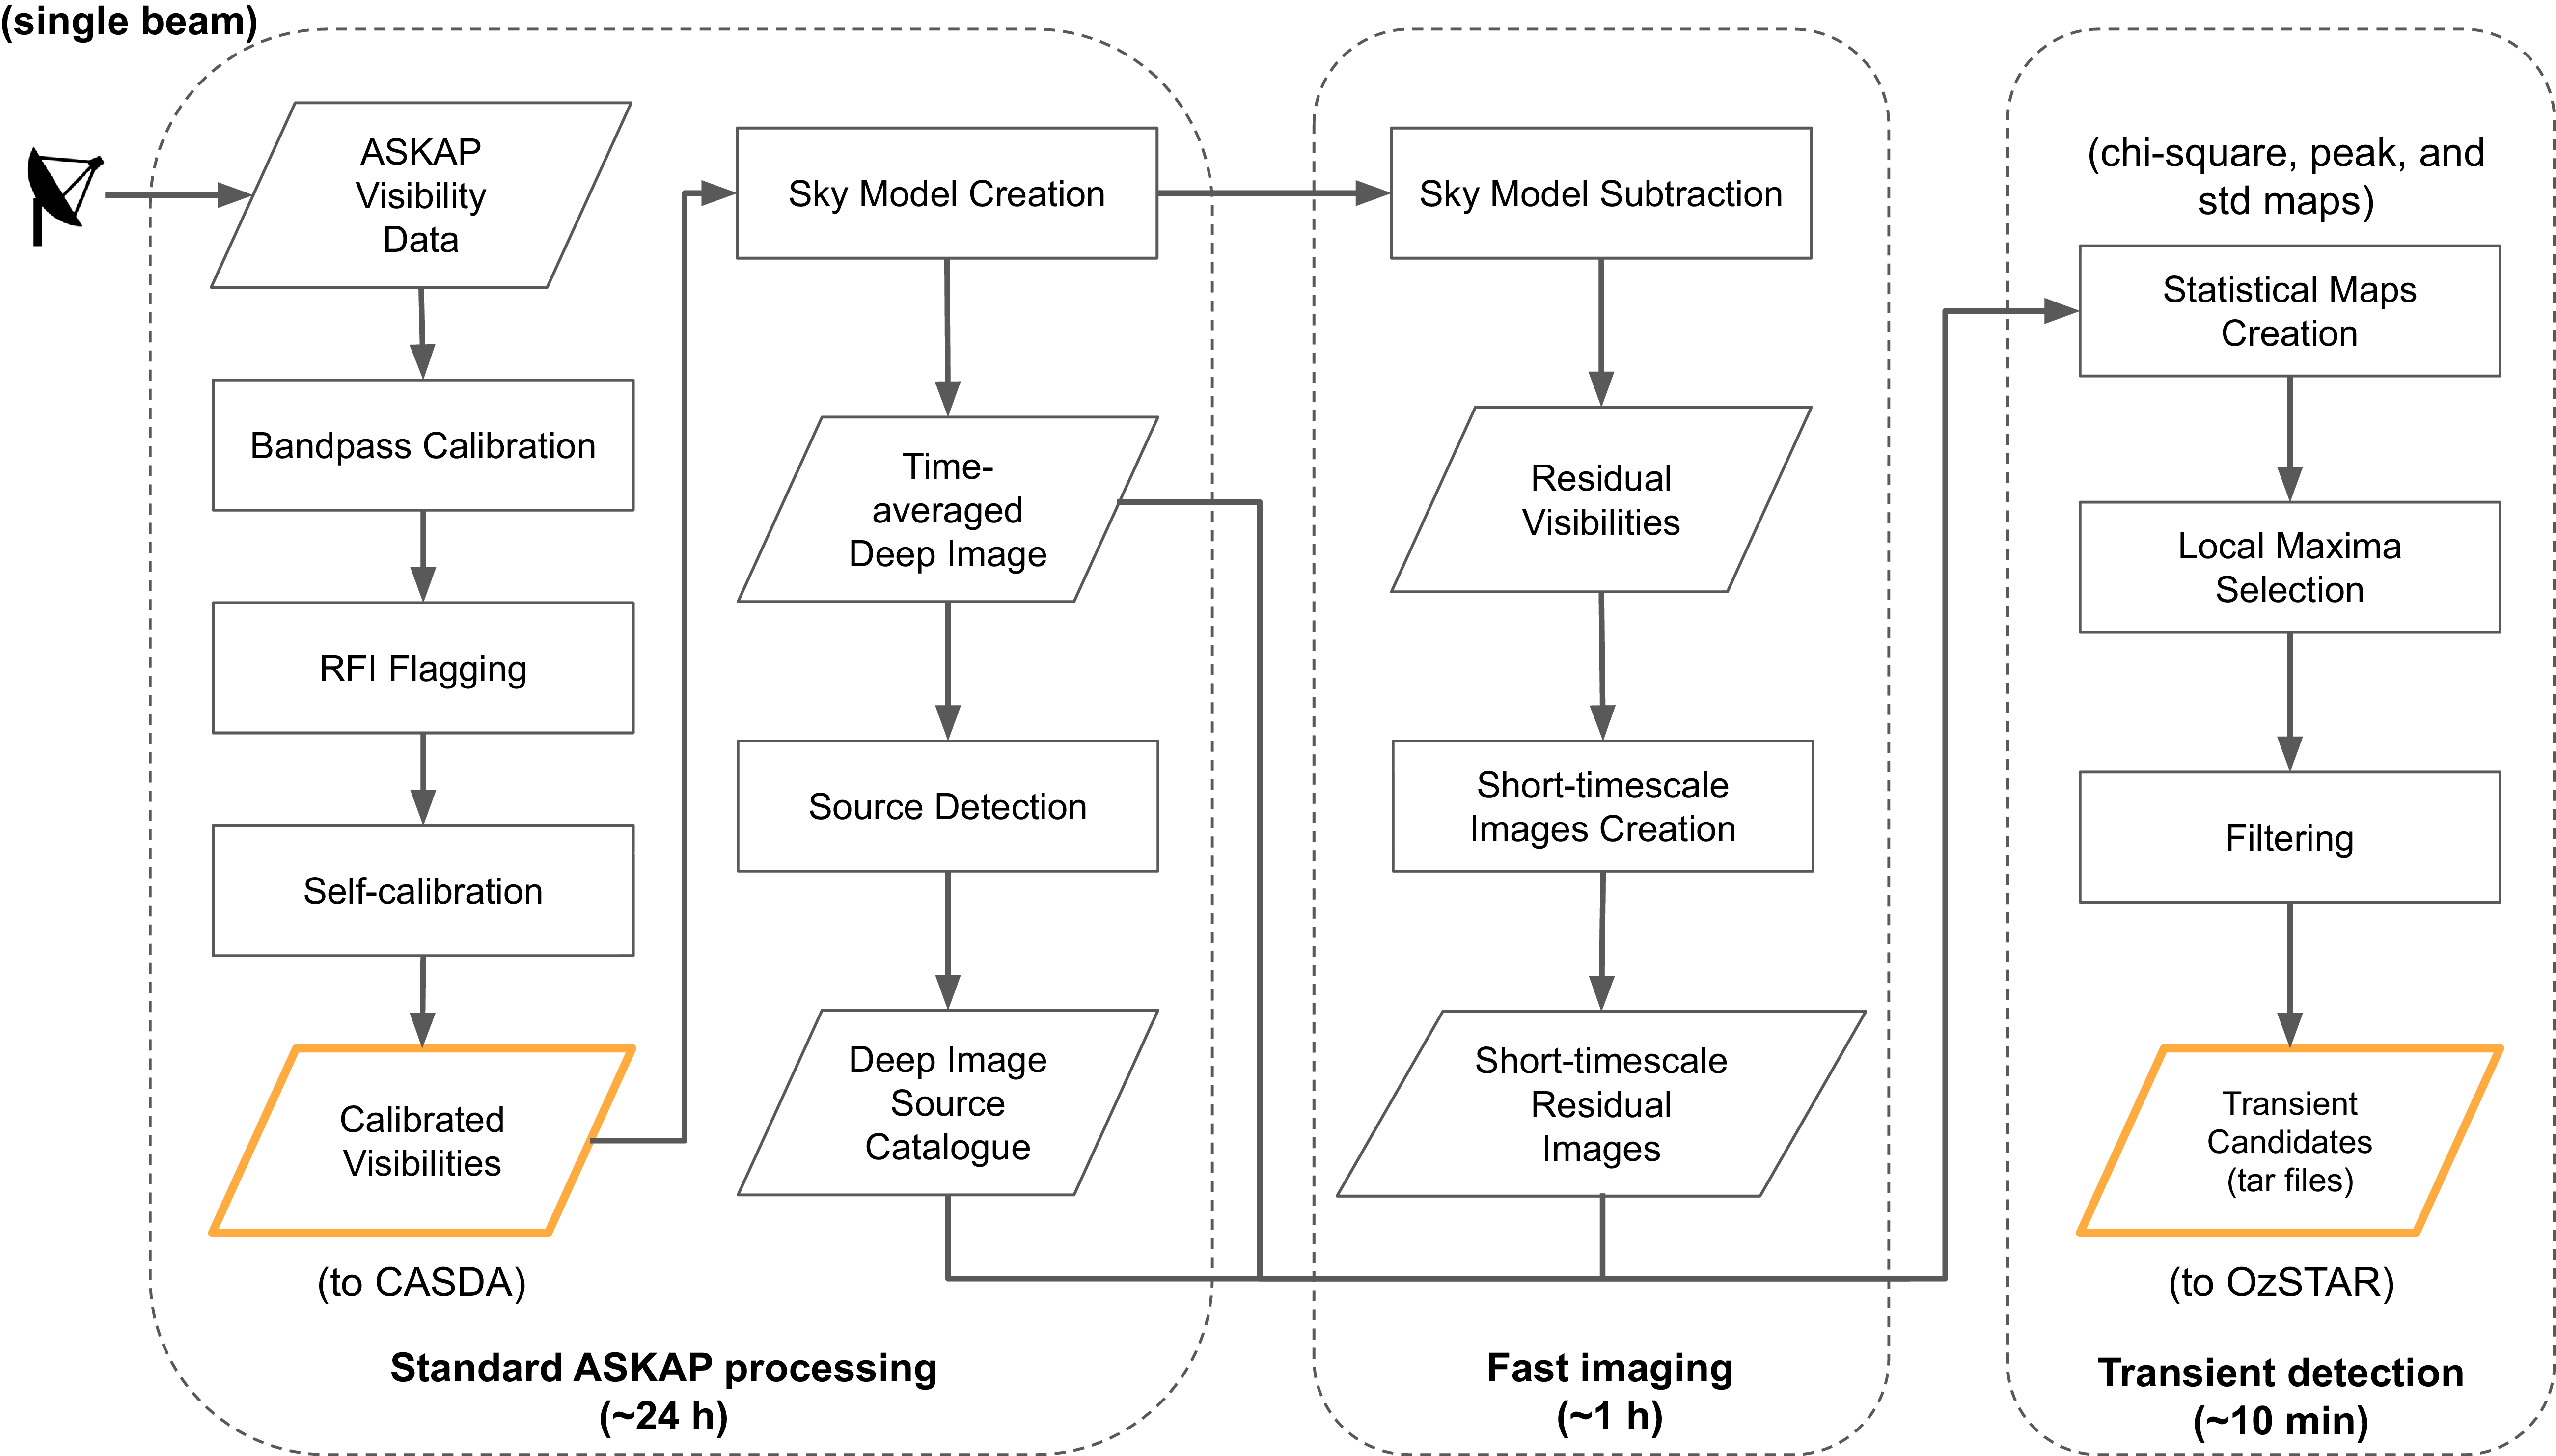
The VASTER real-time system presented here extends the existing ASKAPsoft workflow (Hotan et al. Reference Hotan2021) to carry out sky model subtraction, intra-observation imaging, and a custom variability search. Figure 1 describes how the system is integrated directly into the standard science processing and produces transient and variable candidates in real time for human vetting.
Flowchart of the VASTER real-time system. An overview of the system is described in Section 2, with the ‘fast imaging’ described in Section 2.1 and the ‘transient detection’ described in Section 2.2. All processing is performed independently on individual beams. We list the typical processing time for each part for a typical 10 h observation. The inputs for the transient detection are the time-averaged deep image, the deep image source catalogue, and the short-timescale residual images. Two data products are saved during the process (marked as orange): the standard ASKAP calibrated visibilities (archived in CASDA) and the VASTER transient candidates (tar files; stored on OzSTAR). See more details about data storage and release in Section 2.5.

The standard ASKAPsoft data processing workflow is described by Hotan et al. (Reference Hotan2021). In the rest of this section, we describe the key components of the VASTER system. Note that the VASTER real-time system presented here largely follows the offline processing workflow described by Wang et al. (Reference Wang2023). The key difference is that the real-time implementation makes use of existing functionality available in the ASKAPsoft workflow to improve efficiency (see Section 2.1).
2.1 Fast imaging
For all observations, visibility data from the ASKAP hardware correlator are written in parallel to the PawseyFootnote d supercomputing centre, with each PAF beam stored in its own CASA measurement set file; that is, a total of 36 measurement sets for one observation. The high resolution spectral line datasets are further partitioned into 6 frequency chunks (Voronkov Reference Voronkov2020). The ASKAPsoft pipeline reads these visibilities and then carries out bandpass calibration, flagging, spectral averaging to 1 MHz resolution (for high spectral resolution data), self-calibration and imaging of these continuum averaged data for the entire observation as described in Hotan et al. (Reference Hotan2021). It produces calibrated per-beam visibilities along with the resulting mosaiced ‘deep’ images and associated source-finder output that are uploaded to the CSIRO ASKAP Data Archive (CASDA). However, the per-beam sky models are not archived, meaning that the offline versions of the ASKAP fast imaging process used in the literature (e.g. Wang et al. Reference Wang2023) have had to download the data from CASDA and re-image the calibrated visibilities in order to obtain sky models for subtraction.
This duplication of work is computationally inefficient, but more importantly introduces substantial latency in finding transients. The aim of the VASTER project was to incorporate fast imaging as part of the standard science processing workflow to remove this inefficiency. It also removes other sources of delay, such as the time required for data to become publicly available in the archive, which can take weeks to months due to scientific validation by the survey science teams.
As part of the VASTER extension to the ASKAP pipelines, all processing is performed on the SetonixFootnote
e
supercomputer housed at Pawsey, with each beam processed independently throughout. We first create per-beam residual visibilities by subtracting the existing sky model from the calibrated visibilities using the ASKAPsoft application ccontsubtract.Footnote
f
We then produce intra-observation residual images by splitting and imaging the residual visibilities at 15 min intervals using the ASKAPsoft imager
Footnote
g
application. The imaging parameters for these residual visibilities are treated separately to the deep imaging parameters. Since most of the continuum emission has been subtracted out, only dirty images are produced with no further deconvolution. The imaging uses multi-frequency synthesis but with no Taylor-term imaging. The cell-size parameter (oversampling of the synthesised beam) is kept at 2 arcsec. The image shape for each beam is set to
 $\sim$
 $2^{\circ}\times 2^{\circ}$
and matches the field-of-view of a single beam at the lowest ASKAP frequencies.
The choice of timescale was dictated by several practical factors, including the I/O limitations on Setonix, as well as the computational and storage overheads associated with imaging on shorter time intervals and restrictions on the maximum number of files and concurrent jobs. As VASTER operates commensally within the standard ASKAP processing workflow, it is important to ensure that it does not adversely impact other survey pipelines running on the same system, and the current configuration therefore represents a conservative, pilot implementation. For example, using the native 10 s resolution would produce 3 600 images per beam for a standard 10 h observation, and the use of separate imaging jobs for each image would lead to a high degree of overheads due to repeated fixed tasks (e.g. allocation of grids and definition of convolution functions), resulting in the transient imaging taking longer than the rest of the processing. While a variety of transient classes occur on much shorter timescales and hence require higher time resolution data to completely understand, as we demonstrate in this work, some are still detectable with coarse light curves. Future improvements to the processing workflow (e.g. a properly parallelised transient-imager) would remove these overheads, allowing higher time resolution imaging down to 10 s. For a typical 10 h observation, the current workflow produces about 40 15 min residual images per beam (each image is about 50 MB), with a typical rms noise of
 $\sim$
200
 $\mu$
Jy beam
 $^{-1}$
per image.
2.2 Transient detection
The fast imaging described above makes use entirely of existing ASKAPsoft functionality. As ASKAPsoft lacks transient detection capability, we have developed a dedicated transient detection algorithm, which is containerised and installed as a module on Setonix. The underlying logic of the algorithm follows that used in the offline processing, as described in detail by Wang et al. (Reference Wang2023). Here, we summarise the main steps, including the selection criteria we use in the real-time system.
The inputs to the transient detection algorithm are the time-averaged deep image, the deep image source catalogue, and the short-timescale residual images. The VASTER system generates three statistical maps from the short-timescale residual images and identifies transient candidates in the image plane.
First, a data cube is constructed for each beam by stacking the series of short-timescale residual images. For a 10 h observation, the cube size would be [40, 3584, 3584] pixels, where the first axis represents time and the other two represent spatial dimensions, that is, in [time, dec, ra]. Three metricsFootnote h are calculated for each spatial pixel along the time axis:
-
• reduced chi-square (
 $\eta$
); to produce a ‘chi-square map’;
-
• peak signal-to-noise ratio (
$\mathrm{S/N}_{\mathrm{peak}}$
); to produce a ‘peak map’; -
• standard deviation (
$\sigma_\mathrm{s}$
); to produce a ‘standard-deviation map’.


The weighted reduced chi-square
 $\eta$
measures the significance of random variability and is defined as
 \begin{equation}\eta = \frac{1}{N - 1} \sum_{i=1}^{N} \frac{(S_i - \bar{S})^2}{\sigma_i^2},\end{equation}
where N is the total number of short-timescale residual images,
 $S_i$
and
 $\sigma_i$
are the flux density and local rms noise of the ith residual image, and
 $\bar{S}$
is the weighted mean flux density. The local rms noise is calculated from a square box with a size of 299 pixels around each spatial pixel in each short-timescale residual image. For
 $\mathrm{S/N}_{\mathrm{peak}}$
, we calculate
 $S_i/\sigma_i$
for each spatial pixel and record the maximum value along the time axis. We also calculate the weighted modulation index, defined as
 $m = \sigma_\mathrm{s}/\bar{S}$
, to measure the magnitude of variability.
The VASTER system selects candidates as local maxima in either the chi-square or peak map, using a threshold of five times the standard deviation defined from the map distribution in logarithmic space to suppress extreme outliers. A minimum separation of 30 pixels is set between local maxima, such that peaks closer than this are merged into a single detection, reducing false detections from nearby bright sources. Candidates from both maps are combined and filtered using the following criteria:
-
1. Sources located within 1.2 times the primary beam size (full width at half maximum) are selected to avoid regions near the beam edge, where the sensitivity decreases and the noise increases;
-
2. Sources with no counterpart in the deep image source catalogue within 20 arcsec are selected as likely transients;
-
3. For sources with a close counterpart (separation
$\lt $
2 arcsec), we selected only those with
$m \gt 0.1$
(highly variable) and an integrated-to-peak flux ratio
$\lt $
1.5 (compact); -
4. Sources with separations between 2 and 20 arcsec are excluded as likely sidelobes or artefacts from the nearby source, unless the nearby source is faint (
$\lt $
2 mJy).


Once the processing is complete and the candidate list is finalised, VASTER automatically generates a light curve, deep-image cutout, and an animation of the short-timescale images for each candidate to help the team assess whether the candidate is real. These data products are compressed into 36 tar files (one per beam). All objects in the final list are then passed to a web application for manual inspection.
2.3 Candidate inspection tool
The final outputs from VASTER are stored in a dedicated directory on Setonix and are automatically synchronised to a processing area on the OzSTARFootnote i supercomputer. We run a program on OzSTAR to routinely check the completeness of each observation (verifying that all 36 beams and final products are present). For observations that pass this check, the program restructures the outputs and uploads them to the VASTER web application (see more details in Appendix A). The system automatically assigns the inspection task for that SBID to an available team member, sends a notification to the team, and reports the number of candidates detected.
The web inspection tool is hosted on a virtual machine within the ARDC NectarFootnote
j
Research Cloud and accessible to authorised users (currently, members of the VAST collaboration). Users can filter assigned observation SBIDs and review each candidate through an interactive interface. For each candidate, the web app displays key statistics (e.g. coordinates,
 $\eta$
,
 $\mathrm{S/N}_{\mathrm{peak}}$
, and m), the intra-observation light curve, a deep-image cutout, and an animation of short-timescale residual images. It also lists nearby sources from the local database (for candidates detected multiple times) and cross-matches with external databases such as SIMBAD (Wenger et al. Reference Wenger2000) and the ATNF Pulsar Catalogue (Manchester et al. Reference Manchester, Hobbs, Teoh and Hobbs2005). The tool enables team members to manually inspect each candidate to identify its source type (where possible) and rule out artefacts. The typical number of transient candidates identified per observation is
 $\sim$
5–20, of which
 $\sim$
0–2 are confirmed as real astronomical objects after manual inspection.
2.4 Latency
Figure 1 lists the typical processing time for each part for a 10 h ASKAP observation. The processing speed of the VASTER real-time system primarily depends on the sky-model creation step within the standard ASKAP processing, which is the most time-consuming stage taking
 $\sim$
15–20 h. The other two parts (i.e. the VASTER extension) are typically much faster, taking
 $\sim$
1 h. As VASTER is fully integrated into the main ASKAP workflow on Setonix, no additional time is needed for data transfer or reprocessing. However, Setonix is a shared supercomputing facility running all major ASKAP Survey Science Projects, and it is important to ensure that the VASTER system does not impact other surveys and that resources are balanced across projects. Continuum observations (e.g. EMU) are typically processed very promptly, while high spectral resolution observations (e.g. WALLABY and DINGO) can take longer if there are disc space shortages. As a result, the typical latency of the VASTER system is less than a few days, and at most
 $\sim$
10 days, depending on the HPC load and disc space. This allows transient candidates to be identified well before the standard data products are validated and released, which can take weeks to months.
2.5 Data storage and release
The standard ASKAP science data products, including calibrated visibilities, mosaiced images (from all 36 beams), and catalogues, are deposited in CASDA. These data are made available to public after quality control and validation by the survey science teams. VASTER transient candidates’ products, including their light curves, deep-image cutouts, and animations of the short-timescale images, are stored on OzSTAR and accessible to the VAST team members. These VASTER products are not archived in CASDA. Other intermediate VASTER data products, including the time-averaged deep image (per beam), deep image source catalogue (per beam), and short-timescale residual images (per beam), are not saved or archived to reduce storage usage. Future developments may include archiving model-subtracted visibilities or per-beam model images in CASDA, which would significantly reduce the offline reprocessing work when investigating variability on different timescales.
3. Observations and survey strategy
ASKAP was designed primarily as a survey telescope, and has nine major survey science projects that take up 75% of the time allocation. The VASTER system has been operating commensally with these ASKAP science survey projects in real time since 11 July 2025 (with the exception of CRAFT filler observations, which do not use the standard processing pipeline). The current implementation produces images on 15 min timescales, and therefore runs only on those surveys with long observations (greater than several hours). These surveys are:
-
1. the Evolutionary Map of the Universe (EMU) survey (Norris et al. Reference Norris2011, Reference Norris2021), a wide-area continuum survey aiming to map the entire southern sky at 943.5 MHz with 10 h of observing time per field;
-
2. the Widefield ASKAP L-band Legacy All-sky Blind surveY (WALLABY; Koribalski et al. Reference Koribalski2020), a survey of neutral hydrogen (H i) in the Local Universe aiming to observe half of the southern sky at 1 367.5 MHz with 8 h of observing time per field; and
-
3. the Deep Investigation of Neutral Gas Origins (DINGO; Rhee et al. Reference Rhee2023), which targets a small deep field with total observing times of thousands of hours at 1 367.5 MHz.
VASTER does not run on the Galactic ASKAP (GASKAP) survey (Dickey et al. Reference Dickey2013), as (i) the observations involve interleaving and hence do not produce a continuum data product in the same form as the other surveys; and (ii) the use of spectral zoom modes means that only a small fraction of the full bandwidth is available. VASTER was initially operated on the First Large Absorption Survey in H i (FLASH; Yoon et al. Reference Yoon2025), which aims to cover all sky with declination
 $\lt $
+15
 $^\circ$
(excluding the Galactic plane) with 2 h observations at a central frequency of 855.5 MHz to search for H i absorption. However, due to the high I/O load associated with per-beam source finding in the larger (
 $\sim$
240 GB), high-spectral-resolution FLASH cubes, the performance of VASTER is significantly reduced and can impact other survey processing running on Setonix. As a result, VASTER has not been running on FLASH observations since 28 August 2025 and will remain disabled until the ASKAP team is satisfied with improved performance.
In future versions of VASTER we aim to implement shorter imaging timescales, down to 10 s (the ASKAP sampling time). This will allow VASTER to detect seconds-timescale transients (if sufficiently bright) and to operate on short observations from surveys such as the Rapid ASKAP Continuum Survey (RACS; McConnell et al. Reference McConnell2020) and VAST (Murphy et al. Reference Murphy2013; Murphy et al. Reference Murphy2021).
4. Initial results
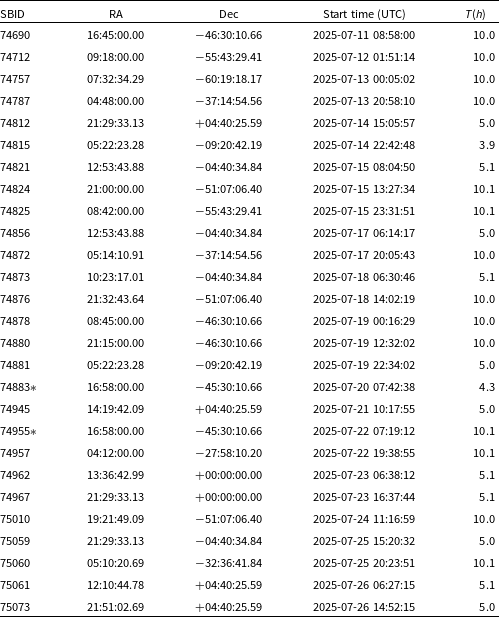
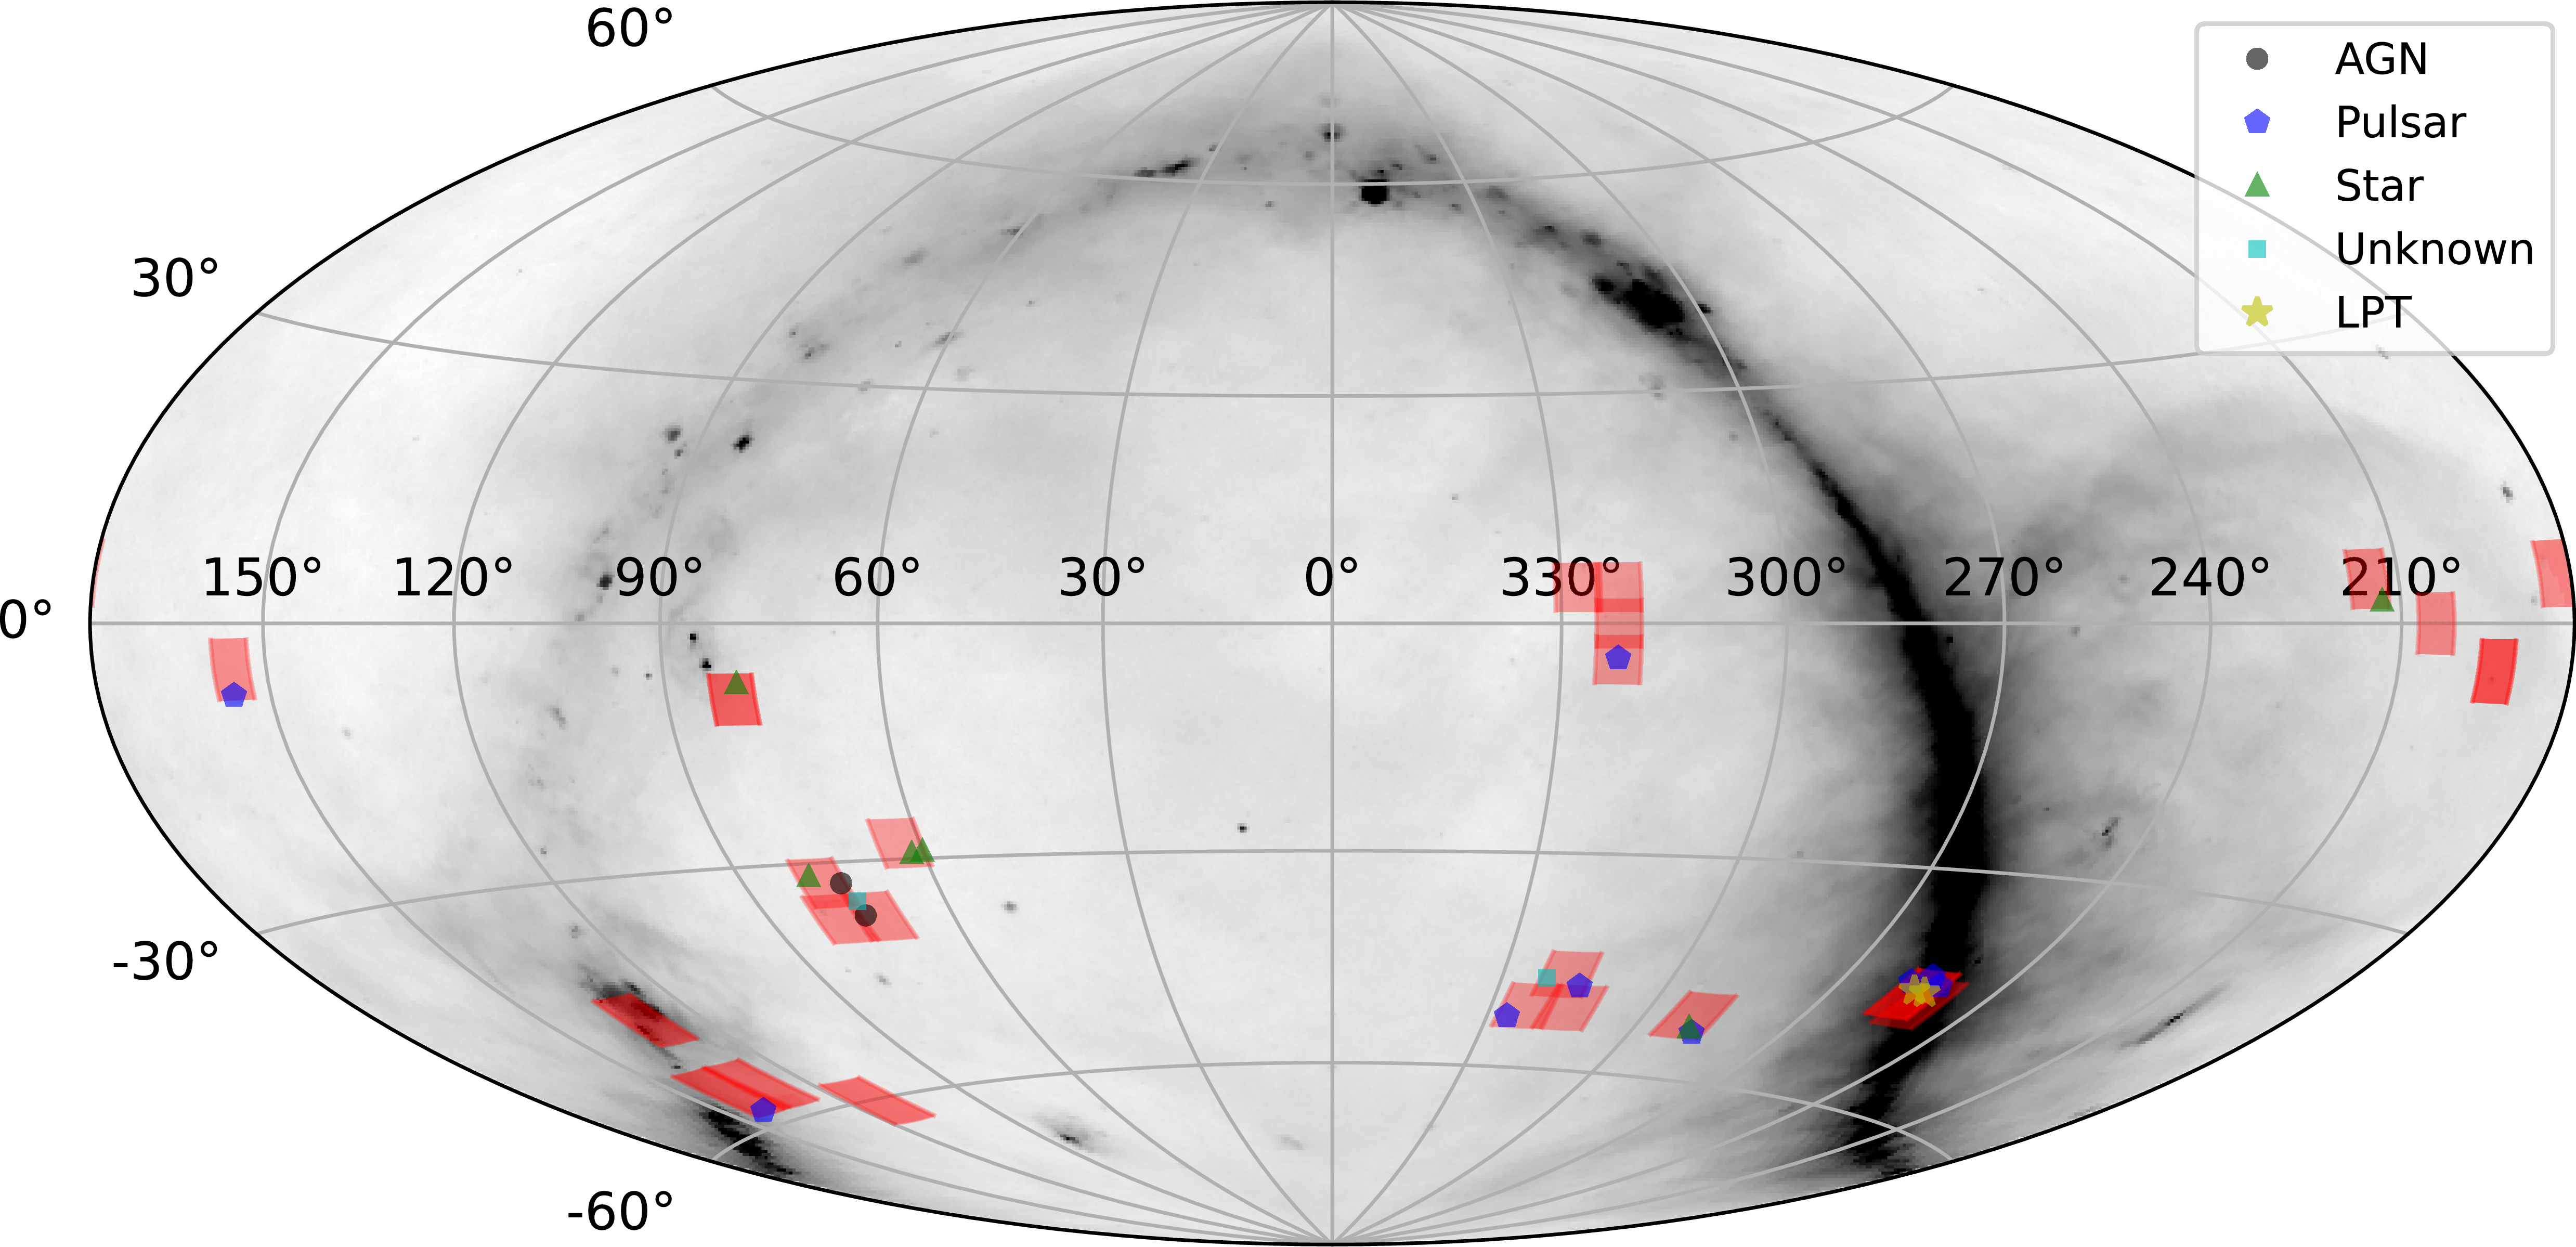
The results presented in this paper come from the first two weeks of operation, from 11 July 2025 to 26 July 2025. During this period the VASTER system ran on 25 EMU observations, and two Target of Opportunity (ToO) observations, while we tested the system stability. The total observing time was 205 h. These observations were conducted at a central frequency of 943.5 MHz with a bandwidth of 288 MHz. The CRACO system was not operating during this period, so no millisecond-timescale searches are available. Details of the observations are given in Table 1. The sky coverage of these observations is shown in Figure 2.
Details of the observations used in this work. Start times are in UTC, and T represents the observation duration in hours. These observations are conducted at a central frequency of 943.5 MHz with a bandwidth of 288 MHz.

Table 1. Long description
The results presented in this paper come from the first two weeks of operation, from 11 July 2025 to 26 July 2025. During this period the VASTER system ran on 25 EMU observations, and two Target of Opportunity (ToO) observations, while we tested the system stability. The total observing time was 205 h. These observations were conducted at a central frequency of 943.5 MHz with a bandwidth of 288 MHz. The CRACO system was not operating during this period, so no millisecond-timescale searches are available. Details of the observations are given in Table 1. The sky coverage of these observations is shown in Figure 2.
*ToO observations as follow ups of LPTs.
Sky coverage of the observations used for the initial results (shown as red shaded regions). Markers represent detected transient and variable sources (see details in Section 4). The background is the diffuse Galactic radio emission at 943.5 MHz modelled by Zheng et al. (Reference Zheng2017).

Figure 2. Long description
A scatter plot representing the sky coverage of observations used for initial results, with red shaded regions indicating the observed areas. The plot includes markers representing detected transient and variable sources. The background shows the diffuse Galactic radio emission at 943.5 MHz modeled by Zheng et al. The horizontal axis represents the right ascension in degrees, ranging from 0 to 360 degrees. The vertical axis represents the declination in degrees, ranging from -90 to 90 degrees. The markers are color-coded to represent different types of sources: AGN (gray circles), Pulsar (blue diamonds), Star (green triangles), Unknown (cyan squares), and LPT (yellow stars). The plot shows clusters of markers in specific regions, indicating areas with higher detection rates of transient and variable sources.
The VASTER system detected a total of 399 candidates during the first two weeks of operation. We reviewed each candidate manually using the inspection tool. Most were found to be false detections caused by (i) antenna bandpass variations and time-dependent antenna amplitude gain changes (as a result of antenna failures or system changes); (ii) direction-dependent phase errors (as a result of extreme ionospheric conditions); and (iii) antenna pointing errors. These effects can produce non-PSF-like residual artefacts around field sources after sky-model subtraction, which can subsequently be misinterpreted as transient events. These artefacts are particularly strong around bright sources and, in the case of pointing errors, result in increased errors towards the beam edge. As these residual PSF artefacts rotate with time and/or increase in amplitude, they can trigger false detections at the source location or even some distance from the source if the residual PSF is particularly extended (see Appendix A for example artefacts).
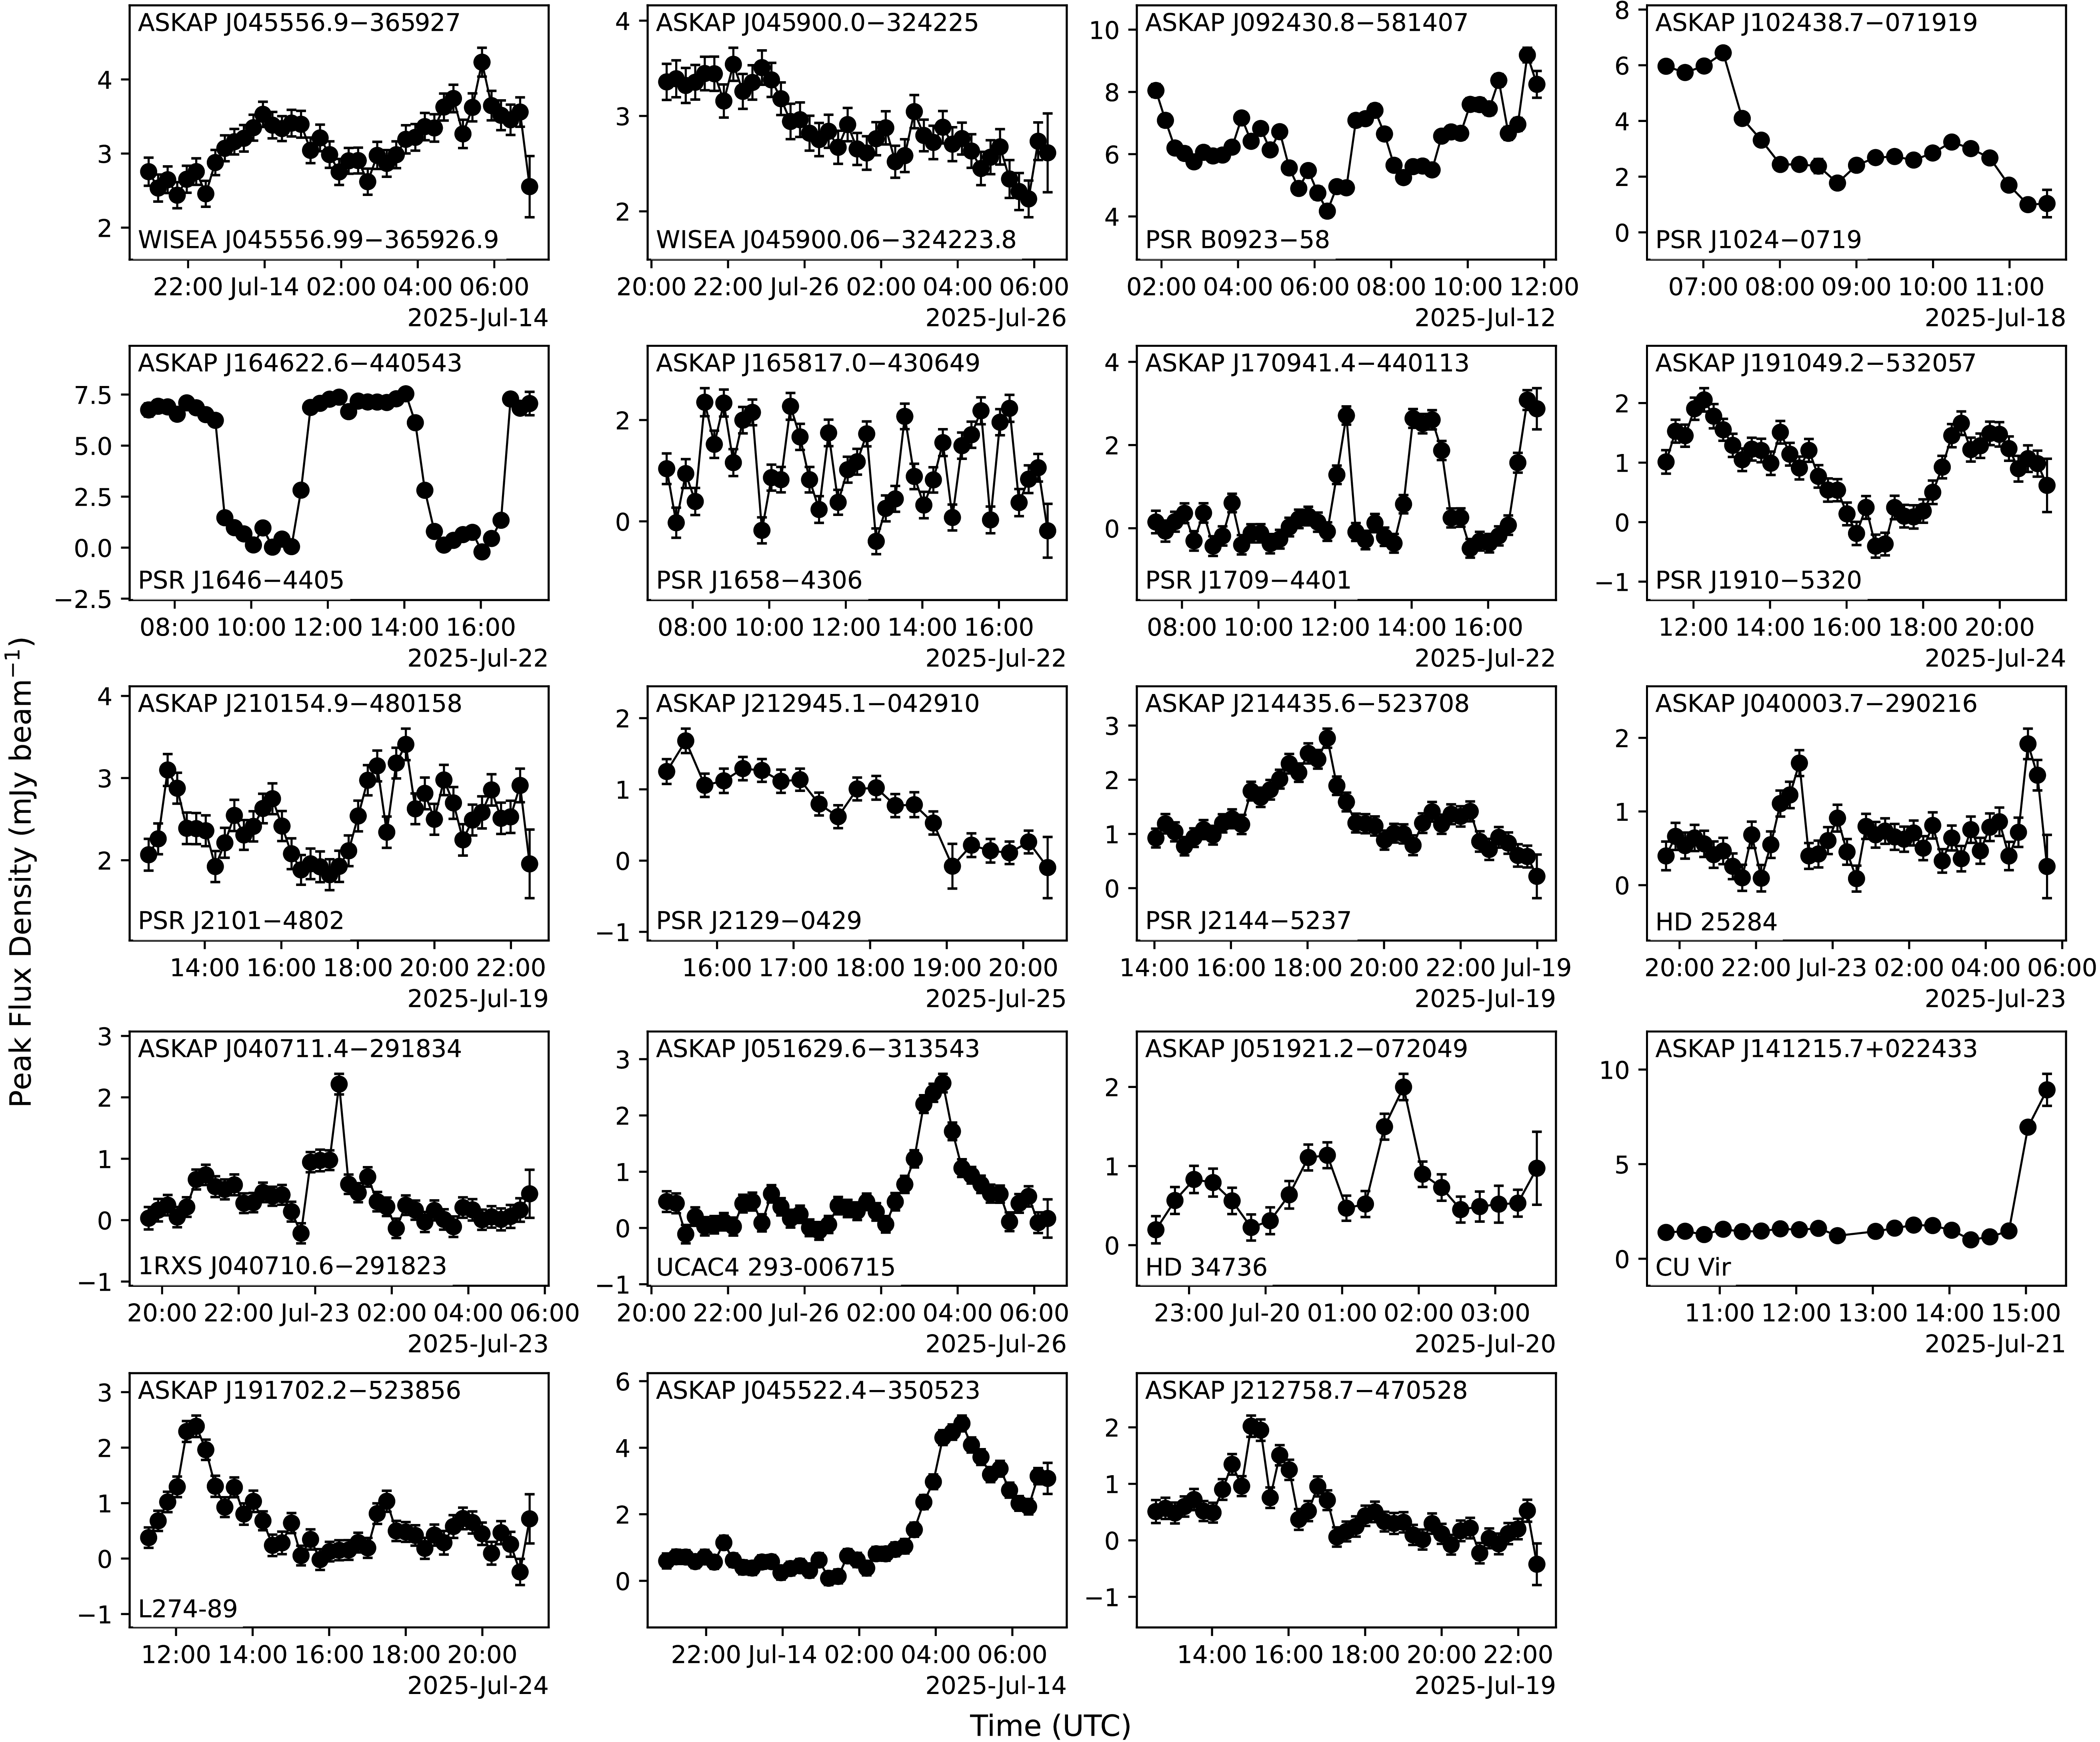
After manual inspection of the candidates, we found 21 real transients. Their radio light curves are shown in Figure 3. We identified multi-wavelength counterparts for most of these sources using our inspection tool which incorporates information from external databases; these include known pulsars and stars. For transients without an obvious optical/IR counterpart, we performed additional manual checks using the VizieR catalogueFootnote
k
and the European Southern Observatory archiveFootnote
l
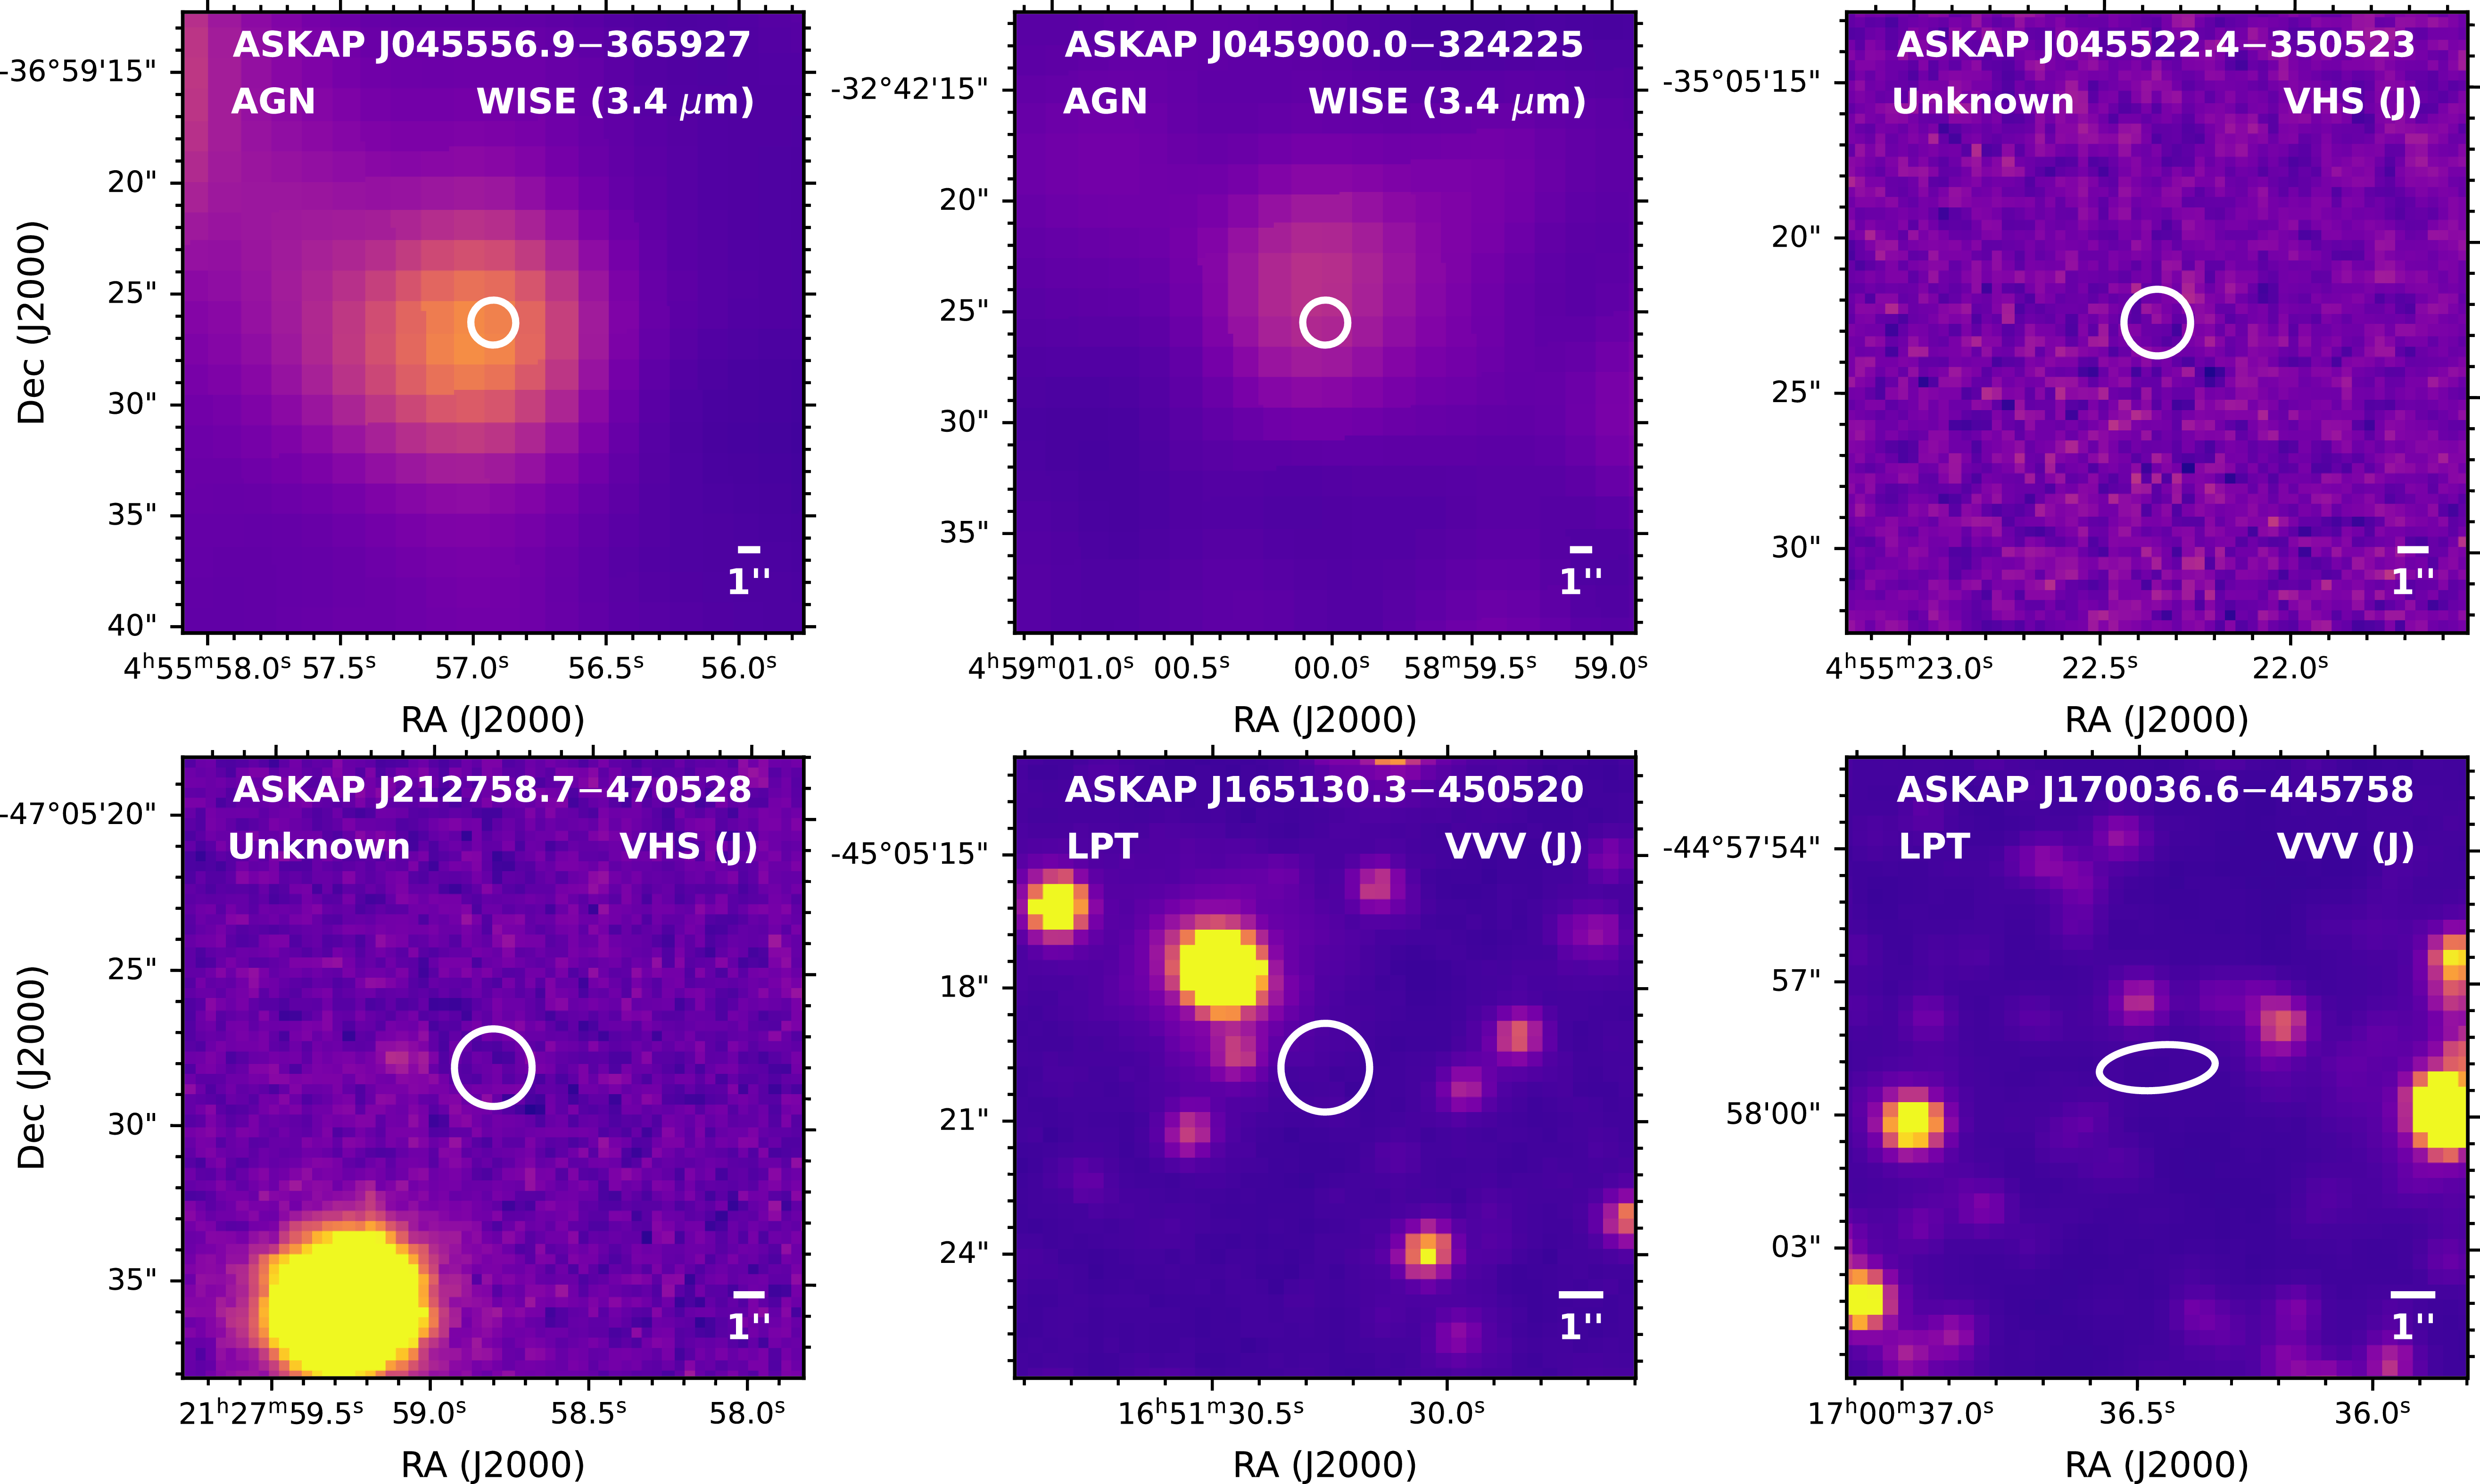
to find any fainter counterparts not included in SIMBAD. ASKAP typically achieves sub-arcsec localisation accuracy for mJy-level sources. However, since it is not phase referenced, ASKAP can have systematic astrometric errors of about 0.6 arcsec in RA and 0.4 arcsec in Dec (McConnell et al. Reference McConnell2020). To account for this, we used a conservative approach by adding 1 arcsec uncertainty floor to the statistical uncertainties when cross-matching with optical surveys. Figure 4 shows their
 $1\sigma$
positional uncertainty regions overlaid on optical images. We found four sources with no multi-wavelength counterpart.
Light curves of all transients (excluding the two LPTs, which are shown separately) in their detected epoch. Source identifications are given in the bottom-left corner of each panel. The two unidentified sources are shown on the bottom row, and have no label.

Optical images overlaid with the
 $1\sigma$
positional uncertainty regions of the radio sources requiring further multi-wavelength searches. For each panel, the source name, classification, optical/infrared survey, and observing band are shown at the top. The angular scale is shown in the lower right corner. The
 $1\sigma$
localisation region of the radio source is given by the white ellipse. The positional uncertainties are derived from ASKAP observations (with added 1 arcsec uncertainty floor to account for potential systematic astrometric errors), except for ASKAP J170036.6
 $-$
445758, which is derived from the MeerKAT observation. See discussions in Section 4.

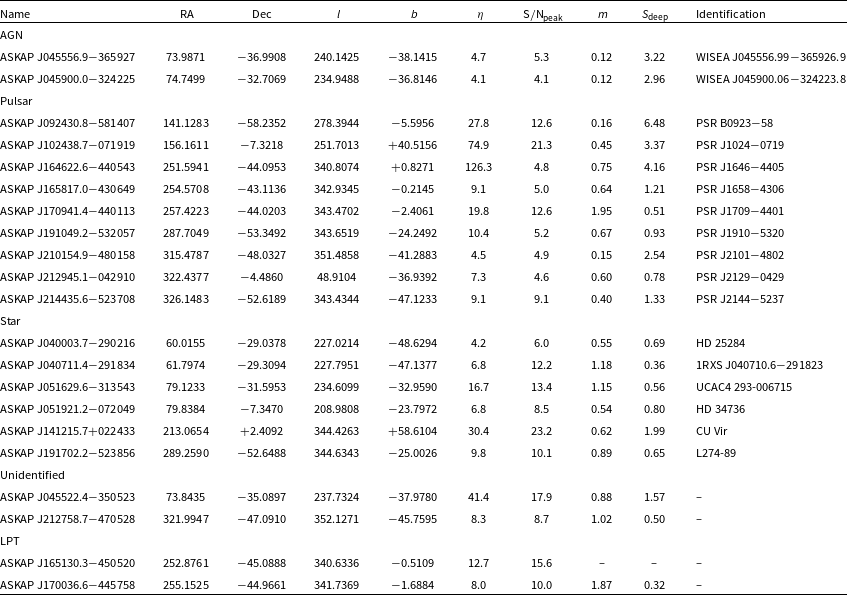
Based on these investigations, the transients were classified as: nine known pulsars; six radio stars; two scintillating AGN; two new long period transients and two as-yet unidentified sources. Their properties are summarised in Table 2, and their sky positions are plotted in Figure 2. We briefly discuss individual sources in the following subsections.
Properties of detected transients. The table lists source coordinates (RA, Dec, and Galactic coordinates l and b, in degrees), variability metrics (
 $\eta$
,
 $\mathrm{S/N}{\mathrm{peak}}$
, and m), and the deep-image flux density (
 $S_\mathrm{deep}$
; in mJy). For sources with multiwavelength counterparts, the corresponding SIMBAD or WISE identifications are provided.

Table 2. Long description
The table presents properties of detected transients, organized into several columns. The columns are: Name, RA, Dec, l, b, η, S/Npeak, m, Sdeep, and Identification. The table includes 23 rows of data. Each row lists specific values for each column, detailing the properties of the transients. The columns are as follows: Name: The identifier of the transient. RA: Right Ascension coordinate in degrees. Dec: Declination coordinate in degrees. l: Galactic longitude in degrees. b: Galactic latitude in degrees. η: A variability metric. S/Npeak: Signal-to-noise ratio at peak. m: Another variability metric. Sdeep: Deep-image flux density in mJy. Identification: Corresponding SIMBAD or WISE identifications for sources with multiwavelength counterparts. The table includes various types of transients such as AGN, pulsars, stars, LPT, and unidentified sources. Each row provides specific values for each column, detailing the properties of the transients. For example, the first row lists: Name: AGN, RA: 73.9871, Dec: -36.9908, l: 240.1425, b: -38.1415, η: 4.7, S/Npeak: 5.3, m: 0.12, Sdeep: 3.22, Identification: WISEA J045556.99-365926.9. The table provides a comprehensive overview of the properties of the detected transients.
4.1 Long period transients
LPTs are known to be highly intermittent in their activity (e.g. Hurley-Walker et al. Reference Hurley-Walker2022). One of the goals of VASTER is to detect LPTs in real time, to enable rapid follow-up before they become inactive.
We detected two new LPTs in the first two weeks of VASTER real-time operations. These were both in the Galactic plane field, SB74690. We detected two pulses from each source in the initial observation. On this basis we conducted two ASKAP follow-up observations
 $\sim$
10 days later (SB74883 and SB74955) and detected more pulses, confirming their periodicity. We also conducted two 3 h MeerKAT observations in the UHF band (544–1 087 MHz) three months after discovery and detected one source at the expected time.Footnote
m
The results and interpretation for each object are discussed in the following subsections.
4.1.1 LPT: ASKAP J165130.3
$-$
450520

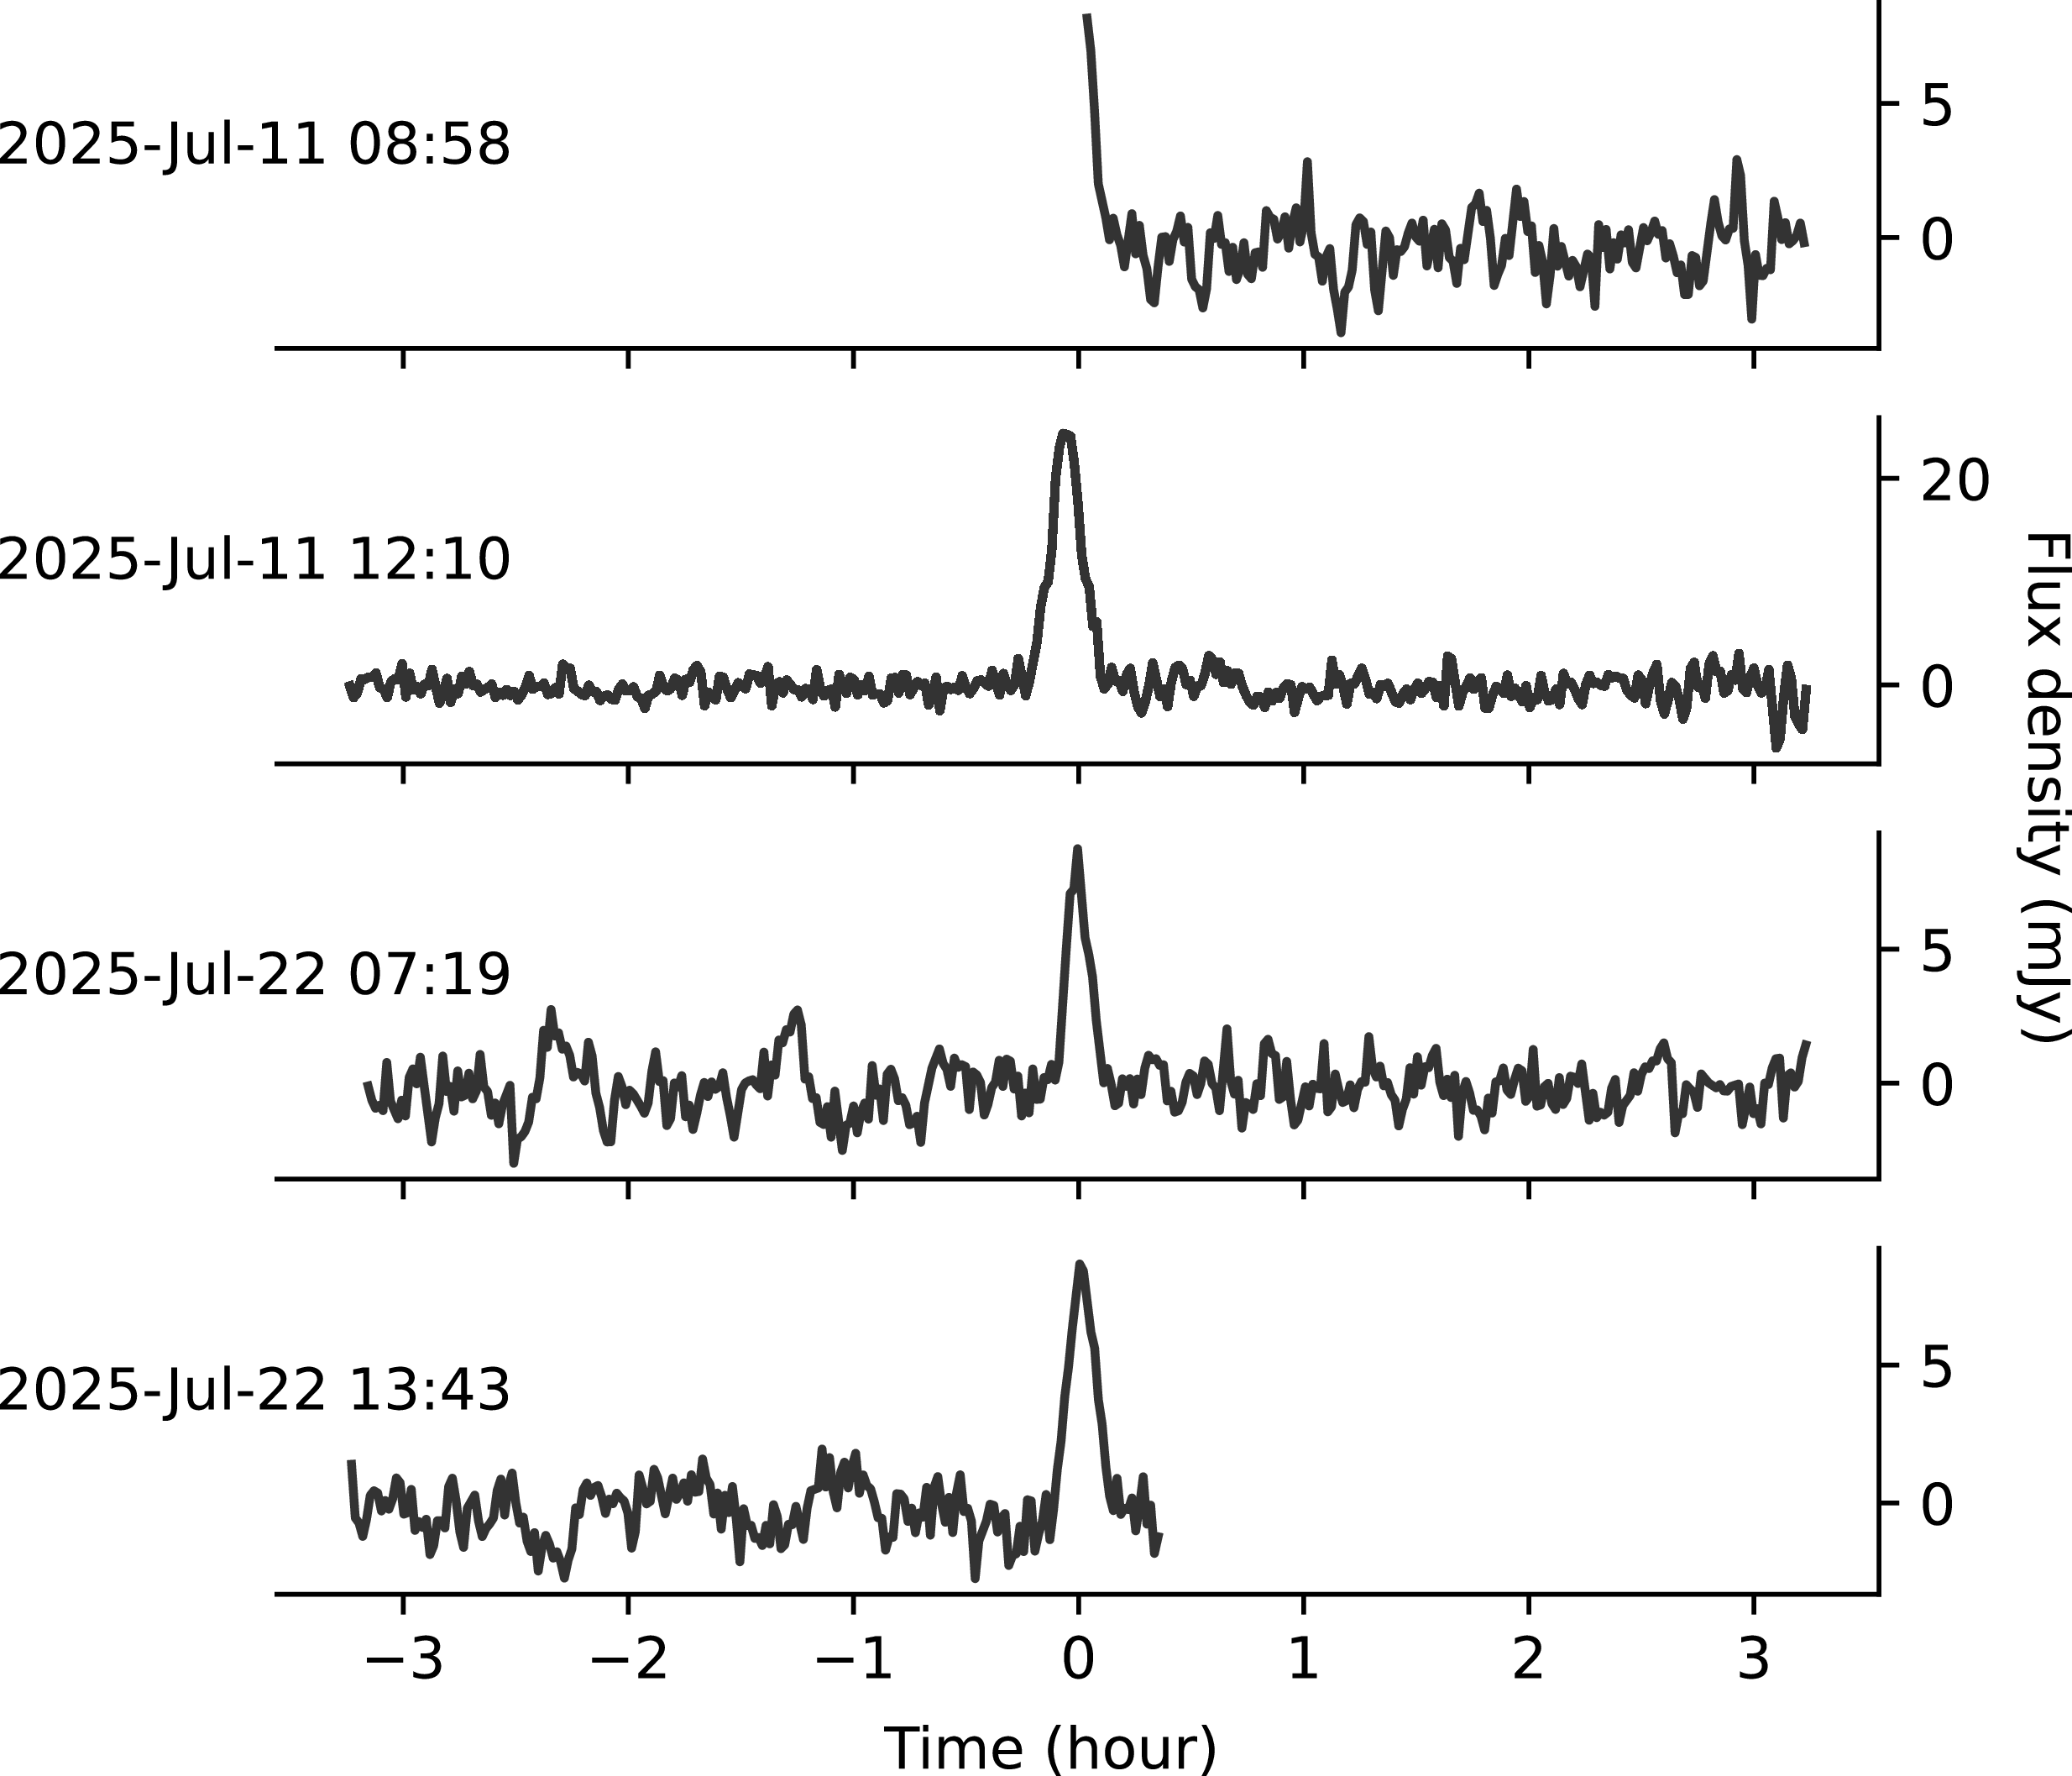
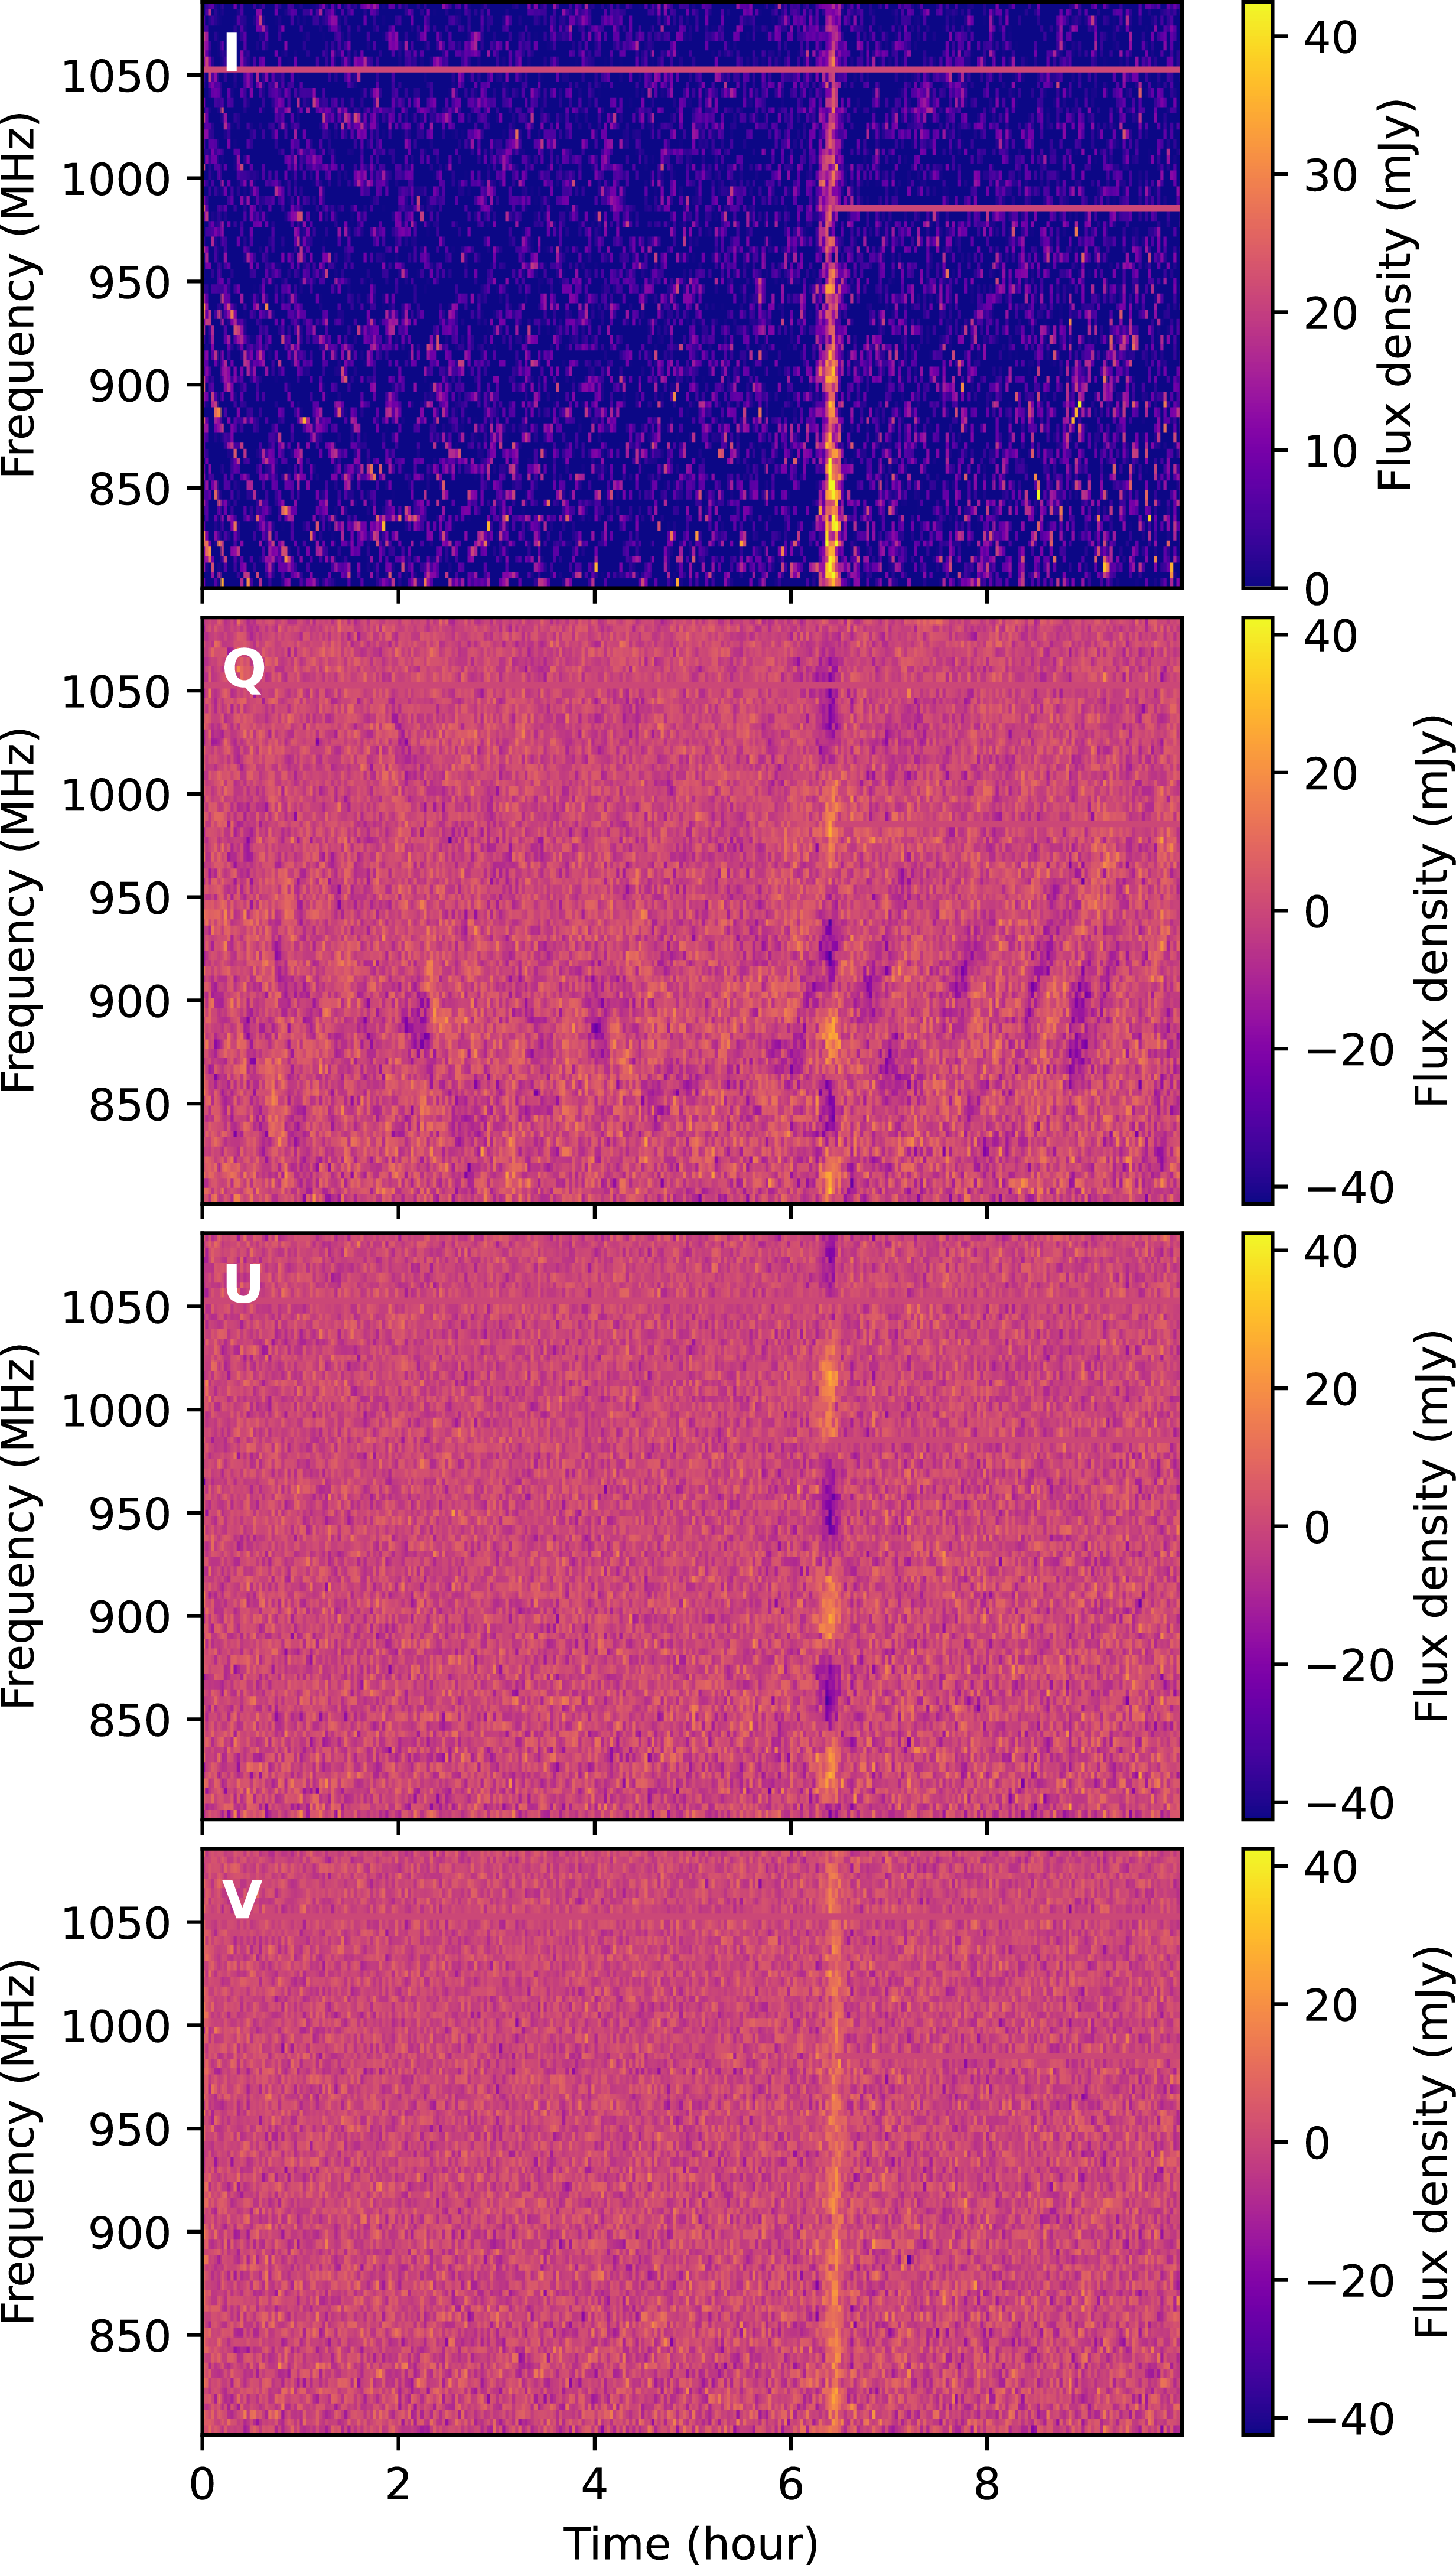
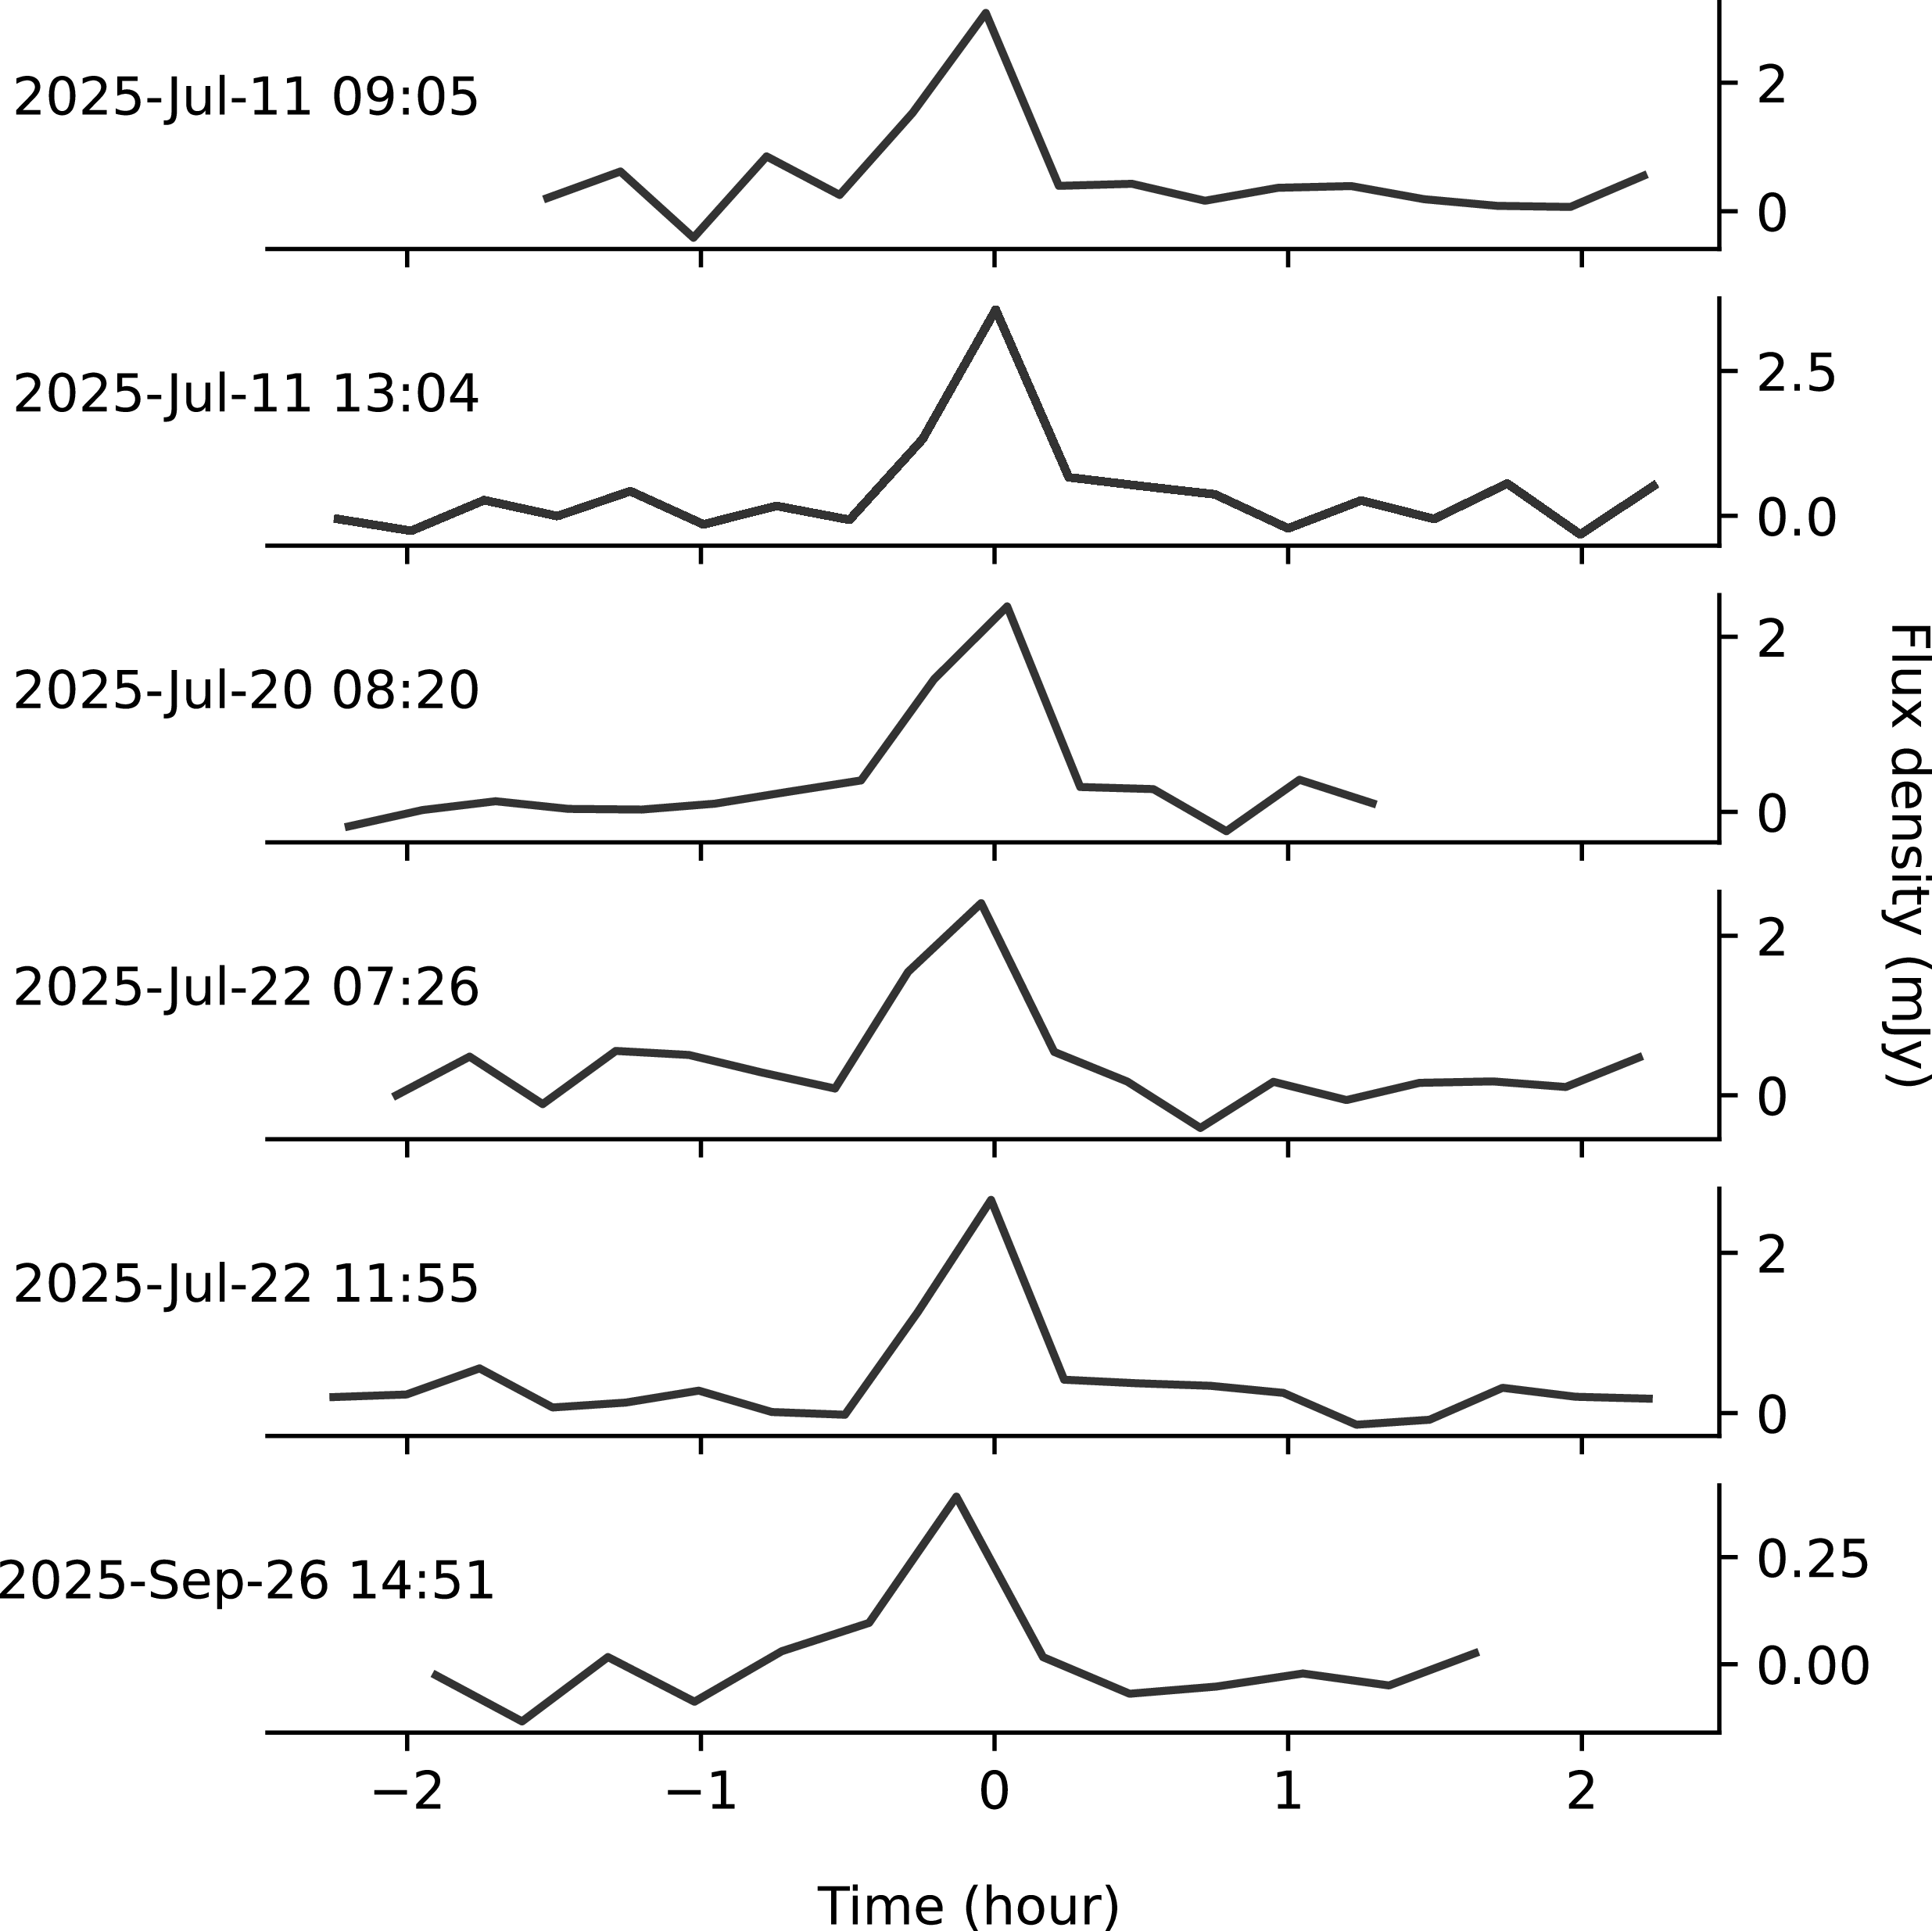
We detected four pulses across three ASKAP observations. To characterise their properties, we extracted full-polarisation dynamic spectra at the highest available time and frequency resolution (10 s and 1 MHz) from the ASKAP visibilities with DStools (Pritchard Reference Pritchard2025). At this resolution, we do not observe any short-term substructure that could be used to measure a dispersion measure. Figure 5 shows the light curves obtained by averaging the total intensity dynamic spectra over frequency and binning the time resolution from 10 s to 1 min. Figure 6 shows the full-polarisation dynamic spectra for the brightest pulse, averaged to a resolution of 1 min and 4 MHz.
The times of arrival for three of the pulses, along with their uncertainties, were measured by fitting multi-component Gaussian functions to their pulse profiles. We estimated a period of
 $6.4772\pm0.0002$
h with tempo2 (Hobbs et al. Reference Hobbs, Edwards and Manchester2006). In the timing model, the source position was fixed at the value derived from ASKAP imaging, and we fit only for the spin frequency.
To measure spectral index, we integrated the on-pulse phase (where the S/N
 $\gt 6$
) and binned the data into 16 MHz frequency channels across the total 288 MHz bandwidth. We measured a steep spectral index of
 $\sim$
 $-2.8$
for the brightest pulse (on 11 July 2025), while the spectral index changed to be
 $\sim$
 $-1.0$
for the fainter pulses (on 22 July 2025). We estimated a rotation measure (RM) of
 $-141\pm3$
rad m
 $^{-2}$
for the brightest pulse with RM-Tools (Van Eck et al. Reference Van Eck2026). After applying RM correction, the linear polarisation fraction is
 $\sim$
70%. This object is also highly circularly polarised
 $\sim$
45% (see Figure 6). The fainter pulses on 22 July 2025 show a consistent RM of
 $-139\pm6$
rad m
 $^{-2}$
. We measured the pulse width (at FWHM) as
 $\sim$
 $570\pm15$
s, corresponding to a duty cycle of
 $\sim$
 $2.4\%$
. This is comparable to that of the previously discovered LPT ASKAP J183950.5
 $-$
075635.0 (Lee et al. Reference Lee2025), which has a similar rotation period.
The field containing ASKAP J165130.3
 $-$
450520 has been observed in 61 archival ASKAP observations, including the VAST survey, spanning from April 2019 to November 2024. Since the end of 2022, the VAST survey has monitored this field approximately every two weeks. The source was detected in only one of these 61 observations, a RACS observation on 21 November 2024. During the detection, the source had a flux density of
 $\sim$
4 mJy and exhibited strong circular polarisation at
 $\sim$
60% level. Using the current timing solution, the RACS detection corresponds to a pulse phase of approximately
 $-0.1$
, slightly offset from the predicted arrival time. The RACS observation is only 15 min long, and the pulse is too faint to allow a measurement of the arrival time. Additional detections from future follow-up observations would be useful to refine the timing solution and resolve this discrepancy.
We observed this object with MeerKAT on 10 October 2025 at UHF band (544–1 087 MHz) for 3 h but detected no emission. This is not surprising as this object exhibits rapid flux decay: the pulse peak flux density decreased from 20 to 5 mJy within 10 days, and it is possible that this source had dropped below the MeerKAT sensitivity limit (
 $3\sigma$
limit of
 $\sim$
0.1 mJy) after three months.
We do not find any multi-wavelength counterpart for this object (see Figure 4). The deepest infrared observation available in this region is the VISTA Variables in the Via Lactea (VVV) survey (Minniti et al. Reference Minniti2010), which provides a
 $5\sigma$
limiting magnitude of
 $J\gt 20.5$
mag (AB). Given the low Galactic latitude and high extinction along this line of sight (
 $\sim$
10 mag at J band; Schlafly & Finkbeiner Reference Schlafly and Finkbeiner2011), this limit is less constraining than other LPTs for which multi-wavelength counterparts have been detected.
4.1.2 LPT: ASKAP J170036.6
$-$
445758

We detected five pulses across three ASKAP observations. We extracted full-polarisation, high-resolution dynamic spectra using the same method as above. Figure 7 shows the light curves obtained by averaging the total intensity dynamic spectra over frequency and binning the time resolution from 10 s to 15 min.
This object was not detected in any of the 115 ASKAP archival observations from April 2019 to November 2024. We measured a pulse width of
 $20\pm3$
min, corresponding to a duty cycle of approximately 7%. The dynamic spectra show weak circularly polarised emission (
 $\sim$
30% in Stokes V), but no detectable linear polarisation in Stokes Q or Stokes U.
We conducted a 3 h MeerKAT follow-up observation at UHF band on 26 September 2025 and detected a very faint pulse at the expected time (see Figure 7). The decreased flux density suggests rapid fading for this object (dropping from
 $\sim$
2.5 mJy to
 $\sim$
0.25 mJy), similar to other LPTs (e.g. Hurley-Walker et al. Reference Hurley-Walker2022). The MeerKAT observation provides an independent position measurement of RA =
 $17^{\rm h}00^{m\rm }36.46^{\rm s}\pm0.91$
arcsec and Dec =
 $-44^\circ57'58.91''\pm0.59$
arcsec, consistent with the ASKAP position.
We estimated the period with all six detected pulses (including the fainter one in the MeerKAT observation) using the same method as above, and the best measured period is
 $4.6933\pm0.0002$
h. We do not identify any multi-wavelength counterpart for this object (see Figure 4). The VVV survey provides a
 $5\sigma$
limiting magnitude of
 $J\gt 19.8$
mag (Minniti et al. Reference Minniti2010). The extinction along this line of sight is
 $\sim$
2 mag at J band (Schlafly & Finkbeiner Reference Schlafly and Finkbeiner2011).
4.2 Unidentified sources
Two transients lack multi-wavelength counterparts and remain of uncertain nature. We analysed their polarisation properties, checked radio archival observations and conducted follow-up observations, to investigate their nature.
Four detected pulses of ASKAP J165130.3
 $-$
450520 aligned to its measured period. The observation start times are listed on the left of each detection. The light-curve time resolution is averaged to 1 min.

Full-Stokes dynamic spectrum of ASKAP J165130.3
 $-$
450520 in observation on 11 July 2025. The time resolution is averaged to 1 min, and the frequency resolution is averaged to 4 MHz. This observation used an experimental field-based calibration scheme to reduce calibration overheads involved when switching between bands and/or footprints, and therefore resulted in an excess of residual leakage from Stokes I to Stokes Q, other Stokes parameters were not adversely affected.

Six detected pulses of ASKAP J170036.6
 $-$
445758 aligned to its measured period. The first five pulses were detected with ASKAP, and the last pulse was detected with MeerKAT. The observation start times are listed on the left of each detection. The light-curve time resolution is averaged to 15 min.

4.2.1 Pulsar candidate: ASKAP J045522.4
$-$
350523

ASKAP J045522.4
 $-$
350523 was detected in 11 out of 29 archival ASKAP observations, with flux densities ranging from 1.5 to 2 mJy in the detected epochs. This object is circularly polarised with a Stokes V flux density of
 $-135\pm24\,\unicode{x03BC}$
Jy, corresponding to circular polarisation fraction of 8%. Circular polarisation is rare in radio sources and is typically associated with pulsars or stellar flares, which often show fractional circular polarisation of
 $\sim$
10% or above (e.g. Lenc et al. Reference Lenc, Murphy, Lynch, Kaplan and Zhang2018; Pritchard et al. Reference Pritchard2021). We do not find any multi-wavelength counterparts for this object (see Figure 4), leading to a
 $5\sigma$
limiting magnitude
 $J\gt 21.3$
mag from the Vista Hemisphere Survey (VHS; McMahon et al. Reference McMahon2013). The combination of high fractional circular polarisation and the absence of an infrared counterpart suggests that ASKAP J045522.4
 $-$
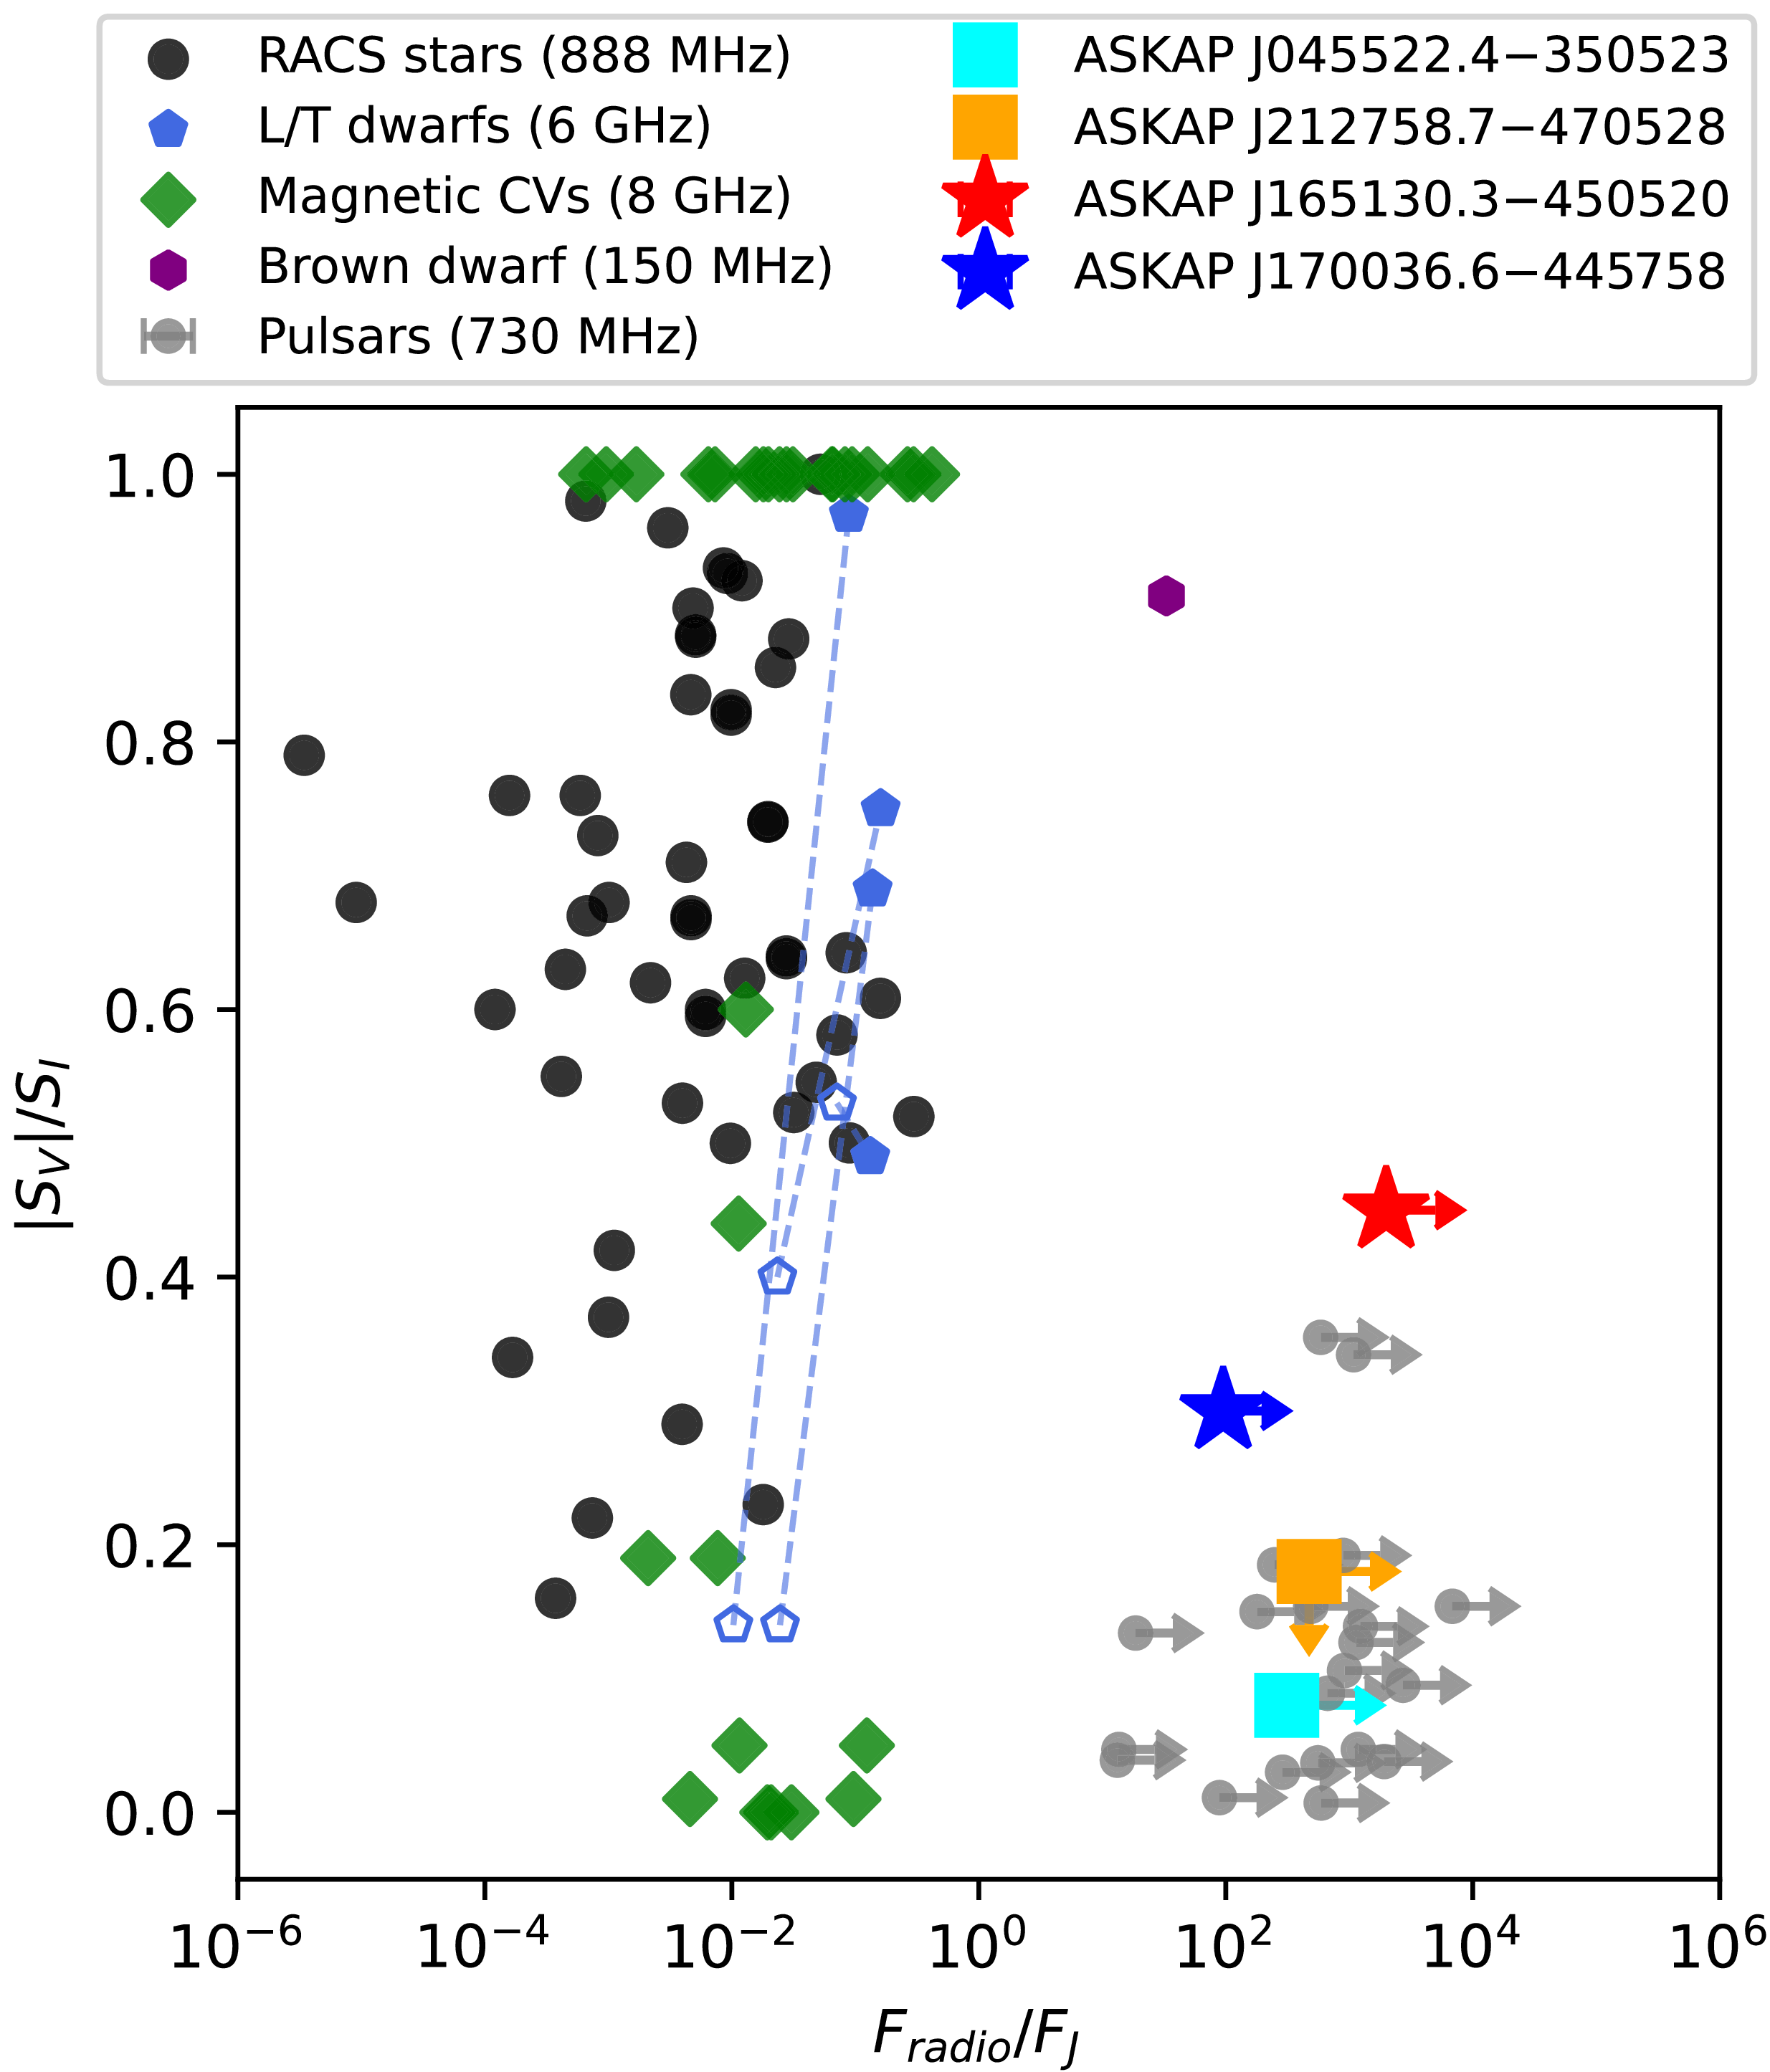
350523 is likely a pulsar candidate (as shown in Figure 8).
Fractional circular polarisation versus radio-to-near-infrared flux ratio for stellar objects and pulsars. The red and blue stars represent the two LPTs detected in this work, and the cyan and orange squares represent the two unidentified sources detected in this work. The black circles represent radio stars measured in RACS at 888 MHz (Pritchard et al. Reference Pritchard2021), the blue pentagons represent quiescence (open symbols) and peak (filled symbols) auroral emissions from L/T dwarfs at 6 GHz (Kao et al. Reference Kao2016), the green diamonds represent magnetic cataclysmic variables at 8 GHz (Barrett et al. Reference Barrett, Dieck, Beasley, Mason and Singh2020), the purple hexagon represents the recently discovered brown dwarf BDR J1750
 $+$
3809 at 150 MHz (Vedantham et al. Reference Vedantham2020), the grey circles represent a group of pulsars measured at 730 MHz (Dai et al. Reference Dai2015). We note that the two unidentified sources are consistent with the pulsar region. Figure adapted from Wang et al. (Reference Wang2022).

We observed ASKAP J045522.4
 $-$
350523 with the Australia Telescope Compact Array (ATCA) on 4 November 2025 for 4.5 h between 1 140–3 060 MHz (project code C3363). The primary aim was to measure the spectral index. We used PKS J1934
 $-$
638 as the primary bandpass calibrator, and PKS 0439
 $-$
337 as the phase calibrator. The data were flagged, calibrated, and imaged with CASA (CASA Team et al. Reference Team2022). However, no emission was detected in the image, resulting in a
 $3\sigma$
upper limit of
 $16\,\unicode{x03BC}$
Jy.
We observed ASKAP J045522.4
 $-$
350523 with the Parkes telescope on 30 November 2025 for 45 min (project code PX143). The observation covered a frequency range of 704–4 032 MHz (Hobbs et al. Reference Hobbs2020), divided into 3328 channels with a bandwidth of 1 MHz each. Pulsation searches were performed using the PRESTO software (Ransom et al. Reference Ransom, Eikenberry and Middleditch2002). To maintain sensitivity to short–orbital-period pulsars in binary systems, we carried out a Fourier-domain acceleration search with a drift-rate range of
 $z=\pm150$
(Andersen & Ransom Reference Andersen and Ransom2018; Ng et al. Reference Ng2015). The search was conducted over a dispersion measure (DM) range of 0–100 pc cm
 $^{-3}$
(the estimated maximum DM at this direction is
 $\sim$
40 pc cm
 $^{-3}$
; Cordes & Lazio Reference Cordes and Lazio2002; Yao et al. Reference Yao, Manchester and Wang2017) using the RFI-cleaned 960–3 008 MHz sub-band (Zhang et al. Reference Zhang2019). No pulsed emission was detected. Assuming a detection threshold of
 ${\rm S/N}=8$
, the radiometer equation (Lorimer & Kramer Reference Lorimer and Kramer2004) yields a flux-density upper limit of
 $\sim$
27
 $\mu$
Jy at a central frequency of
 $f_c=1\,984$
MHz, for an intrinsic duty cycle of 10% and spin periods of
 $\sim$
10 ms or longer.
The non-detections with both ATCA and Parkes are likely attributed to the highly intermittent nature of this object.
4.2.2 Pulsar candidate: ASKAP J212758.7
$-$
470528

ASKAP J212758.7
 $-$
470528 is detected in 19 of 89 archival ASKAP observations. The Stokes I integrated flux density varies between 0.98 and 6.4 mJy. We do not detect any circular polarisation for this object with a
 $3\sigma$
limit of
 $\sim$
0.1 mJy, corresponding to a polarisation fraction
 $\lt 18\%$
. This object was first detected as a transient with unknown progenitor in the VAST pilot survey (Murphy et al. Reference Murphy2021). Dynamic spectra of the brightest archival detections show similar rising and falling behaviour as seen in Figure 3 on timescales of minutes.
We do not find any multi-wavelength counterparts for this object (see Figure 4), leading to a
 $5\sigma$
limiting magnitude
 $J\gt 21.1$
mag from VHS (McMahon et al. Reference McMahon2013). We identified a radio counterpart, GLEAM-X J212758.5
 $-$
470524, in the low-frequency GLEAM-X survey, where it exhibits flux densities of 38 mJy at 76 MHz and 4 mJy at 227 MHz (Ross et al. Reference Ross2024). The inferred steep spectral index (
 $\sim-1.4$
), together with the strong variability seen in the ASKAP observations, suggests that ASKAP J212758.7
 $-$
470528 is likely a pulsar candidate. This object has been detected by the CRACO system, and the details will be presented in Jaini et al. (in preparation).
4.3 Other transient and variable sources
The remaining transients all have identified counterparts, as listed in Table 2.
4.3.1 AGN
Two transients are classified AGN based on their infrared counterparts in the WISE survey (see Figure 4) and their locations on the WISE colour–colour diagram (Wright et al. Reference Wright2010). At this observing frequency (
 $\sim$
1 GHz) and timescale (15 min), their variability is unlikely to be intrinsic, as the estimated brightness temperature would greatly exceed the inverse Compton limit
 $T_b\sim10^{12}$
K for incoherent synchrotron emission (Kellermann & Pauliny-Toth Reference Kellermann and Pauliny-Toth1969). Instead, the most plausible origin of the observed variability is enhanced scintillation caused by nearby plasma screens (Dennett-Thorpe & de Bruyn Reference Dennett-Thorpe and de Bruyn2002). AGN exhibiting this behaviour are commonly referred to as intra-day variables (IDVs). We note that the two IDVs are found in the same ASKAP field, with a separation of only a few degrees. This clustered sky distribution is consistent with that reported by Wang et al. (Reference Wang2023).
4.3.2 Known pulsars
We identified nine pulsars by cross-matching with the ATNF Pulsar Catalogue (Manchester et al. Reference Manchester, Hobbs, Teoh and Hobbs2005). Pulsars are known to exhibit variability due to a range of intrinsic and propagation effects. On this timescale (15 min), the primary reason would be diffractive scintillation (e.g. Wang et al. Reference Wang2023), a propagation effect caused by small-scale fluctuations in the interstellar medium (Narayan Reference Narayan1992). We estimated the diffractive scintillation timescales for these pulsars using their DMs and inferred distances (Yao et al. Reference Yao, Manchester and Wang2017). Assuming a transverse velocity of 100 km s
 $^{-1}$
, we find that six of the nine pulsars have estimated diffractive timescales between 2 and 30 min at 1 GHz, consistent with what we observed. Pulsars are also known to suddenly cease their radio emission for seconds, days, or years (Kramer et al. Reference Kramer, Lyne, O’Brien, Jordan and Lorimer2006). This intermittent behaviour can cause integrated flux density variations that can be detected by VASTER. PSR J1709
 $-$
4401 is likely a highly intermittent object, with clear ‘on’ and ‘off’ states showing in its lightcurve (see Figure 3). Another object, PSR J1646
 $-$
4405 stands out as it is a candidate redback pulsar binary (Zic et al. Reference Zic2024), and the variability is primarily due to eclipses by the companion.
4.3.3 Stars
Three identified stars, HD 25284, 1RXS J040710.6
 $-$
291823, and L274-89 are K or M dwarf stars, which are known to produce radio flares on timescales ranging from seconds to hours due to strong magnetic fields (e.g. Dulk Reference Dulk1985). Among them, L274-89 has been reported in the Sydney Radio Star Catalogue (Driessen et al. Reference Driessen2024), while 1RXS J040710.6
 $-$
291823 and HD 25284 have not been detected in the radio before. Two of our identified stars, HD 34736 and CU Vir, are magnetic chemically peculiar stars. Both of them have been detected in radio before (Semenko et al. Reference Semenko2024; Driessen et al. Reference Driessen2024). The remaining object, UCAC4 293-006715, has been classified as an RS Canum Venaticorum (RS CVn) binary system (Gaia Collaboration et al. 2023). RS CVn systems are known to have strong magnetic fields generated by rapid, tidally induced rotation periods, and are able to produce both quiescent and coherent radio bursts (e.g. White & Franciosini Reference White and Franciosini1995). UCAC4 293-006715 has not previously been reported to exhibit radio emission.
5. Discussion
During the first two weeks of operation of the VASTER real-time system, we detected 21 highly variable sources over a total observing time of 205 h, corresponding to a rough detection rate of
 $\sim$
1 transient per 10 h. This rate is consistent with the previous work using the VASTER offline pipeline on a 15 min timescale with the ASKAP pilot surveys (Wang et al. Reference Wang2023).
Among these 21 variable sources, four are unusual: two previously undetected LPTs and two pulsar candidates. A simple scaling suggests that VASTER is able to find
 $\sim$
1 unusual transient per 50 h of observing time. However, quantifying this discovery rate is difficult because the spatial distribution of LPTs (and pulsars) is not isotropic. Instead, Dobie et al. (Reference Dobie2024) note a strong bias towards them being located at very low Galactic latitudes. As shown in Figure 2, excluding the ToO observations triggered by the analysis in this work, only two of the 25 observations analysed in this work (SB74690 and SB74878) are at low Galactic latitude. The only observation close to the Galactic centre (SB74690) contains both of the new LPTs, reinforcing the previously reported Galactic latitude dependence.
For the two discovered LPTs, the real-time detection enabled by VASTER allowed us to conduct follow-up observations rapidly within
 $\sim$
10 days, successfully re-detecting both objects. A further follow-up observation three months later showed that one object, ASKAP J165130.3
 $-$
450520, had become inactive, and the other one, ASKAP J170036.6
 $-$
445758, was
 $\sim$
10 times fainter than before. This highlights the importance of VASTER’s ability to run in real time, enabling timely follow-up observations for highly intermittent sources such as LPTs.
VASTER is currently running on 15 min timescales, making it most sensitive to variability on timescales of hours (such as LPTs with periods of a few hours like those reported in this work). In future, we plan to move to higher time resolution, and ultimately perform search at the raw correlator dump rate (10 s). This would allow us to detect objects on seconds-to-minutes timescales, including LPTs with periods of a few minutes. We also plan to improve candidate classification strategies to reduce the number of false detections. In this work, a total of 399 candidates were reported by VASTER, of which 58 were found to be genuine detections after manual inspection (corresponding to 21 unique transients since many were detected multiple times in adjacent beams and/or different fields), implying a true-positive rate of
 $\sim$
15%. While the current number of candidates is manageable, classification still requires some human effort (and time). As the volume of data (and human-labelled candidates) grows, VASTER will provide an ideal training set for machine-learning–based classification, which will significantly reduce human workload and improve system robustness.
This work represents the first demonstration of an image-domain transient detection pipeline operating commensally in real time on a widefield radio telescope, representing an important step towards transient searches with the SKA observatory.Footnote n The bulk of LPTs reported to-date have been found via coarse fast imaging (similar to that reported in this work), circular polarisation searches, or as transients in single images and characterising them (periods, DM, RM, and pulse morphology) has required reprocessing the corresponding visibilities. This approach is not possible in the SKA era, as visibilities will not be stored due to data volume constraints. Hence, a robust real-time detection pipeline that can also automatically produce high-resolution spectra is necessary to continue scientific studies of LPTs and other transients in the SKA era.
6. Conclusion
VASTER is the first short-timescale imaging and transient-detection pipeline operating commensally in real time on a wide-field radio telescope. In its first two weeks of operation, VASTER has demonstrated its capability to identify minute-cadence transients in real time, including the discovery of two new LPTs. VASTER bridges the gap between existing transient surveys, which typically target either millisecond or day-to-year variability. This capability makes ASKAP the only facility in the world with dedicated pipelines capable of discovering transients across a broad range of timescales: from milliseconds with CRAFT/CRACO, to seconds–hours with VASTER, and to days–years with the VAST survey. With the continued operation of ASKAP over the coming years, VASTER is expected to identify more LPTs and potentially new types of transients, providing a better understanding of the dynamic radio sky and its diverse physical processes.
Acknowledgements
We thank the anonymous referee for the careful review and constructive suggestions. YW acknowledges support through the Australian Research Council grant DP220102305 and FT190100155. This research was supported by the Australian Research Council Centre of Excellence for Gravitational Wave Discovery (OzGrav), project number CE230100016. DLK was supported by NSF grants AST-1816492 and AST-2511757. RMS acknowledges support through ARC Discovery Project DP220102305.
This scientific work uses data obtained from Inyarrimanha Ilgari Bundara/the Murchison Radio-astronomy Observatory. We acknowledge the Wajarri Yamaji People as the Traditional Owners and native title holders of the Observatory site. CSIRO’s ASKAP radio telescope is part of the Australia Telescope National Facility (https://ror.org/05qajvd42). Operation of ASKAP is funded by the Australian Government with support from the National Collaborative Research Infrastructure Strategy. ASKAP uses the resources of the Pawsey Supercomputing Research Centre. Establishment of ASKAP, Inyarrimanha Ilgari Bundara, the CSIRO Murchison Radio-astronomy Observatory and the Pawsey Supercomputing Research Centre are initiatives of the Australian Government, with support from the Government of Western Australia and the Science and Industry Endowment Fund. The Australia Telescope Compact Array is part of the Australia Telescope National Facility (https://ror.org/05qajvd42) which is funded by the Australian Government for operation as a National Facility managed by CSIRO. We acknowledge the Gomeroi people as the Traditional Owners of the Observatory site. Murriyang, CSIRO’s Parkes radio telescope, is part of the Australia Telescope National Facility (https://ror.org/05qajvd42) which is funded by the Australian Government for operation as a National Facility managed by CSIRO. We acknowledge the Wiradjuri people as the Traditional Owners of the Observatory site. The MeerKAT telescope is operated by the South African Radio Astronomy Observatory, which is a facility of the National Research Foundation, an agency of the Department of Science and Innovation.
Part of this work was performed on the OzSTAR national facility at Swinburne University of Technology. The OzSTAR programme receives funding in part from the Astronomy National Collaborative Research Infrastructure Strategy (NCRIS) allocation provided by the Australian Government and from the Victorian Higher Education State Investment Fund (VHESIF) provided by the Victorian Government. This work was supported by software support resources awarded under the Astronomy Data and Computing Services (ADACS) Merit Allocation Program. ADACS is funded from the Astronomy National Collaborative Research Infrastructure Strategy (NCRIS) allocation provided by the Australian Government and managed by Astronomy Australia Limited (AAL). This research was supported by use of the Nectar Research Cloud, a collaborative Australian research platform supported by the NCRIS-funded Australian Research Data Commons (ARDC). This paper includes archived data obtained through the CSIRO ASKAP Science Data Archive, CASDA (http://data.csiro.au). This research has made use of the SIMBAD database, operated at CDS, Strasbourg, France This research has made use of the VizieR catalogue access tool, CDS, Strasbourg, France (Ochsenbein Reference Ochsenbein1996). The original description of the VizieR service was published in Ochsenbein et al. (Reference Ochsenbein, Bauer and Marcout2000). This paper draft has used ChatGPT for grammar checking.
This research has made use of Aegean (Hancock et al. Reference Hancock, Murphy, Gaensler, Hopkins and Curran2012, Reference Hancock, Trott and Hurley-Walker2018), APLpy (Robitaille & Bressert Reference Robitaille and Bressert2012), ASKAPsoft (Guzman et al. Reference Guzman2019), Astropy (Astropy Collaboration et al. Reference Collaboration2013; Astropy Collaboration et al. Reference Collaboration2018), Astroquery (Ginsburg et al. 2019), Matplotlib (Hunter Reference Hunter2007), NumPy (Harris et al. Reference Harris2020), oxkatFootnote o (Heywood Reference Heywood2020), PyGDSM (Price Reference Price2016), SciPy (Virtanen et al. Reference Virtanen2020), Selavy (Whiting & Humphreys Reference Whiting and Humphreys2012), tempo2 (Hobbs et al. Reference Hobbs, Edwards and Manchester2006), and wsclean (Offringa et al. Reference Offringa2014).
Data availability statement
The ASKAP data used in this paper can be accessed through the CSIRO ASKAP Science Data Archive (CASDAFootnote p ) under project codes AS113 and AS201. Among these observations, SB74815 and SB74873 were rejected by the EMU team, and SB74690 has not yet finished standard processing. These three observations are not publicly released.
Appendix A. VASTER candidate examples
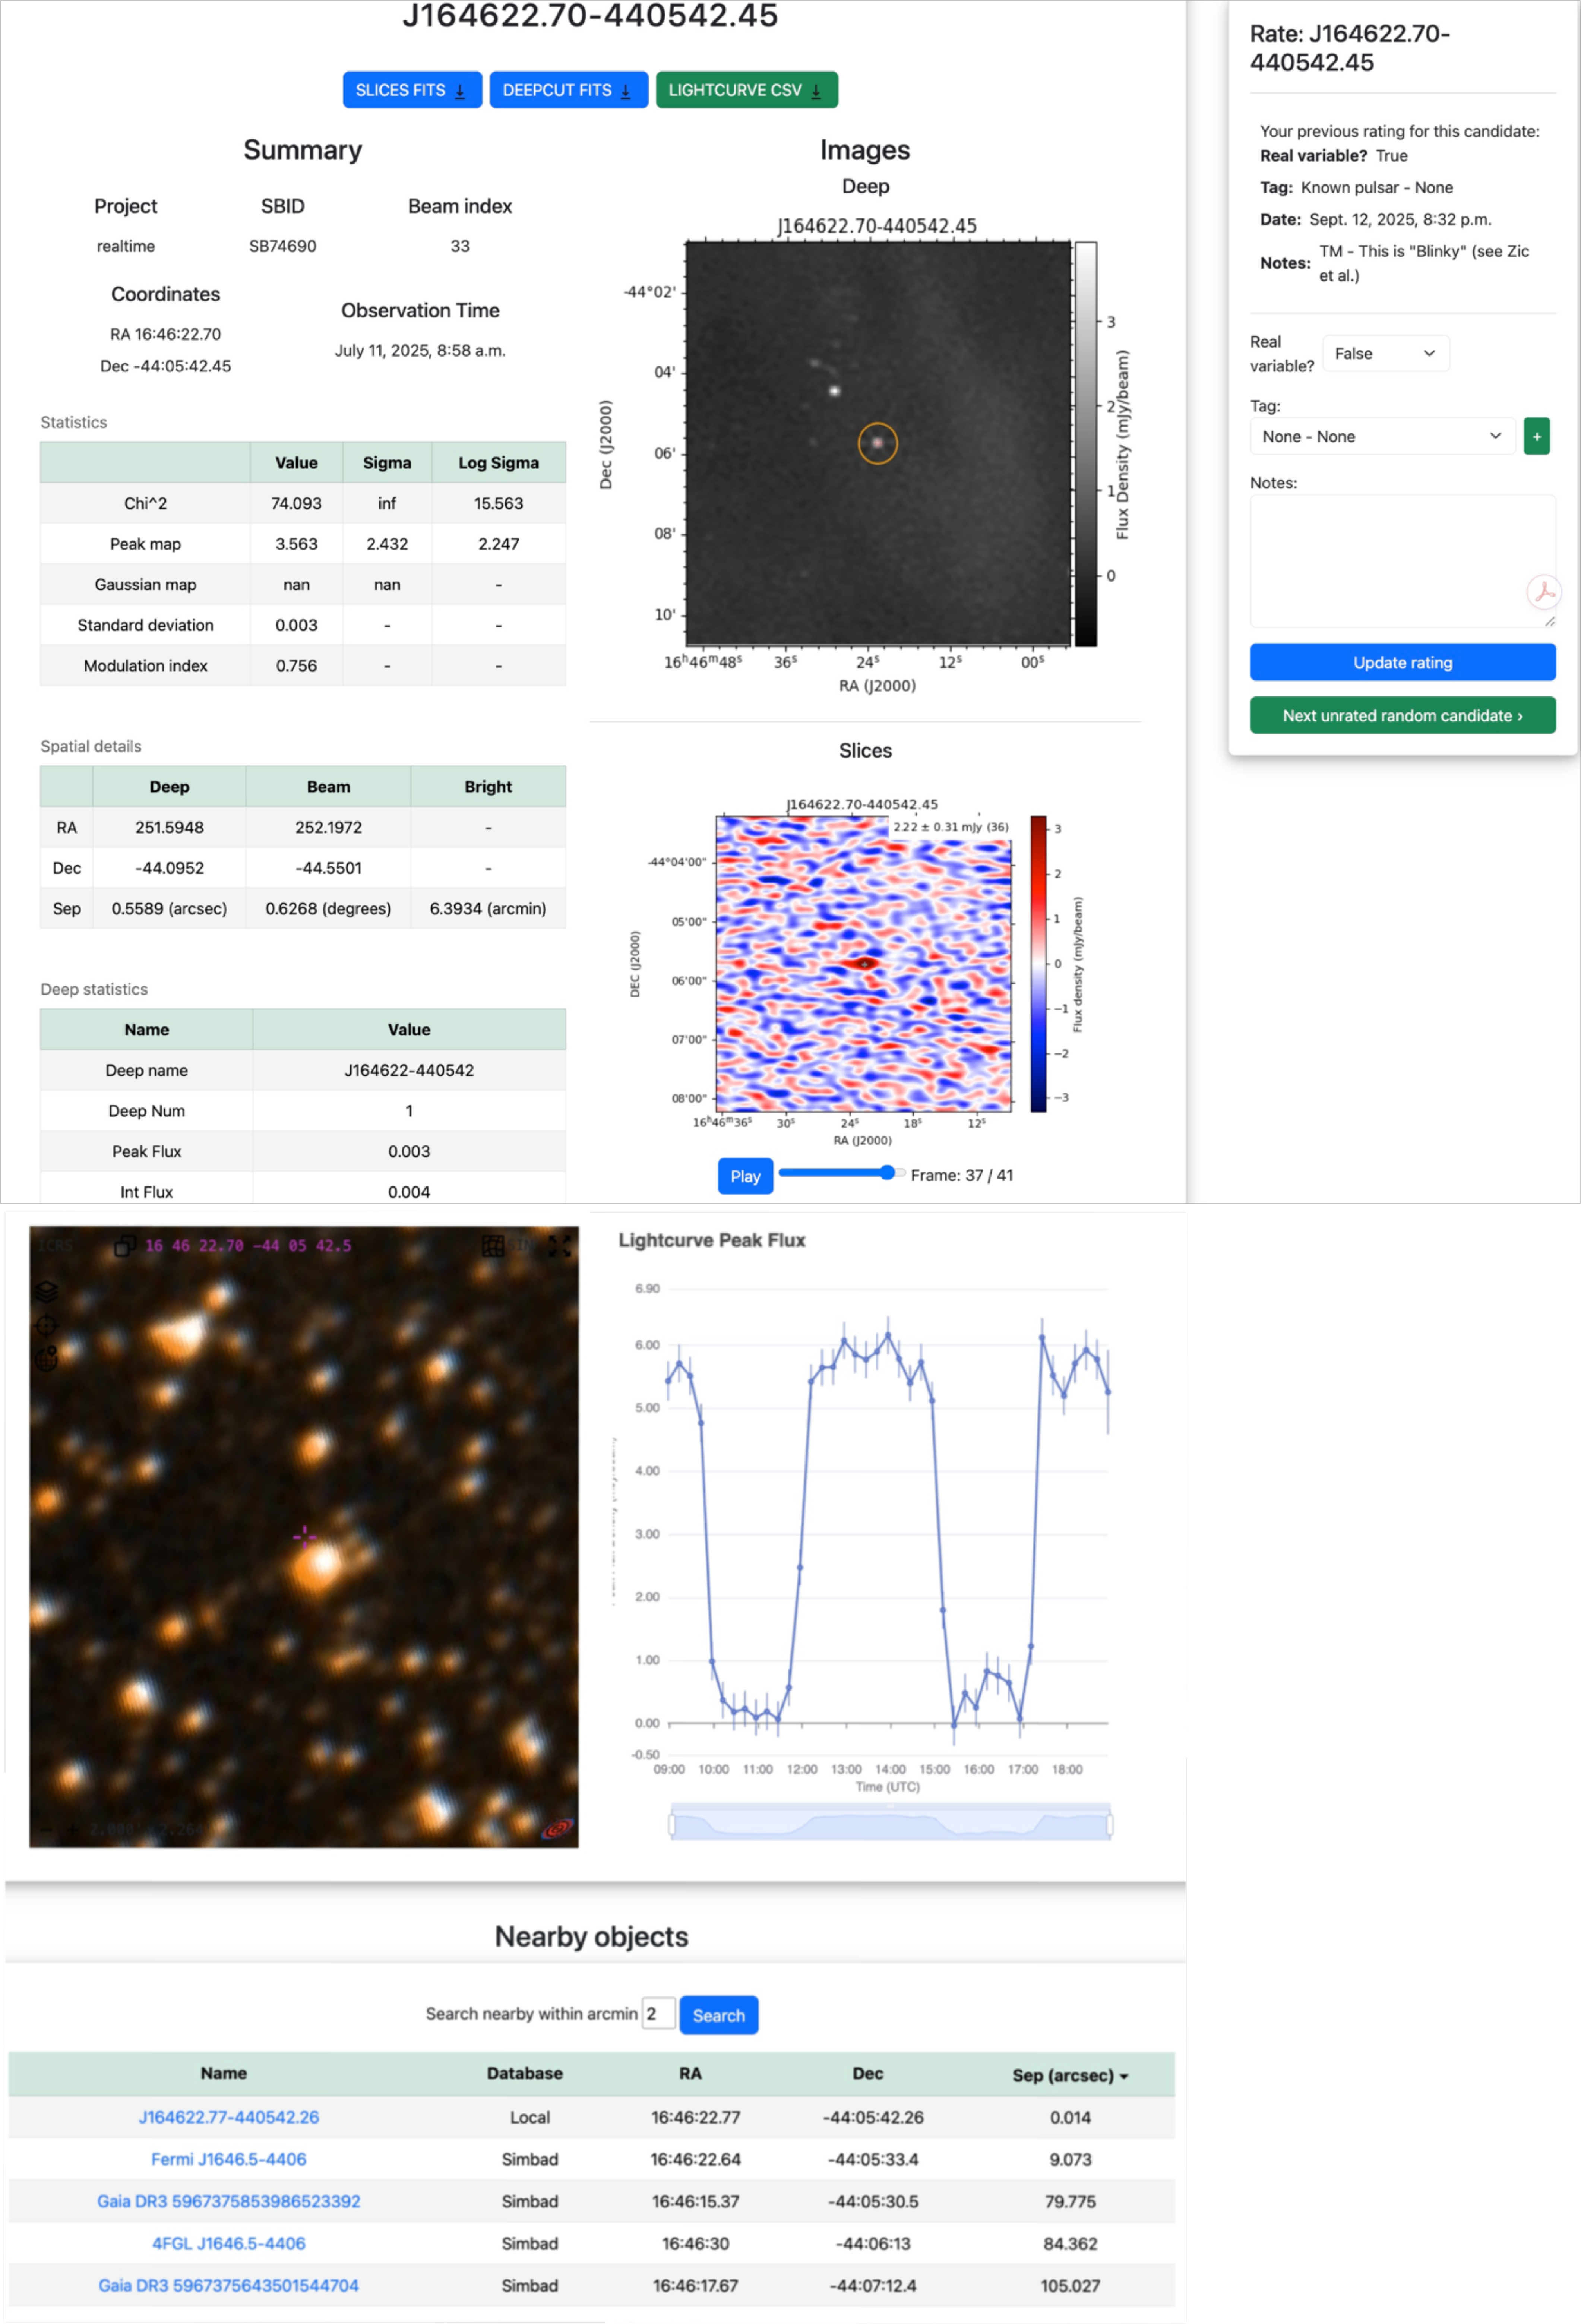
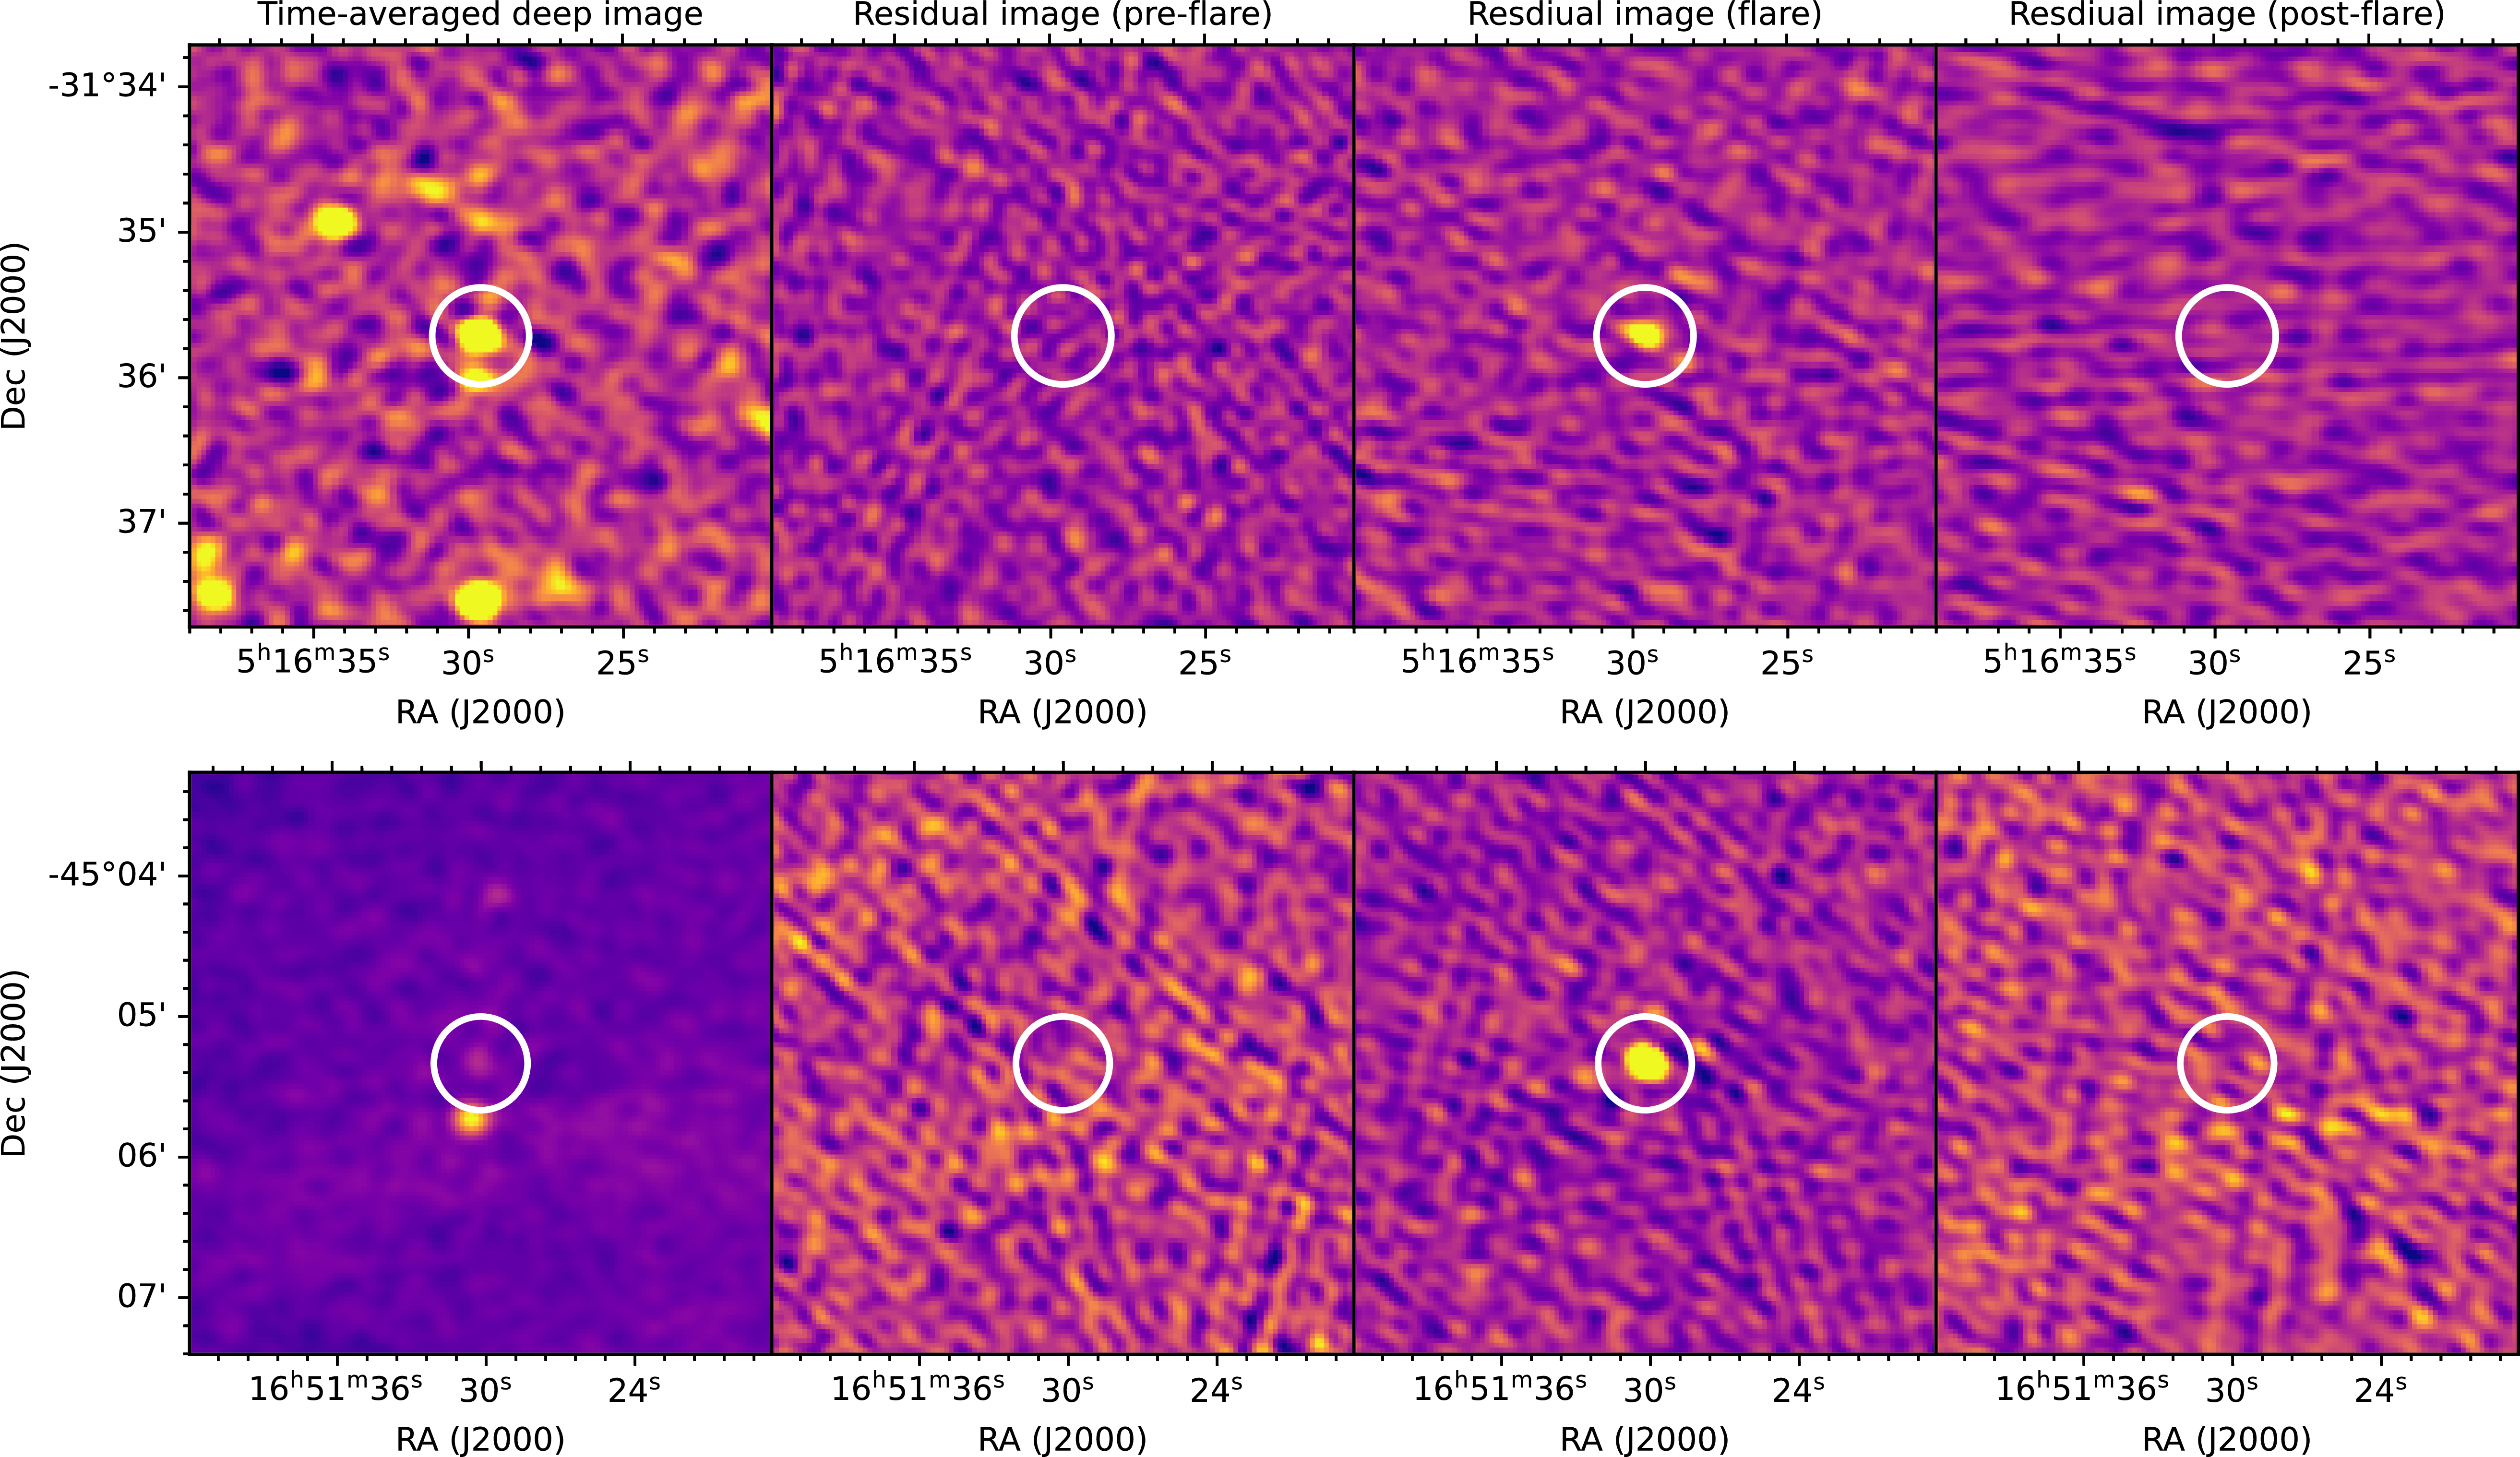
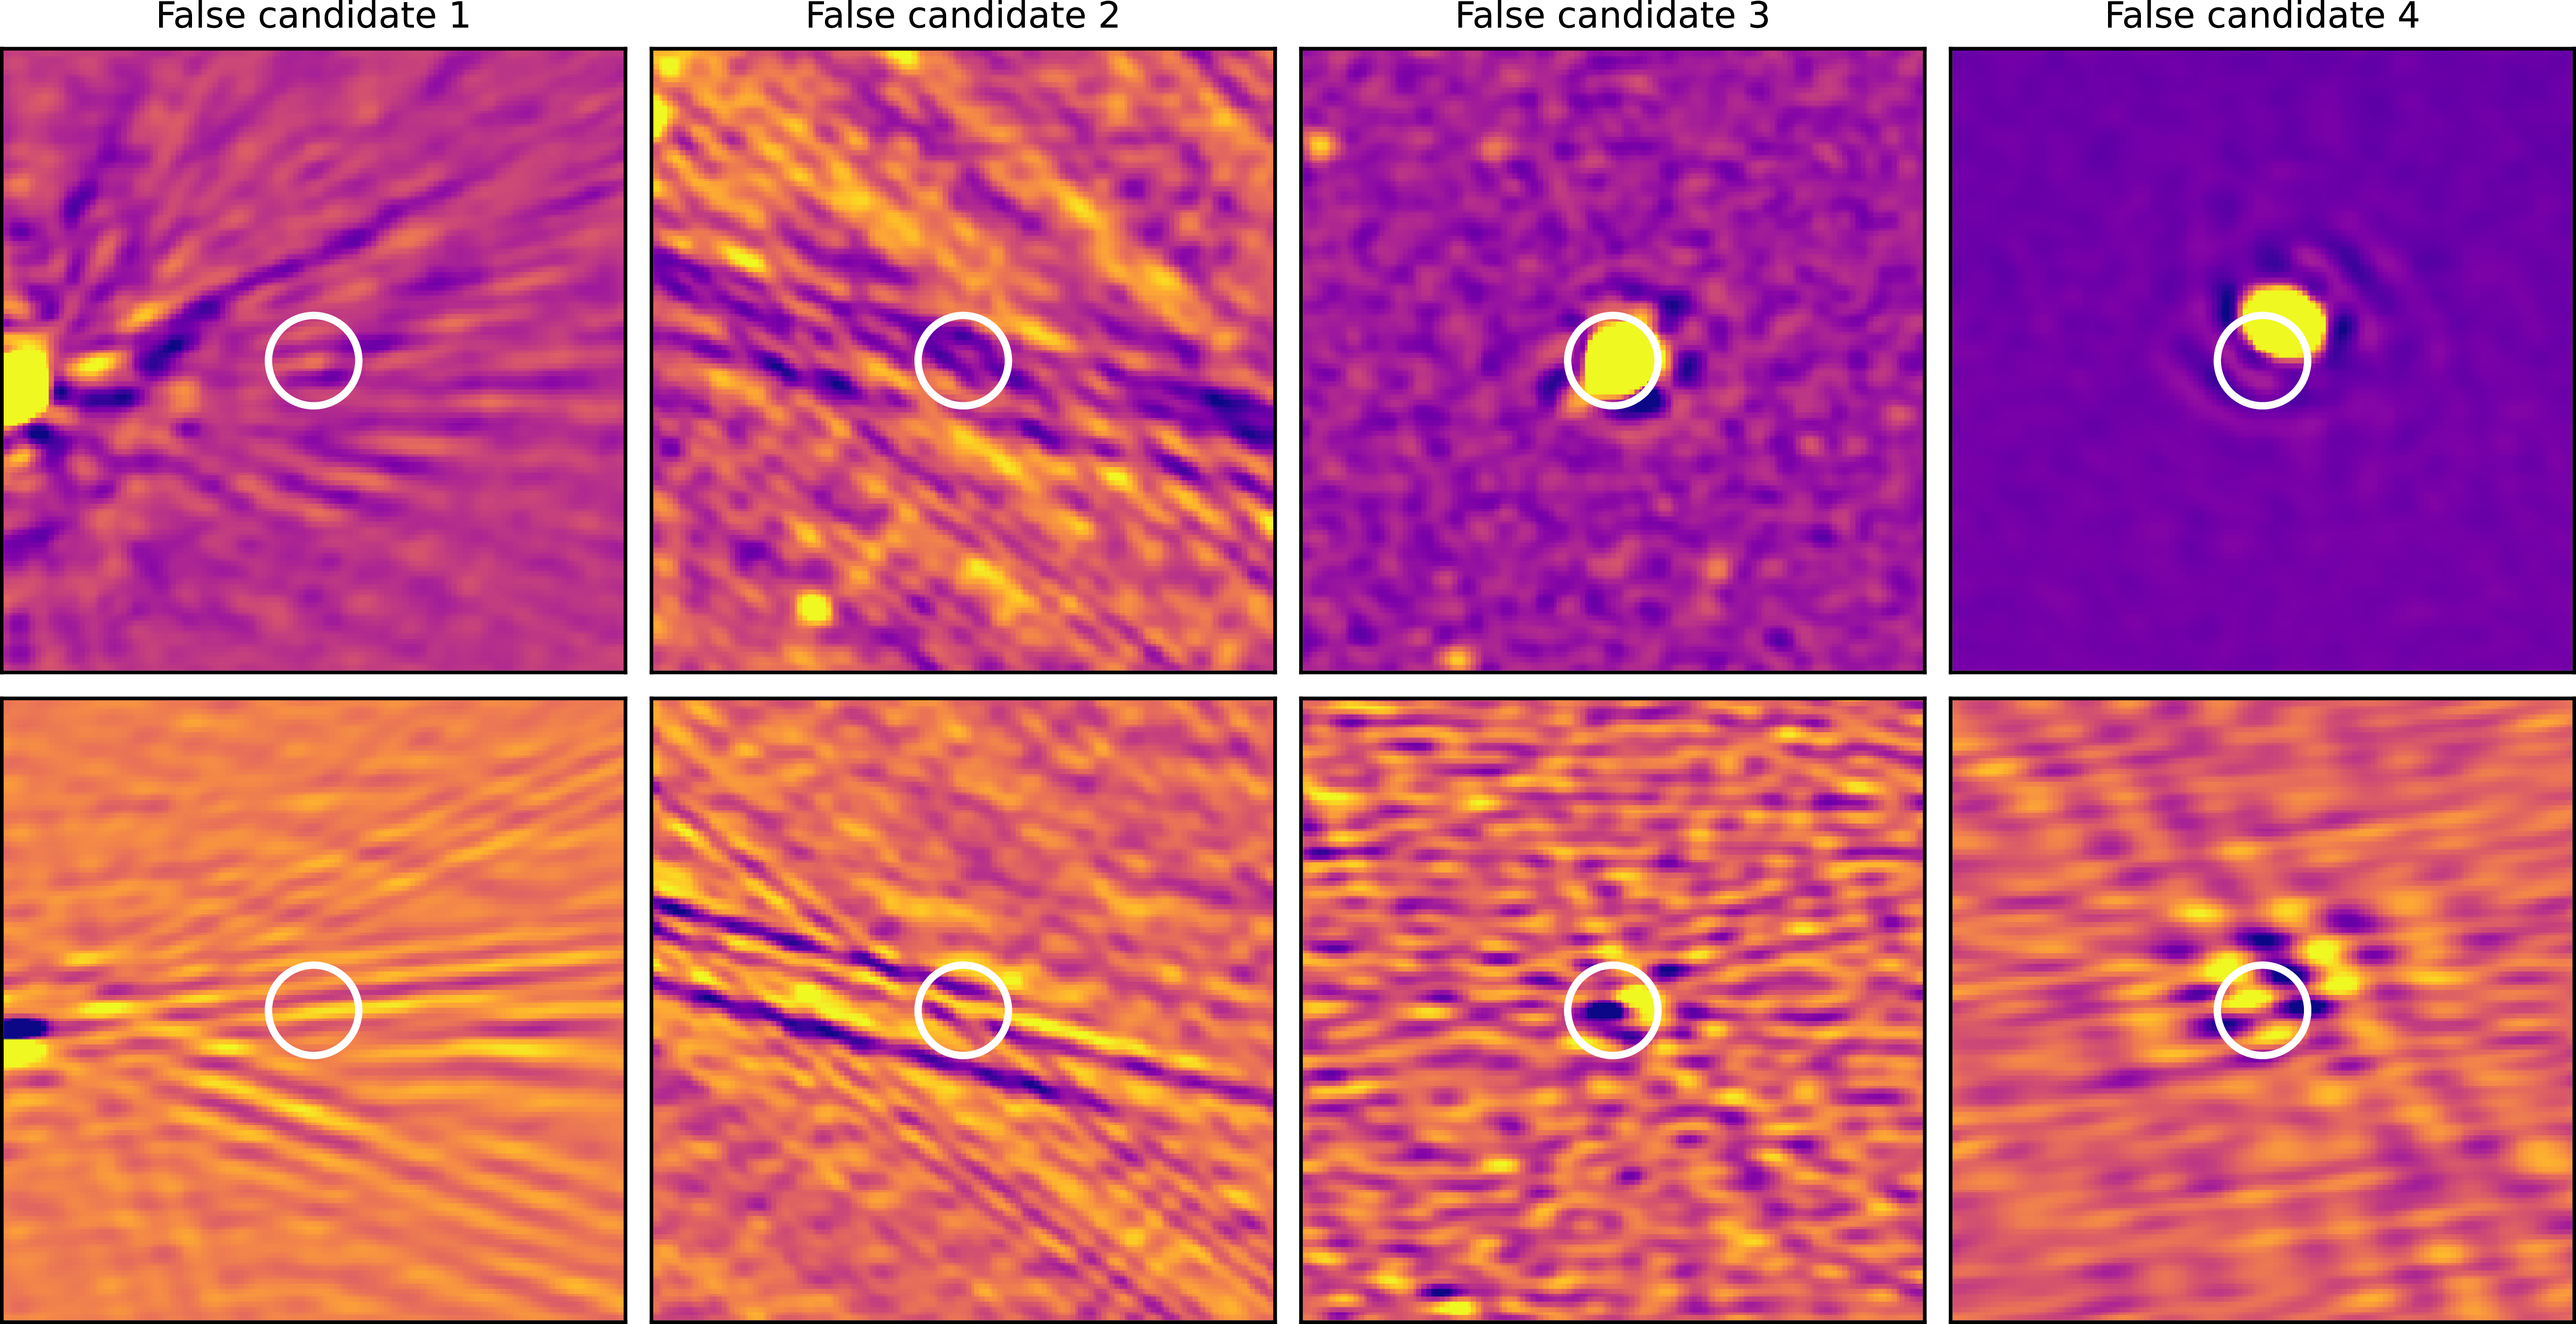
We present examples of VASTER outputs in this section. Figure A1 shows an example candidate displayed in the VASTER web inspection tool. Figure A2 presents examples of real transient events in the time-averaged deep images and short-timescale residual images, showing how genuine sources appear in the VASTER outputs. Figure A3 shows examples of typical false candidates, characterised by non–PSF-like artefacts in the residual images.
Example of a transient candidate displayed in the VASTER web inspection tool. The summary panel (top left) provides observation metadata and candidate statistics. The time-averaged deep image (top centre), the short-timescale residual images (‘slices’, middle), and the intra-observation light curve (bottom right) are shown as a central column. The right panel provides the classification interface, where users can assess if the candidate is real, assign a source type, and add notes. The bottom-left panel (next to the lightcurve) shows an Aladin interface, enabling visualisation of multi-wavelength images from major surveys. Additional information on nearby sources is provided in the lower panel. Note that the web interface is under active development, and future versions may differ from the one shown here.

Examples of transient detections in the time-averaged deep images and short-timescale residual images, plotted from the VASTER outputs, for two sources: the flaring star ASKAP J051629.6
 $-$
313543 (top row) and the LPT ASKAP J165130.3
 $-$
450520 (bottom row). From left to right in each row: the time-averaged deep image, the residual image prior to the flare, the residual image during the flare, and the residual image after the flare. The white circle marks the target source position, with a radius of 20 arcsec. While the deep image contains multiple sources, these are effectively subtracted in the residual images; only the transient emission from the target source is visible during the flare.

Examples of typical false candidates in the VASTER outputs. Each column corresponds to one candidate: the top row shows the time-averaged deep images, and the bottom row shows the representative residual images. The white circle marks the candidate source position, with a radius of 20 arcsec. In the residual images, these candidates appear as non–PSF-like artefacts, which is a key indicator used to identify and reject false detections.

 1σ
 1σ
 −
 η
 S/Npeak
 Sdeep
 −
 −
 −
 +
 −
 −

 Open access

